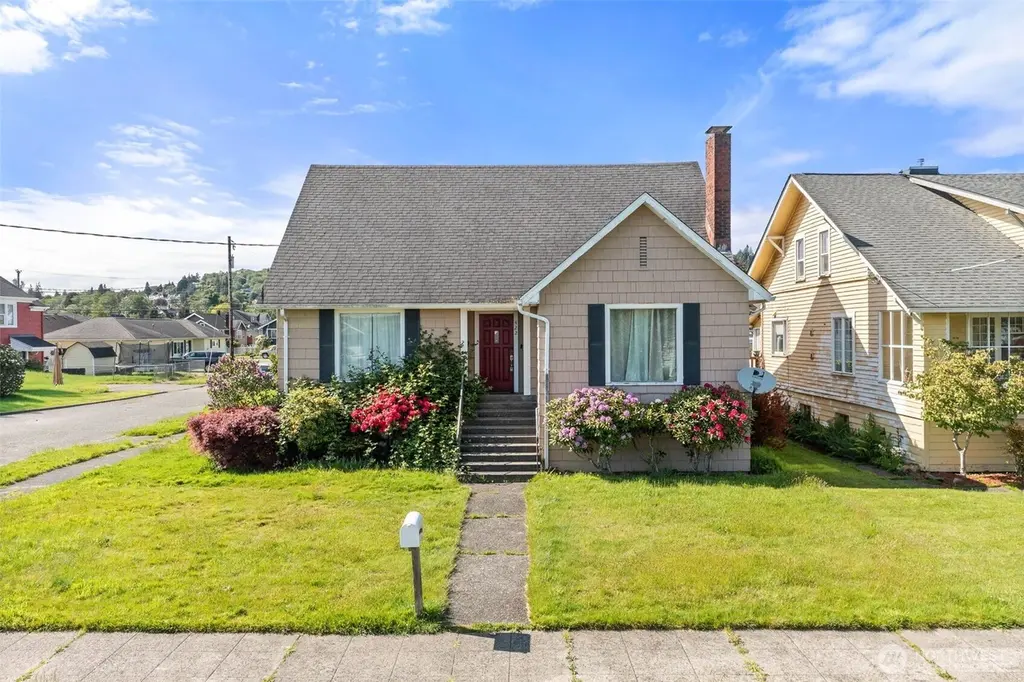
422 W 3rd St · Aberdeen, WA
Flood risk 8/10 · Major
- FEMA flood zone
- X (unshaded)
- Chance of flooding over 30 yrs
- 0.99%
- Est. flood insurance / yr
- $473 – $860
Fire risk 1/10 · Minimal
- Est. fire insurance / yr
- $604 – $1,122
Heat risk 1/10 · Minimal
- Hot days now (above 77°F)
- 8 days/yr
- Hot days in 30 yrs
- 17 days/yr
Wind risk 1/10 · Minimal
- Chance of severe wind over 30 yrs
- —
Air-quality risk 6/10 · Moderate
- Unhealthy air days now
- 7 days/yr
- Unhealthy air days in 30 yrs
- 7 days/yr
Risk factors via First Street. Map © Google.
Why this score? — see what drove the C+ grade
The composite is a weighted blend of 9 inputs, each scored 0–100. Each bar is that input's sub-score; the figure is the points it added to the 100-point composite (weight × sub-score).
- Cash flow +21.9/30.0
- ARV discount +15.0/15.0
- DSCR +7.0/10.0
- 1% rule +5.3/10.0
- Livability +4.0/5.0
- Rent growth +3.6/5.0
- Schools +3.6/10.0
- Condition / age +2.5/5.0
- Appreciation +0.0/10.0
$199,000
🖨 Deal sheet 📄 Offer letter ✓ Due diligence
Listing remarks
Large Aberdeen home on a corner lot in a fantastic location! Walking inside from the covered porch you will find a very functional layout showcasing all of the original built ins throughout the home. The main level includes a large kitchen with eating space, separate dining room, cozy living room featuring a wood stove and an arched entry, primary bedroom and a three-quarter bath. Upstairs includes two large bedrooms and a half bath for your convenience. The small driveway off the street leads to the garage and basement area for covered parking and tons of storage space. Property is located out of the flood zone. Home needs TLC, bring your tool belt!
Key facts
- Cozy living room
- Wood stove
- Separate dining room
Tags
Property features AI
Finance
- Financial info: Financing available: Cash, Conventional, FHA, VA
Exterior
- Parking: Attached garage; Driveway; Covered parking for 1 vehicle
- Utilities: Public water (City of Aberdeen); Sewer connected (City of Aberdeen); Power by Grays Harbor PUD; Electric water heater located in basement
- Home design: Single-family residence; Two levels with basement; Main-level entry; Built on lot; Facing information not provided
- Construction: Wood construction; Composition roof; Poured concrete foundation; House built with basement
- Exterior features: Wood exterior; Patio; Cable TV available; Corner lot with sidewalk; Level topography
Interior
- Bedrooms: 3 bedrooms (2 upstairs, 1 on main level)
- Flooring: Ceramic tile; Laminate; Carpet
- Bathrooms: One three-quarter bathroom; One half bathroom
- Heating & cooling: Baseboard heating; No central cooling; Wood and electric energy sources
- Interior features: Dining room; Fireplace; Walk-in closet(s); Water heater
Neighborhood map
What this means for you Summary
Snapshot
- This is a 3-bed/2.0-bath single-family listed at $199k.
Deal economics
- At list price, monthly cash flow is $259 ($3k/yr) — positive.
- The deal already cash-flows at list — no discount required.
- Meets the 1% rule at list price ($2k rent vs $199k).
- Cap rate 8.2% vs local median 4.1% in Aberdeen — top-decile yield for the area; either an underpriced asset or a hidden risk that comps aren't pricing in. Stress-test before assuming the spread holds.
Location & tenants
- Location reads 81/100 on livability (#73 in WA, #1,320 nationally) — a professional / high-income tenant draw. Strengths: amenities A+, commute A+, cost of living A+; Watch: crime D-, employment F.
- Aberdeen School District (town): math 35% / reading 45% proficiency, ranked #222 of 291 in WA (top 76%) — families likely to look elsewhere, expect single-tenant / working-renter base with shorter leases; 61% free/reduced lunch — lower-income household profile, screen leases tightly.
- Zoned schools: Mcdermoth Elementary (287 students, 71% FRL); J M Weatherwax High School (916 students, 63% FRL).
- Market conditions: Rents rising fast (+4.3%/yr); 257 active listings in the ZIP; 3 comparable units currently listed for rent nearby; rentals lingering (median 44d on market — plan ~5-8 weeks vacancy on turnover, expect pricing pressure); 100% of comp listings sitting > 30 days — soft ceiling on asking rent; 297 units permitted in Grays Harbor County in 2024 (17 in 5+ unit buildings).
- This rent runs 42% of the median local income ($58k/yr) — at the standard rent-burdened threshold; future hikes will face affordability resistance.
Forward outlook
- Local home prices are declining (-3.0%/yr); year-one equity from $1k of loan paydown is wiped out by about $6k of value loss. Plan a longer hold.
- Grays Harbor County population projected at -24% by 2050 — secular population decline; favor cash flow + early exit over multi-decade hold.
Negotiation context
- Only 12 days on market — expect competitive offers; lowballing is unlikely to land.
- 5 sale attempts since 15y ago; this cycle's ask has dropped $31k (13%) from the opening price — seller is motivated, your offer sets the floor, not the list.
- Current owner paid $155k; 28% above their basis — modest negotiation headroom, anchor on the comps not their cost.
Risks & watch-outs
- Watch-outs: flood insurance adds $56/mo; built in 1941 — expect roof / HVAC / electrical / plumbing capex.
- Climate carrying-cost: severe flood risk — expect insurance premiums to compound above CPI over the hold.
Questions for the listing agent
- Built in 1941 — when were the roof, HVAC, electrical panel, plumbing, and water heater last replaced?
- What's the actual annual flood-insurance premium (NFIP or private), and is the property in a SFHA with mandatory coverage?
- Is there a deadline driving the sale (1031 exchange, divorce, estate, relocation)? That informs how much negotiation room exists.
- Schools are D-rated, which usually means shorter tenancies and higher turnover. Who's the typical renter profile here, and what's been the actual vacancy rate?
- Crime grade is D in this area — have there been break-ins, vandalism, or insurance claims at this property in the last 3 years? What carrier currently insures it and at what premium?
- What's the average days-on-market for RENTAL listings here right now (not sales)? A rising rental-DOM trend means longer vacancies and softer asking-rent achievability than the comps imply.
- What's the recent tenant-quality profile in this submarket — average credit score on applications, eviction rate, late-payment / NSF rate, and stable-employment percentage? A property-management company in the area should have these aggregated.
- How much new for-sale + rental construction is in the pipeline within 1–3 miles? Heavy new supply typically softens prices + rents 12–24 months out; constrained supply supports both.
Investment metrics
- 1% rule
- 1.03% ✓
- Cap rate
- 8.19%
- Cash-on-cash
- 6.77%
- DSCR
- 1.30
- GRM
- 8.1
CMA / ARV
- ARV (on-the-fly)
- $287,766
- Comps found
- 12
Show comp detail 12 sales within ~0.75 mi
| Address | Dist | Beds/Ba | Sqft | Sold | Price | $/sf | Match |
|---|---|---|---|---|---|---|---|
| 602 W 2nd St | 0.11mi | 3/1.0 | 1,882 (-4%) | 3mo | $250,000 | $133 | 81 |
| 709 W 2nd St | 0.21mi | 4/1.0 (+1) | 1,992 (+1%) | 8mo | $245,000 | $123 | 73 |
| 904 W 2nd St | 0.31mi | 2/2.0 (-1) | 2,050 (+4%) | 2mo | $300,000 | $146 | 72 |
| 424 Mckinley Ave | 0.63mi | 3/2.0 | 1,984 (+1%) | 5mo | $410,000 | $207 | 66 |
| 526 W 6th St | 0.35mi | 2/1.0 (-1) | 1,940 (-2%) | 8mo | $329,000 | $170 | 65 |
| 1519 Pacific Ave | 0.44mi | 3/1.5 | 1,816 (-8%) | 1mo | $262,500 | $145 | 64 |
| 1700 W 6th St | 0.56mi | 4/1.5 (+1) | 1,948 (-1%) | 4mo | $240,000 | $123 | 62 |
| 620 N Michigan St | 0.19mi | 4/2.0 (+1) | 2,200 (+12%) | 8mo | $340,000 | $155 | 60 |
| 1314 W Market St | 0.51mi | 3/3.0 | 1,828 (-7%) | 4mo | $325,000 | $178 | 57 |
| 1520 W Market St | 0.61mi | 3/1.0 | 1,863 (-6%) | 4mo | $187,500 | $101 | 56 |
| 918 Arnold St | 0.60mi | 3/1.0 | 1,838 (-7%) | 8mo | $298,000 | $162 | 50 |
| 2002 Pacific Ave | 0.69mi | 3/2.0 | 1,710 (-13%) | 1mo | $175,500 | $103 | 45 |
Match score weights: distance 35% · size 25% · config 20% · recency 20%. Top-matched comps best support the ARV.
Projected returns pro-forma
-3.0% appreciation · 4.35% rent growth · sell at horizon
- IRR
- -6.2%
- Equity multiple
- 0.77×
- Total profit
- $-12,930
- Equity at exit
- $29,672
- IRR
- 5.0%
- Equity multiple
- 1.39×
- Total profit
- $21,954
- Equity at exit
- $17,206
Cash invested: $55,720 (down + closing). Projections, not guarantees.
Landlord ↔ Tenant lean methodology
- Overall (STATE)
- 28 Tenant-Leaning
- State Washington
- 28 Tenant-Leaning · D+8
- County
- — inherits STATE
- City
- — inherits STATE
ZIP-level market 98520
- Rents YoY
- 4.3%
- Active inventory
- 257
- Price-to-rent
- 8.1×
Monthly cashflow live
- Estimated rent
- $2,052 medium interval (Pro) →
- Mortgage (P&I)
- −$1,044
- Tax from tax record
- −$180 /mo · $2,163/yr
- Insurance
- −$83
- Flood insurance flood zone
- −$56 /mo · $666/yr
- HOA
- −$0
- Vacancy / Maint / Mgmt
- −$431
- Net cashflow
- $259
Break-even live
UW: 25.0% down · 7.5% · 30yr · 1.5% tax · 5.0% vac · 8.0% maint · 8.0% mgmt
Financing live
Cash to close
- Down payment
- $49,750
- Closing costs
- $5,970
- Reserves months
- —
- Total cash needed
- —
Loan-product check · same deal, 3 products live
Conventional
25% down · 7.5% · 30yr
- Down + closing
- —
- Monthly P&I
- —
- Monthly cashflow
- —
- DSCR
- —
- Eligible?
- —
Personal DTI + credit; lowest rate.
DSCR
20% down · 8.5% · 30yr
- Down + closing
- —
- Monthly P&I
- —
- Monthly cashflow
- —
- DSCR
- —
- Eligible?
- —
No personal income docs; deal must DSCR.
Hard money
10% down · 12.0% · 12mo
- Down + closing
- —
- Monthly P&I
- —
- Monthly cashflow
- —
- DSCR
- —
- Eligible?
- —
Short-term bridge; refi at stabilization.
Rent comps 3 comps
| Address | Beds | Baths | Sqft | Rent | $/sqft | DOM | Units | Dist |
|---|---|---|---|---|---|---|---|---|
| 1619 W 6th St Aberdeen, WA | 4.0 | 2.0 | 1750 | $2,295 | $1.31 | 43d | 1 | 0.54mi |
| 908 E 1st St Aberdeen, WA | 3.0 | 1.0 | 1608 | $2,100 | $1.31 | 43d | 1 | 0.85mi |
| 801 Olympic Sq Aberdeen, MD | 2.0–3.0 | 2.0 | 1344 | $2,267 | $1.69 | 43d | 3 | 1.49mi |
Listing history 35 events
-
2026-06-18status $199,000 Pending 12 DOM
-
2026-06-17days on market $199,000 Active 12 DOM
-
2026-06-16days on market $199,000 Active 11 DOM
-
2026-06-15days on market $199,000 Active 10 DOM
-
2026-06-14days on market $199,000 Active 8 DOM
-
2026-06-12days on market $199,000 Active 7 DOM
-
2026-06-09days on market $199,000 Active 4 DOM
-
2026-06-08days on market $199,000 Active 3 DOM
-
2026-06-07pricedays on market $199,000 Active 2 DOM
-
2026-06-03days on market $230,000 Active 14 DOM
-
2026-06-02days on market $230,000 Active 13 DOM
-
2026-06-01days on market $230,000 Active 12 DOM
-
2026-05-31days on market $230,000 Active 11 DOM
-
2026-05-30days on market $230,000 Active 10 DOM
-
2026-05-20$230,000 Active
-
2018-07-27soldstatus $155,000 Sold
-
2018-07-27soldstatus $155,000
-
2018-06-16status Pending
-
2018-06-14$150,000 Active
-
2013-12-11soldstatus $124,000 Sold
-
2013-12-11soldstatus $124,000
-
2013-11-08status Pending
-
2013-11-01status Pending Inspection
-
2013-10-18price $130,000
-
2013-09-05price $134,900
-
2013-04-19$139,900 Active
-
2011-12-13historical
-
2011-12-12soldstatus $150,000 Sold
-
2011-12-12soldstatus $150,000
-
2011-11-16status Pending Inspection
-
2011-11-14status Active
-
2011-11-14historical Expired
-
2011-08-12$152,000 Active
-
2007-11-02soldstatus $160,000
-
2007-05-24soldstatus $75,000
ⓘ Source: listings_history table (triggers on properties + properties_extension) + one-shot
backfill from property_details.listing_events for pre-trigger history.
Tax reassessment forecast WA · Resets to sale price
- Current annual tax
- $2,163 · $180/mo
- Projected year-2 tax
- $2,163 · $180/mo
- Expected delta
- $0/yr ($0/mo · 0.0%)
ⓘ Screening estimate from a state-policy table — verify with the county assessor before closing.
Climate risk First Street
- Flood 8/10 Severe FEMA zone X (unshaded) · 99% chance over 30 yrs
- Wildfire 1/10 Low
- Heat 1/10 Low 8 d/yr ≥77°F today · 17 d/yr by 30 yrs out
- Wind 1/10 Low
- Air quality 6/10 Major 7 unhealthy d/yr today · 7 by 30 yrs out
Nearby sold comps map
Loading sold comps map…
Walkable amenities ~0.75 mi
Loading nearby amenities…
Taxation est. · year 1
- Rental income
- $24,621
- − Mortgage interest
- −$11,147
- − Property taxes
- −$2,163
- − Insurance
- −$1,662
- − Repairs & maintenance
- −$1,970
- − Management
- −$1,970
- − Depreciation
- −$5,789
- Taxable loss
- −$79
- Est. tax savings @ 24.0%
- +$19
- After-tax cash flow
- $3,122/yr
For passive investors: Depreciation is non-cash, so a rental often shows a tax loss while cash-flowing — sheltering income. Rental losses are passive: they offset passive income freely, and up to $25,000/yr can offset ordinary (W-2) income if you actively participate and your MAGI is under $100k (phasing out to $0 by $150k); unused losses carry forward. On sale, claimed depreciation is recaptured at up to 25%, and gains may owe capital-gains tax (a 1031 exchange can defer both). Figures are a year-1 estimate at your 24.0% rate — not tax advice; consult a CPA.
Schools (NCES district)
- District
- Aberdeen School District
- NCES district ID
- 5300030
- Math proficiency
- 35% ▼ -1.00%
- Reading proficiency
- 45% ▬ 0.00%
- Median HH income
- $41,896
- Composite
- 36.13/100
- National rank
- #9477
- State rank
- #222 of 291 in WA
Livability — Aberdeen
- Score
- 81/100
- State rank
- #73
- US rank
- #1320
Category grades
Schools grade is shown separately in the Schools card above.
Census & demographics
- Census place
- Aberdeen, WA
- County
- Grays Harbor County · 44,693 people
- City population
- 24,888
- Metro
- Aberdeen, WA
- Population (ZIP)
- 24,888
- Household income
- $58,153
- Rent vs Own
- Severe rent burden
- 635.0
Population outlook (Grays Harbor County) Hauer SSP2
- Today (2025)
- 66,443 people
- By 2030
- 63,255 · -4.8%
- By 2040
- 56,466 · -15.0%
- By 2050
- 50,516 · -24.0%
- By 2075
- 39,296 · -40.9%
- By 2100
- 31,142 · -53.1%
Race, ethnicity, and origin ACS 2023
- Neighborhood character
- Predominantly White (70%)
- Race & ethnicity
- White 70% Hispanic / Latino 16% Two or more races 9% Black 4% Native American 3% Asian 1% Pacific Islander 1%
- Hispanic origin (detail)
- Mexican 11%
- Common ancestry
- Portuguese 4% Italian 3% Lithuanian 2%
- Foreign-born
- 7% · Canada
- Languages at home
- 87% English-only · Spanish 10% Other Asian/Pacific 1% German/W. Germanic 1%
Political lean MEDSL · Grays Harbor
- 2024 margin
- Lean R (+6.0) · D 45.6% · R 51.6% · Other 2.8%
- 2008→2024 swing
- -20.6pp toward R · 2008: 14.6pp · 2024: -6.0pp
- All cycles
- 2024: R+6.0 2020: R+6.6 2016: R+7.1 2012: D+14.0 2008: D+14.6
Not yet ingested
- Civics
- —
Market trends
- HPI YoY
- ▼ -138.75%
- Current HPI
- 207.7393
- Rent YoY
- ▲ 4.35%
- Metro
- Aberdeen, WA
- State GDP YoY
- ▲ 4.65%
- F500 in state
- 22
Industry mix (Fortune 500 HQ in WA)
| Industry | F500 HQs | Revenue |
|---|---|---|
| Retail | 2 | $269B |
|
||
| Technology / Retail | 1 | $638B |
|
||
| Technology | 1 | $245B |
|
||
| Telecommunications | 1 | $38B |
|
||
| Food / Beverage | 1 | $36B |
|
||
| Automotive / Trucks | 1 | $34B |
|
||
Price history
+206.7% since first listed21 events — show timeline
- 2026-05-20 Listed $230,000 NWMLS as Distributed by MLS Grid
- 2018-07-27 Sold (Public Records) $155,000 Public Records
- 2018-07-27 Sold (MLS) $155,000 NWMLS as Distributed by MLS Grid
- 2018-06-16 Pending — NWMLS as Distributed by MLS Grid
- 2018-06-14 Listed $150,000 NWMLS as Distributed by MLS Grid
- 2013-12-11 Sold (Public Records) $124,000 Public Records
- 2013-12-11 Sold (MLS) $124,000 NWMLS as Distributed by MLS Grid
- 2013-11-08 Pending — NWMLS as Distributed by MLS Grid
- 2013-11-01 Pending — NWMLS as Distributed by MLS Grid
- 2013-10-18 Price Changed $130,000 NWMLS as Distributed by MLS Grid
- 2013-09-05 Price Changed $134,900 NWMLS as Distributed by MLS Grid
- 2013-04-19 Listed $139,900 NWMLS as Distributed by MLS Grid
- 2011-12-13 Delisted — NWMLS as Distributed by MLS Grid
- 2011-12-12 Sold (Public Records) $150,000 Public Records
- 2011-12-12 Sold (MLS) $150,000 NWMLS as Distributed by MLS Grid
- 2011-11-16 Pending — NWMLS as Distributed by MLS Grid
- 2011-11-14 Relisted — NWMLS as Distributed by MLS Grid
- 2011-11-14 Delisted — NWMLS as Distributed by MLS Grid
- 2011-08-12 Listed $152,000 NWMLS as Distributed by MLS Grid
- 2007-11-02 Sold (Public Records) $160,000 Public Records
- 2007-05-24 Sold (Public Records) $75,000 Public Records
Property tax history
+3.5%/yrLatest (2026): $2,163 · -6.4% YoY. Source: county tax records.
Cash-flow waterfall
monthlySold comps — $/sqft
last 12 mo · ≤1 miLoading sold comps…