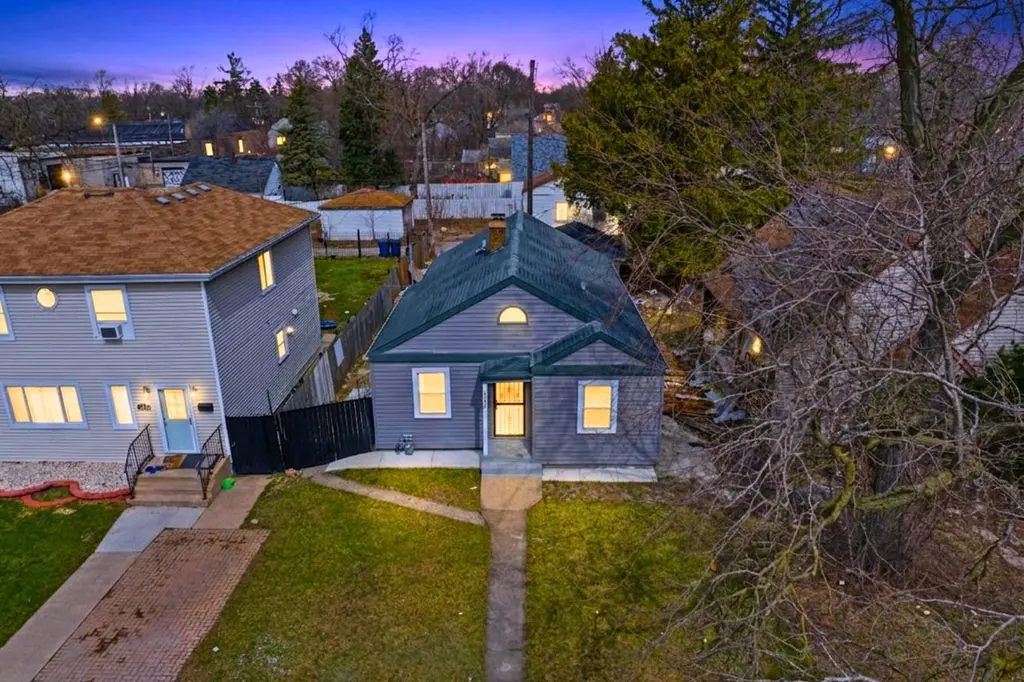
107 E 149th St · Harvey, IL
Flood risk 3/10 · Minor
- FEMA flood zone
- X (unshaded)
- Chance of flooding over 30 yrs
- 0.2%
- Est. flood insurance / yr
- $473 – $860
Fire risk 1/10 · Minimal
- Est. fire insurance / yr
- $804 – $1,492
Heat risk 3/10 · Minor
- Hot days now (above 102°F)
- 7 days/yr
- Hot days in 30 yrs
- 15 days/yr
Wind risk 2/10 · Minimal
- Chance of severe wind over 30 yrs
- —
Air-quality risk 4/10 · Minor
- Unhealthy air days now
- 4 days/yr
- Unhealthy air days in 30 yrs
- 5 days/yr
Risk factors via First Street. Map © Google.
Why this score? — see what drove the C+ grade
The composite is a weighted blend of 9 inputs, each scored 0–100. Each bar is that input's sub-score; the figure is the points it added to the 100-point composite (weight × sub-score).
- Cash flow +26.2/30.0
- Appreciation +10.0/10.0
- DSCR +8.9/10.0
- 1% rule +6.5/10.0
- Livability +3.4/5.0
- Rent growth +2.5/5.0
- Condition / age +2.5/5.0
- Schools +0.7/10.0
- ARV discount +0.0/15.0
$139,000
🖨 Deal sheet (PDF) 📄 Offer letter ✓ Due diligence
Listing remarks
Welcome home to this well-maintained 3-bedroom, 1-bath ranch offering comfortable single-level living with room to grow. Featuring an easy-to-maintain exterior and a new roof, this home combines practical updates with everyday functionality. Step inside to discover a freshly updated interior showcasing new paint, new baseboards, new wood laminate flooring throughout, recessed lighting, and numerous mechanical improvements including new electrical, updated plumbing, new smoke detectors, and a new sump pump for added peace of mind. The bright kitchen features white cabinetry, quartz countertops, and stainless-steel appliances, seamlessly connecting to a separate dining area ideal for everyday
Key facts
- Stainless appliances
- Partial basement
- Rehabbed home
Tags
Property features AI
Finance
- Other: Parcel number recorded
- HOA & community: No master association fee (not required)
Exterior
- Parking: Detached garage (2 garage spaces, 2 total parking spaces)
- Utilities: Public water; Public sewer
- Home design: Detached single-family home; One-story; Fee simple ownership; Rehab completed/recorded for 2026; Built approximately 81–90 years ago; Property located in Harvey (Thornton Township)
- Construction: Aluminum siding; Block and concrete perimeter foundation
- Exterior features: Patio; Level lot; School bus service available; Sidewalks; Paved streets
Interior
- Kitchen: Galley-style kitchen with solid surface counters; Updated kitchen; Range; Microwave; Refrigerator; Stainless steel appliances
- Bedrooms: 3 bedrooms (all on the main level); Master bedroom on the main level
- Flooring: Laminate flooring throughout main living areas and bedrooms
- Bathrooms: 1 full bathroom
- Heating & cooling: Natural gas heating
- Interior features: First-floor bedroom; First-floor full bathroom; Separate dining room; 6 total rooms; Unfinished partial basement; Some photos virtually staged
- Laundry & utility: Laundry room in basement with utility sink
Neighborhood map
What this means for you Summary
Snapshot
- This is a 3-bed/1.0-bath single-family listed at $139k.
Deal economics
- At list price, monthly cash flow is $355 ($4k/yr) — positive.
- The deal already cash-flows at list — no discount required.
- Meets the 1% rule at list price ($2k rent vs $139k).
- Recommended offer: $137k (1.5% below list) — sets the bar for market timing.
Location & tenants
- Location reads 67/100 on livability (#539 in IL) — a middle-class / working-renter tenant base. Strengths: commute A+, cost of living A+, housing A-; Watch: health & safety D+, crime F, amenities F.
- Thornton Twp Hsd 205 (suburban): math 7% / reading 8% proficiency, ranked #594 of 620 in IL (top 96%) — low school quality limits family demand, transient renter base, plan for 1-2y turnover.
- Zoned schools: Thornton Township High School (math 7% / reading 7%, grade F, #605 of 693 statewide, top 87%, 1,628 students, 0% FRL).
- Market conditions: 133 active listings in the ZIP; 2 comparable units currently listed for rent nearby; 6,272 units permitted in Cook County in 2024 (4,658 in 5+ unit buildings).
Forward outlook
- In year one you build about $15k of equity ($961 loan paydown + $14k appreciation (10.0% local appreciation)).
- At projected returns (10.0% appreciation + 3.0% rent growth), your $39k cash investment doubles in ~2 years — after that, you're playing with house money.
- By year 3, paydown + projected appreciation supports a ~$38k cash-out refi (75% LTV) — recoverable capital for the next deal without selling this one.
Negotiation context
- It's been on market 16 days — a 2% lower offer ($137k) is reasonable based on typical stale-listing flexibility.
- 5 sale attempts since 2y ago; this cycle's ask has dropped $25k (15%) from the opening price — seller is motivated, your offer sets the floor, not the list.
- Current owner paid $39k; list at $139k implies a 257% gain — meaningful room to come down on a strong offer.
Risks & watch-outs
- Watch-outs: built in 1941 — expect roof / HVAC / electrical / plumbing capex.
Questions for the listing agent
- Built in 1941 — when were the roof, HVAC, electrical panel, plumbing, and water heater last replaced?
- Is there a deadline driving the sale (1031 exchange, divorce, estate, relocation)? That informs how much negotiation room exists.
- Schools are F-rated, which usually means shorter tenancies and higher turnover. Who's the typical renter profile here, and what's been the actual vacancy rate?
- Crime grade is F in this area — have there been break-ins, vandalism, or insurance claims at this property in the last 3 years? What carrier currently insures it and at what premium?
- What's the average days-on-market for RENTAL listings here right now (not sales)? A rising rental-DOM trend means longer vacancies and softer asking-rent achievability than the comps imply.
- What's the recent tenant-quality profile in this submarket — average credit score on applications, eviction rate, late-payment / NSF rate, and stable-employment percentage? A property-management company in the area should have these aggregated.
- How much new for-sale + rental construction is in the pipeline within 1–3 miles? Heavy new supply typically softens prices + rents 12–24 months out; constrained supply supports both.
Investment metrics
- 1% rule
- 1.15% ✓
- Cap rate
- 9.36%
- Cash-on-cash
- 10.94%
- DSCR
- 1.49
- GRM
- 7.2
CMA / ARV
- ARV (on-the-fly)
- $109,901
- Comps found
- 12
Show comp detail 12 sales within ~0.75 mi
| Address | Dist | Beds/Ba | Sqft | Sold | Price | $/sf | Match |
|---|---|---|---|---|---|---|---|
| 70 E 150th St | 0.19mi | 3/1.0 | 1,066 (-6%) | 3mo | $61,500 | $58 | 78 |
| 15032 Marshfield Ave | 0.45mi | 3/1.0 | 1,081 (-5%) | 4mo | $75,000 | $69 | 68 |
| 240 E 148th St | 0.42mi | 3/1.5 | 1,080 (-5%) | 4mo | $190,000 | $176 | 68 |
| 14542 Sangamon St | 0.45mi | 3/1.0 | 1,088 (-4%) | 7mo | $100,000 | $92 | 66 |
| 14523 Lexington Ave | 0.42mi | 4/2.0 (+1) | 1,130 (-0%) | 6mo | $200,000 | $177 | 66 |
| 14624 Peoria St | 0.42mi | 4/1.0 (+1) | 1,152 (+2%) | 10mo | $107,500 | $93 | 64 |
| 14902 Paulina St | 0.47mi | 2/1.0 (-1) | 1,200 (+6%) | 1mo | $90,000 | $75 | 62 |
| 14622 Vincennes Rd | 0.38mi | 3/1.0 | 1,235 (+9%) | 7mo | $120,000 | $97 | 61 |
| 14523 S Justine St | 0.49mi | 2/1.0 (-1) | 1,200 (+6%) | 8mo | $60,000 | $50 | 55 |
| 14609 Justine St | 0.41mi | 3/2.0 | 1,000 (-12%) | 6mo | $237,500 | $238 | 53 |
| 238 Calumet Blvd | 0.70mi | 3/1.5 | 1,190 (+5%) | 9mo | $115,000 | $97 | 50 |
| 110 W 150th St | 0.68mi | 3/1.0 | 1,008 (-11%) | 0mo | $101,250 | $100 | 50 |
Match score weights: distance 35% · size 25% · config 20% · recency 20%. Top-matched comps best support the ARV.
Projected returns pro-forma
10.0% appreciation · 3.0% rent growth · sell at horizon
- IRR
- 32.3%
- Equity multiple
- 3.53×
- Total profit
- $98,294
- Equity at exit
- $125,222
- IRR
- 27.9%
- Equity multiple
- 7.98×
- Total profit
- $271,678
- Equity at exit
- $270,046
Cash invested: $38,920 (down + closing). Projections, not guarantees.
Landlord ↔ Tenant lean methodology
- Overall (STATE)
- 43 Moderately Tenant-Leaning
- State Illinois
- 43 Moderately Tenant-Leaning · D+7
- County
- — inherits STATE
- City
- — inherits STATE
ZIP-level market 60426
- Home prices YoY
- 6.9%
- Active inventory
- 133
- Price-to-rent
- 7.2×
Monthly cashflow live
- Estimated rent
- $1,603 medium interval (Pro) →
- Mortgage (P&I)
- −$729
- Tax from tax record
- −$124 /mo · $1,493/yr
- Insurance
- −$58
- HOA
- −$0
- Vacancy / Maint / Mgmt
- −$337
- Net cashflow
- $355
Break-even live
Sensitivity live
| Price | -10% $433 | -5% $394 | +0% $355 | +5% $315 | +10% $276 |
|---|---|---|---|---|---|
| Rent | -10% $228 | -5% $291 | +0% $355 | +5% $418 | +10% $481 |
| Rate | -1.0pp $425 | -0.5pp $390 | base $355 | +0.5pp $319 | +1.0pp $282 |
UW: 25.0% down · 7.5% · 30yr · 1.5% tax · 5.0% vac · 8.0% maint · 8.0% mgmt
Financing live
Cash to close
- Down payment
- $34,750
- Closing costs
- $4,170
- Reserves months
- —
- Total cash needed
- —
Loan-product check · same deal, 3 products live
Conventional
25% down · 7.5% · 30yr
- Down + closing
- —
- Monthly P&I
- —
- Monthly cashflow
- —
- DSCR
- —
- Eligible?
- —
Personal DTI + credit; lowest rate.
DSCR
20% down · 8.5% · 30yr
- Down + closing
- —
- Monthly P&I
- —
- Monthly cashflow
- —
- DSCR
- —
- Eligible?
- —
No personal income docs; deal must DSCR.
Hard money
10% down · 12.0% · 12mo
- Down + closing
- —
- Monthly P&I
- —
- Monthly cashflow
- —
- DSCR
- —
- Eligible?
- —
Short-term bridge; refi at stabilization.
Rent comps 2 comps
| Address | Beds | Baths | Sqft | Rent | $/sqft | DOM | Units | Dist |
|---|---|---|---|---|---|---|---|---|
| 14629 Hoyne Ave Dixmoor, IL | 3.0 | 1.0 | 920 | $1,495 | $1.62 | 26d | 1 | 0.97mi |
| 14802 Cooper Ave Harvey, IL | 3.0 | 1.5 | 1200 | $1,700 | $1.42 | 26d | 1 | 1.02mi |
Listing history 25 events
-
2026-06-21days on market $139,000 Active 16 DOM
-
2026-06-18days on market $139,000 Active 13 DOM
-
2026-06-17days on market $139,000 Active 12 DOM
-
2026-06-16days on market $139,000 Active 11 DOM
-
2026-06-15days on market $139,000 Active 10 DOM
-
2026-06-13days on market $139,000 Active 8 DOM
-
2026-06-13days on market $139,000 Active 7 DOM
-
2026-06-09days on market $139,000 Active 4 DOM
-
2026-06-08days on market $139,000 Active 3 DOM
-
2026-06-07pricedays on market $139,000 Active 2 DOM
-
2026-06-02days on market $159,950 Active 43 DOM
-
2026-06-01days on market $159,950 Active 42 DOM
-
2026-05-31days on market $159,950 Active 41 DOM
-
2026-04-30price $159,950
-
2026-04-20$163,900 Active
-
2026-04-20historical
-
2026-03-31Active
-
2025-02-28historical
-
2025-01-08status Active
-
2025-01-02historical
-
2025-01-02status Temporarily No Showings
-
2024-11-24historical Contingent - Continue to Show
-
2024-11-13price
-
2024-11-12Active
-
1985-10-01soldstatus $38,900
ⓘ Source: listings_history table (triggers on properties + properties_extension) + one-shot
backfill from property_details.listing_events for pre-trigger history.
Tax reassessment forecast IL · Partial reset (capped growth)
- Current annual tax
- $1,493 · $124/mo
- Projected year-2 tax
- $2,324 · $194/mo
- Expected delta
- +$831/yr (+$69/mo · 55.7%)
ⓘ Screening estimate from a state-policy table — verify with the county assessor before closing.
Climate risk First Street
- Flood 3/10 Moderate FEMA zone X (unshaded) · 20% chance over 30 yrs
- Wildfire 1/10 Low
- Heat 3/10 Moderate 7 d/yr ≥102°F today · 15 d/yr by 30 yrs out
- Wind 2/10 Low
- Air quality 4/10 Moderate 4 unhealthy d/yr today · 5 by 30 yrs out
Nearby sold comps map
Loading sold comps map…
Walkable amenities ~0.75 mi
Loading nearby amenities…
Taxation est. · year 1
- Rental income
- $19,231
- − Mortgage interest
- −$7,786
- − Property taxes
- −$1,493
- − Insurance
- −$695
- − Repairs & maintenance
- −$1,538
- − Management
- −$1,538
- − Depreciation
- −$4,044
- Taxable income
- $2,137
- Est. tax owed @ 24.0%
- −$513
- After-tax cash flow
- $3,745/yr
For passive investors: Depreciation is non-cash, so a rental often shows a tax loss while cash-flowing — sheltering income. Rental losses are passive: they offset passive income freely, and up to $25,000/yr can offset ordinary (W-2) income if you actively participate and your MAGI is under $100k (phasing out to $0 by $150k); unused losses carry forward. On sale, claimed depreciation is recaptured at up to 25%, and gains may owe capital-gains tax (a 1031 exchange can defer both). Figures are a year-1 estimate at your 24.0% rate — not tax advice; consult a CPA.
Schools (NCES district)
- District
- Thornton Twp Hsd 205
- NCES district ID
- 1738970
- Math proficiency
- 7% ▬ 0.00%
- Reading proficiency
- 8% ▼ -2.00%
- Median HH income
- $43,392
- Composite
- 6.92/100
- National rank
- #9976
- State rank
- #594 of 620 in IL
Livability — Harvey
- Score
- 67/100
- State rank
- #539
- US rank
- #11162
Category grades
Schools grade is shown separately in the Schools card above.
Census & demographics
- Census place
- Harvey, IL
- City population
- 23,066
- Population (ZIP)
- 23,066
Population outlook (Cook County) Hauer SSP2
- Today (2025)
- 5,347,519 people
- By 2030
- 5,357,703 · +0.2%
- By 2040
- 5,324,924 · -0.4%
- By 2050
- 5,230,762 · -2.2%
- By 2075
- 4,785,735 · -10.5%
- By 2100
- 4,188,836 · -21.7%
Race, ethnicity, and origin ACS 2023
- Neighborhood character
- Majority Black (59%)
- Race & ethnicity
- Black 59% Hispanic / Latino 33% Two or more races 12% White 3% Asian 2%
- Hispanic origin (detail)
- Mexican 31%
- Foreign-born
- 17% · Canada
- Languages at home
- 67% English-only · Spanish 30% Other Indo-European 2% French/Haitian/Cajun 1%
Political lean MEDSL · Cook
- 2024 margin
- Solid D (+42.0) · D 70.4% · R 28.4% · Other 1.2%
- 2008→2024 swing
- -11.4pp toward R · 2008: 53.4pp · 2024: 42.0pp
- All cycles
- 2024: D+42.0 2020: D+50.3 2016: D+53.0 2012: D+49.4 2008: D+53.4
Not yet ingested
- Civics
- —
Market trends
- HPI YoY
- ▲ 20.36%
- Current HPI
- 313.7895
- Rent YoY
- —
- Metro
- —
- State GDP YoY
- ▲ 1.59%
- F500 in state
- 60
Industry mix (Fortune 500 HQ in IL)
| Industry | F500 HQs | Revenue |
|---|---|---|
| Insurance | 4 | $201B |
|
||
| Consumer Goods | 4 | $87B |
|
||
| Industrial Machinery | 3 | $64B |
|
||
| Healthcare | 2 | $55B |
|
||
| Retail / Pharmacy | 1 | $148B |
|
||
| Agriculture / Food | 1 | $86B |
|
||
Price history
+311.2% since first listed12 events — show timeline
- 2026-04-30 Price Changed $159,950 MRED as Distributed by MLS Grid
- 2026-04-20 Listing Removed — MRED as Distributed by MLS Grid
- 2026-04-20 Listed $163,900 MRED as Distributed by MLS Grid
- 2026-03-31 Listed — MRED as Distributed by MLS Grid
- 2025-02-28 Listing Removed — MRED as Distributed by MLS Grid
- 2025-01-08 Relisted — MRED as Distributed by MLS Grid
- 2025-01-02 Listing Removed — MRED as Distributed by MLS Grid
- 2025-01-02 Relisted — MRED as Distributed by MLS Grid
- 2024-11-24 Contingent — MRED as Distributed by MLS Grid
- 2024-11-13 Price Changed — MRED as Distributed by MLS Grid
- 2024-11-12 Listed — MRED as Distributed by MLS Grid
- 1985-10-01 Sold (Public Records) $38,900 Public Records
Property tax history
-0.5%/yrLatest (2023): $1,493 · +168.5% YoY. Source: county tax records.
Cash-flow waterfall
monthlySold comps — $/sqft
last 12 mo · ≤1 miLoading sold comps…