6539 Townsend Rd, #156 Plan · Jacksonville, FL
Flood risk 1/10 · Minimal
- FEMA flood zone
- X (unshaded)
- Chance of flooding over 30 yrs
- 0.0%
- Est. flood insurance / yr
- $507 – $1,088
Fire risk 3/10 · Minor
- Est. fire insurance / yr
- $947 – $1,759
Heat risk 8/10 · Major
- Hot days now (above 107°F)
- 7 days/yr
- Hot days in 30 yrs
- 20 days/yr
Wind risk 10/10 · Severe
- Chance of severe wind over 30 yrs
- 99.0%
Air-quality risk 3/10 · Minor
- Unhealthy air days now
- 3 days/yr
- Unhealthy air days in 30 yrs
- 4 days/yr
Risk factors via First Street. Map © Google.
Why this score? — see what drove the B grade
The composite is a weighted blend of 9 inputs, each scored 0–100. Each bar is that input's sub-score; the figure is the points it added to the 100-point composite (weight × sub-score).
- Cash flow +30.0/30.0
- 1% rule +10.0/10.0
- DSCR +10.0/10.0
- ARV discount +7.5/15.0
- Livability +4.2/5.0
- Schools +3.9/10.0
- Rent growth +3.1/5.0
- Condition / age +2.5/5.0
- Appreciation +0.0/10.0
$84,900
🖨 Deal sheet 📄 Offer letter ✓ Due diligence
Listing remarks
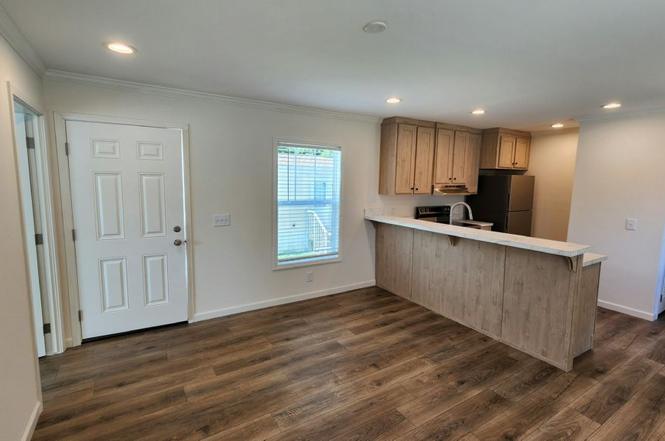
Welcome to this classic home nestled in the heart of a Jacksonville. With an open concept floor plan, 2 bedrooms, 1 bathrooms, and 768 sq. ft. of living space, there is plenty of room for everyone. Be in close proximity of great schools, shopping, and restaurants. This charming home has been meticulously cared for and is ready for you to move in! SETTLE DOWN WITHOUT HAVING TO SETTLE FOR LESS. Come visit today to see why this is where you need to settle down. Be sure to ask about our current promotions.
Key facts
- Listed 195 days
Property features AI
Finance
- Financial info: List price $84,900
Exterior
- Home design: Single-level plan (address listed as 6539 Townsend Rd, #156)
- Exterior features: 768 living area
Interior
- Bedrooms: 2 bedrooms
- Bathrooms: 1 full bathroom
- Interior features: Plan new construction
Neighborhood map
What this means for you Summary
Snapshot
- This is a 2-bed/1.0-bath manufactured listed at $85k.
Deal economics
- At list price, monthly cash flow is $519 ($6k/yr) — positive.
- The deal already cash-flows at list — no discount required.
- Meets the 1% rule at list price ($1k rent vs $85k).
- Recommended offer: $75k (12.0% below list) — sets the bar for market timing.
- Cap rate 13.6% vs local median 4.0% in Jacksonville — top-decile yield for the area; either an underpriced asset or a hidden risk that comps aren't pricing in. Stress-test before assuming the spread holds.
Location & tenants
- Location reads 83/100 on livability (#50 in FL, #911 nationally) — a professional / high-income tenant draw. Strengths: amenities A+, commute A+, housing A+.
- Duval (urban): math 46% / reading 45% proficiency, ranked #48 of 73 in FL (top 66%) — families likely to look elsewhere, expect single-tenant / working-renter base with shorter leases.
- Market conditions: Rents rising (+2.2%/yr); 349 active listings in the ZIP; 35 comparable units currently listed for rent nearby; rentals at typical pace (median 16d on market — plan ~3-4 weeks tenant-placement turnaround); 6,503 units permitted in Duval County in 2024 (1,131 in 5+ unit buildings).
Forward outlook
- Local home prices are declining (-3.0%/yr); year-one equity from $587 of loan paydown is wiped out by about $3k of value loss. Plan a longer hold.
- Duval County population projected at +19% by 2050 — long-run rental-demand tailwind backs the buy-and-hold thesis.
- At projected returns (-3.0% appreciation + 2.2% rent growth), your $24k cash investment doubles in ~5 years — after that, you're playing with house money.
Negotiation context
- It's been on market 196 days — a 12% lower offer ($75k) is reasonable based on typical stale-listing flexibility.
Risks & watch-outs
- Climate carrying-cost: severe wind risk, 99% chance of damaging wind over 30y; extreme-heat days projected 7→20/yr by 2055 (HVAC capex compounding) — expect insurance premiums to compound above CPI over the hold.
Questions for the listing agent
- It's been on market 196 days. Have you received any prior offers? Is the seller open to a 12% concession, seller financing, or rate buy-down credit?
- Why hasn't it sold? Are there any deal-killer items the seller is aware of (foundation, flood, title, zoning, code violations)?
- Is there a deadline driving the sale (1031 exchange, divorce, estate, relocation)? That informs how much negotiation room exists.
- Schools are B-rated — typically a magnet for longer-tenancy family renters. What's the average tenant stay here, and is there a school-zone premium baked into asking?
- What's the average days-on-market for RENTAL listings here right now (not sales)? A rising rental-DOM trend means longer vacancies and softer asking-rent achievability than the comps imply.
- What's the recent tenant-quality profile in this submarket — average credit score on applications, eviction rate, late-payment / NSF rate, and stable-employment percentage? A property-management company in the area should have these aggregated.
- How much new for-sale + rental construction is in the pipeline within 1–3 miles? Heavy new supply typically softens prices + rents 12–24 months out; constrained supply supports both.
Investment metrics
- 1% rule
- 1.65% ✓
- Cap rate
- 13.63%
- Cash-on-cash
- 26.21%
- DSCR
- 2.17
- GRM
- 5.1
CMA / ARV
No comps found within radius.
Projected returns pro-forma
-3.0% appreciation · 2.25% rent growth · sell at horizon
- IRR
- 19.1%
- Equity multiple
- 1.77×
- Total profit
- $18,287
- Equity at exit
- $12,659
- IRR
- 26.9%
- Equity multiple
- 3.29×
- Total profit
- $54,357
- Equity at exit
- $7,341
Cash invested: $23,772 (down + closing). Projections, not guarantees.
Landlord ↔ Tenant lean methodology
- Overall (STATE)
- 87 Strongly Landlord-Friendly
- State Florida
- 87 Strongly Landlord-Friendly · R+3
- County
- — inherits STATE
- City
- — inherits STATE
ZIP-level market 32244
- Home prices YoY
- -17.8%
- Rents YoY
- 2.2%
- Active inventory
- 349
- Price-to-rent
- 5.1×
Monthly cashflow live
- Estimated rent
- $1,400 high interval (Pro) →
- Mortgage (P&I)
- −$445
- Tax est. 1.5%
- −$106 /mo · $1,274/yr
- Insurance
- −$35
- HOA
- −$0
- Vacancy / Maint / Mgmt
- −$294
- Net cashflow
- $519
Break-even live
UW: 25.0% down · 7.5% · 30yr · 1.5% tax · 5.0% vac · 8.0% maint · 8.0% mgmt
Financing live
Cash to close
- Down payment
- $21,225
- Closing costs
- $2,547
- Reserves months
- —
- Total cash needed
- —
Loan-product check · same deal, 3 products live
Conventional
25% down · 7.5% · 30yr
- Down + closing
- —
- Monthly P&I
- —
- Monthly cashflow
- —
- DSCR
- —
- Eligible?
- —
Personal DTI + credit; lowest rate.
DSCR
20% down · 8.5% · 30yr
- Down + closing
- —
- Monthly P&I
- —
- Monthly cashflow
- —
- DSCR
- —
- Eligible?
- —
No personal income docs; deal must DSCR.
Hard money
10% down · 12.0% · 12mo
- Down + closing
- —
- Monthly P&I
- —
- Monthly cashflow
- —
- DSCR
- —
- Eligible?
- —
Short-term bridge; refi at stabilization.
Rent comps 35 comps
| Address | Beds | Baths | Sqft | Rent | $/sqft | DOM | Units | Dist |
|---|---|---|---|---|---|---|---|---|
| 6463 Breezy Oaks Way Jacksonville, FL | 2.0 | 2.0 | 952 | $1,295 | $1.36 | 7d | 1 | 0.33mi |
| 6457 Breezy Oaks Way Jacksonville, FL | 2.0 | 2.0 | 952 | $1,275 | $1.34 | 10d | 1 | 0.33mi |
| 6517 Breezy Oaks Way Jacksonville, FL | 2.0 | 2.0 | 952 | $1,295 | $1.36 | 23d | 1 | 0.34mi |
| 6433 Breezy Oaks Way Jacksonville, FL | 2.0 | 2.0 | 952 | $1,295 | $1.36 | 23d | 1 | 0.34mi |
| 6523 Breezy Oaks Way Jacksonville, FL | 2.0 | 2.0 | 952 | $1,295 | $1.36 | 17d | 1 | 0.34mi |
| 7052 Jammes Rd Jacksonville, FL | 3.0 | 2.0 | 990 | $1,910 | $1.93 | 23d | 1 | 0.36mi |
| 6087 Maggies Cir #104 Jacksonville, FL | 2.0 | 2.0 | 1099 | $1,275 | $1.16 | 23d | 1 | 0.61mi |
| 6100 Maggies Cir #103 Jacksonville, FL | 2.0 | 2.0 | 907 | $1,300 | $1.43 | 12d | 1 | 0.63mi |
| 6105 Maggies Cir Jacksonville, FL | 2.0–3.0 | 2.0 | 1121 | $1,325 | $1.18 | 17d | 2 | 0.64mi |
| 6945 Morse Ave Jacksonville, FL | 2.0–4.0 | 2.0 | 1169 | $950 | $0.81 | 14d | 1 | 0.71mi |
| 6063 Maggies Cir Jacksonville, FL | 2.0–3.0 | 2.0 | 1121 | $1,300 | $1.16 | 16d | 2 | 0.75mi |
| 6915 Ortega Woods Dr Unit 11 Jacksonville, FL | 2.0 | 2.0 | 940 | $1,150 | $1.22 | 20d | 1 | 0.89mi |
| 6880 Skaff Ave Jacksonville, FL | 2.0 | 2.0 | 940 | $1,285 | $1.37 | 23d | 1 | 0.97mi |
| 7350 Blanding Blvd Jacksonville, FL | 1.0–3.0 | 1.0–2.0 | 872 | $1,330 | $1.53 | 2d | 23 | 0.99mi |
| 6136 Blanding Blvd Jacksonville, FL | 1.0–3.0 | 1.0–2.0 | 1030 | $1,752 | $1.70 | 1d | 9 | 1.04mi |
| 5951 Wilmar Rd Jacksonville, FL | 2.0 | 1.0 | 706 | $1,095 | $1.55 | 23d | 1 | 1.12mi |
| 7610 Blanding Blvd Jacksonville, FL | 1.0–3.0 | 1.0–2.0 | 880 | $1,125 | $1.28 | 14d | 1 | 1.14mi |
| 5933 Jammes Rd Jacksonville, FL | 3.0 | 3.0 | 1071 | $1,900 | $1.77 | 23d | 1 | 1.15mi |
| 5900 Townsend Rd Jacksonville, FL | 1.0–3.0 | 1.0–2.0 | 1177 | $1,539 | $1.31 | 2d | 12 | 1.17mi |
| 5913 Tampico Rd Jacksonville, FL | 3.0 | 1.0 | 1110 | $1,348 | $1.21 | 13d | 1 | 1.24mi |
| 6371 Collins Rd Jacksonville, FL | 3.0 | 1.0–2.0 | 1010 | $1,745 | $1.73 | 1d | 40 | 1.25mi |
| 7740 Plantation Bay Dr Jacksonville, FL | 1.0–3.0 | 1.0–2.0 | 927 | $1,524 | $1.64 | 2d | 17 | 1.36mi |
| 6408 Sweetbay Ln Jacksonville, FL | 2.0 | 2.0 | 951 | $1,225 | $1.29 | 16d | 1 | 1.37mi |
| 6462 Sweetbay Ln Jacksonville, FL | 2.0 | 2.0 | 1040 | $1,365 | $1.31 | 16d | 1 | 1.39mi |
| 6461 Sweetbay Ln Jacksonville, FL | 2.0 | 2.0 | 995 | $1,295 | $1.30 | 16d | 4 | 1.39mi |
| 6547 Sweetbay Ln Unit 102 Jacksonville, FL | 2.0 | 2.0 | 1040 | $1,195 | $1.15 | 4d | 1 | 1.39mi |
| 6468 Sweetbay Ln #101 Jacksonville, FL | 2.0 | 2.0 | 1025 | $1,199 | $1.17 | 2d | 1 | 1.40mi |
| 6468 Sweetbay Ln Unit 102 Jacksonville, FL | 2.0 | 2.0 | 1040 | $1,174 | $1.13 | 21d | 1 | 1.40mi |
| 6534 Sweetbay Ln Jacksonville, FL | 2.0 | 2.0 | 951 | $1,225 | $1.29 | 23d | 1 | 1.42mi |
| 6479 Sweetbay Ln Jacksonville, FL | 2.0 | 2.0 | 1040 | $1,365 | $1.31 | 23d | 1 | 1.42mi |
| 5816 Sonora Dr W Jacksonville, FL | 3.0 | 1.0 | 975 | $1,580 | $1.62 | 17d | 1 | 1.43mi |
| 6528 Sweetbay Ln Jacksonville, FL | 2.0 | 2.0 | 1040 | $1,150 | $1.11 | 23d | 1 | 1.43mi |
| 6522 Sweetbay Ln Jacksonville, FL | 2.0 | 2.0 | 951 | $1,195 | $1.26 | 23d | 1 | 1.44mi |
| 5928 Firestone Rd Jacksonville, FL | 1.0–3.0 | 1.0–2.0 | 944 | $1,325 | $1.40 | 2d | 13 | 1.46mi |
| 6418 Ricker Rd Jacksonville, FL | 2.0 | 1.0 | 732 | $1,150 | $1.57 | 2d | 1 | 1.50mi |
Listing history 10 events
-
2026-06-18days on market $84,900 Active 196 DOM
-
2026-06-17days on market $84,900 Active 195 DOM
-
2026-06-16days on market $84,900 Active 194 DOM
-
2026-06-15days on market $84,900 Active 193 DOM
-
2026-06-10days on market $84,900 Active 187 DOM
-
2026-06-08days on market $84,900 Active 186 DOM
-
2026-06-03days on market $84,900 Active 181 DOM
-
2026-06-02days on market $84,900 Active 180 DOM
-
2026-06-01days on market $84,900 Active 179 DOM
-
2026-05-31days on market $84,900 Active 178 DOM
ⓘ Source: listings_history table (triggers on properties + properties_extension) + one-shot
backfill from property_details.listing_events for pre-trigger history.
Climate risk First Street
- Flood 1/10 Low FEMA zone X (unshaded) · 0% chance over 30 yrs
- Wildfire 3/10 Moderate
- Heat 8/10 Severe 7 d/yr ≥107°F today · 20 d/yr by 30 yrs out
- Wind 10/10 Extreme 99% chance of damaging wind over 30 yrs
- Air quality 3/10 Moderate 3 unhealthy d/yr today · 4 by 30 yrs out
Nearby sold comps map
Loading sold comps map…
Walkable amenities ~0.75 mi
Loading nearby amenities…
Taxation est. · year 1
- Rental income
- $16,800
- − Mortgage interest
- −$4,756
- − Property taxes
- −$1,274
- − Insurance
- −$424
- − Repairs & maintenance
- −$1,344
- − Management
- −$1,344
- − Depreciation
- −$2,470
- Taxable income
- $5,188
- Est. tax owed @ 24.0%
- −$1,245
- After-tax cash flow
- $4,986/yr
For passive investors: Depreciation is non-cash, so a rental often shows a tax loss while cash-flowing — sheltering income. Rental losses are passive: they offset passive income freely, and up to $25,000/yr can offset ordinary (W-2) income if you actively participate and your MAGI is under $100k (phasing out to $0 by $150k); unused losses carry forward. On sale, claimed depreciation is recaptured at up to 25%, and gains may owe capital-gains tax (a 1031 exchange can defer both). Figures are a year-1 estimate at your 24.0% rate — not tax advice; consult a CPA.
Schools (NCES district)
- District
- Duval
- NCES district ID
- 1200480
- Math proficiency
- 46% ▼ -11.00%
- Reading proficiency
- 45% ▼ -4.00%
- Median HH income
- $48,987
- Composite
- 38.97/100
- National rank
- #4076
- State rank
- #48 of 73 in FL
Livability — Jacksonville
- Score
- 83/100
- State rank
- #50
- US rank
- #911
Category grades
Schools grade is shown separately in the Schools card above.
Census & demographics
- Census place
- Jacksonville, FL
- County
- Duval County · 1,015,274 people
- City population
- 979,034
- Metro
- Jacksonville, FL
- Population (ZIP)
- 63,592
- Household income
- $62,204
- Rent vs Own
- Severe rent burden
- 2799.0
Population outlook (Duval County) Hauer SSP2
- Today (2025)
- 1,013,010 people
- By 2030
- 1,059,228 · +4.6%
- By 2040
- 1,141,439 · +12.7%
- By 2050
- 1,205,258 · +19.0%
- By 2075
- 1,324,282 · +30.7%
- By 2100
- 1,319,620 · +30.3%
Race, ethnicity, and origin ACS 2023
- Neighborhood character
- Highly diverse neighborhood (Simpson 0.70)
- Race & ethnicity
- White 39% Black 35% Hispanic / Latino 15% Two or more races 10% Asian 6%
- Hispanic origin (detail)
- Mexican 3% Puerto Rican 6% Cuban 3%
- Common ancestry
- Hispanic 1% Lithuanian 1% Romanian 1%
- Foreign-born
- 12% · Canada, Vietnam, China
- Languages at home
- 83% English-only · Spanish 9% Tagalog/Filipino 3% French/Haitian/Cajun 2%
Political lean MEDSL · Duval
- 2024 margin
- Toss-up / Even · D 48.7% · R 50.1% · Other 1.2%
- 2008→2024 swing
- +0.4pp no change · 2008: -1.9pp · 2024: -1.5pp
- All cycles
- 2024: R+1.5 2020: D+3.8 2016: R+1.5 2012: R+3.6 2008: R+1.9
Not yet ingested
- Civics
- —
Market trends
- HPI YoY
- ▼ -64.22%
- Current HPI
- 296.5375
- Rent YoY
- ▲ 2.25%
- Metro
- Jacksonville, FL
- State GDP YoY
- ▲ 3.28%
- F500 in state
- 36
Industry mix (Fortune 500 HQ in FL)
| Industry | F500 HQs | Revenue |
|---|---|---|
| Industrial Technology | 2 | $29B |
|
||
| Insurance | 2 | $17B |
|
||
| Retail | 1 | $60B |
|
||
| Technology Distribution | 1 | $58B |
|
||
| Homebuilding | 1 | $35B |
|
||
| Technology Manufacturing | 1 | $35B |
|
||
Cash-flow waterfall
monthlySold comps — $/sqft
last 12 mo · ≤1 miLoading sold comps…