 Triplex
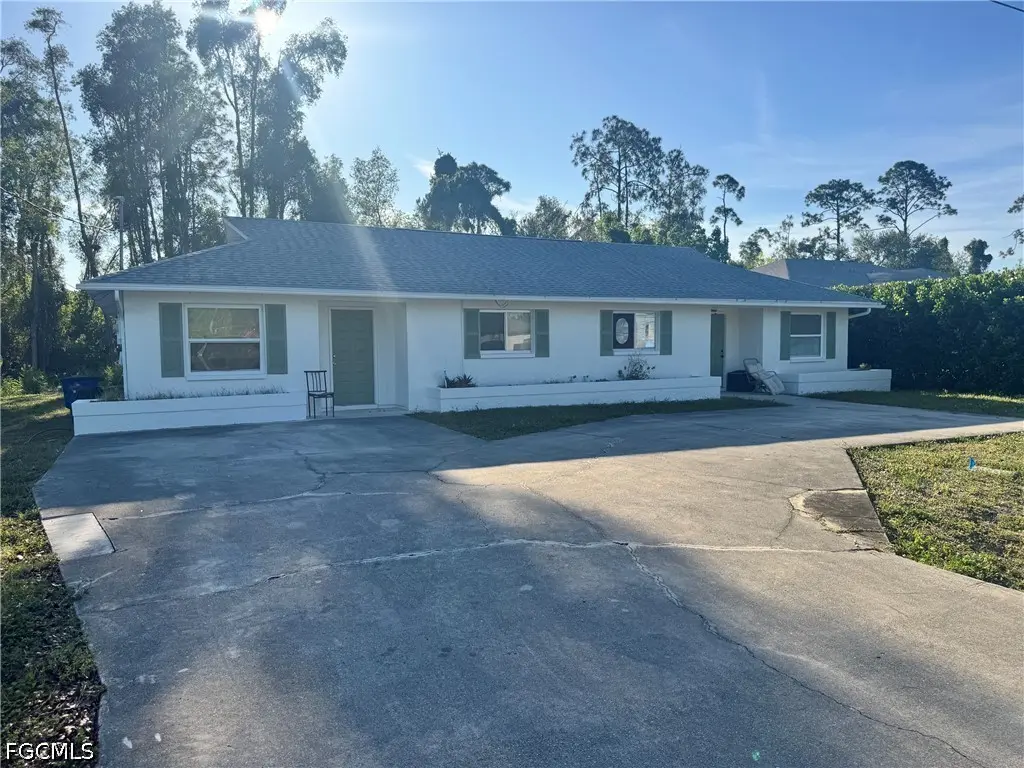
19184/19188 Miami Blvd · San Carlos Park, FL
Flood risk 4/10 · Minor
- FEMA flood zone
- X (unshaded)
- Chance of flooding over 30 yrs
- 0.22%
- Est. flood insurance / yr
- $507 – $1,088
Fire risk 1/10 · Minimal
- Est. fire insurance / yr
- $947 – $1,759
Heat risk 10/10 · Severe
- Hot days now (above 107°F)
- 7 days/yr
- Hot days in 30 yrs
- 30 days/yr
Wind risk 10/10 · Severe
- Chance of severe wind over 30 yrs
- 99.0%
Air-quality risk 2/10 · Minimal
- Unhealthy air days now
- 1 days/yr
- Unhealthy air days in 30 yrs
- 1 days/yr
Risk factors via First Street. Map © Google.
Why this score? — see what drove the C+ grade
The composite is a weighted blend of 9 inputs, each scored 0–100. Each bar is that input's sub-score; the figure is the points it added to the 100-point composite (weight × sub-score).
- Cash flow +27.7/30.0
- DSCR +9.7/10.0
- 1% rule +7.6/10.0
- ARV discount +7.5/15.0
- Schools +4.1/10.0
- Livability +3.2/5.0
- Condition / age +2.2/5.0
- Rent growth +1.1/5.0
- Appreciation +0.0/10.0
$389,900
🖨 Deal sheet (PDF) 📄 Offer letter ✓ Due diligence
Multi-family units
County records classify this as Multi-Family (2-4 Unit). Listing-text estimate: 3 units. confirmed
Listing remarks
Prime San Carlos Park Duplex, NOT IN A FLOOD ZONE –This exceptionally located property offers the perfect blend of steady cash flow and low-maintenance living, just minutes from FGCU, Gulf Coast Town Center, and RSW. Featuring two functional units with private entrances, private screened in lanais and a large shared lot, it’s an ideal addition to any portfolio or a smart move for an owner-occupant looking to live for less. With no HOA fees and a consistently high rental demand in this central corridor, this duplex is priced to sell!! New roof in 2018!
Key facts
- 0.29 acre lot
- Built 1984
- Listed 41 days
Property features AI
Finance
- Financial info: Property contains 2 total units; Gross scheduled income listed at $24,900; Unit 1 actual/pro forma rent: $950; Unit 2 actual/pro forma rent: $1,125; Tenants pay electricity and water; Pets allowed
- HOA & community: No association fee; Non-gated community
Exterior
- Utilities: Public water; Septic tank sewer; Cable available
- Home design: Single-story building; Resale property; TFC2 zoning
- Construction: Block, concrete and stucco construction; Shingle roof
- Exterior features: Rectangular lot with dimensions approximately 80 x 145 x 80 x 145; No notable exterior features listed
Interior
- Bedrooms: Each unit is a two-bedroom unit (both units have 2 bedrooms)
- Flooring: Tile
- Bathrooms: Each unit has one full bathroom (total of 2 full bathrooms in the building)
- Heating & cooling: Central electric heating; Central electric cooling
- Interior features: Tile flooring
Neighborhood map
What this means for you Summary
Snapshot
- This is a 3 × 2-bed/1.0-bath units multifamily listed at $390k. Condition is rated fair.
Deal economics
- At list price, monthly cash flow is $1k ($14k/yr) — positive. Per door: $391/mo.
- The deal already cash-flows at list — no discount required.
- Meets the 1% rule at list price ($5k rent vs $390k).
- Recommended offer: $378k (3.0% below list) — sets the bar for market timing.
- Cap rate 9.9% vs local median 2.4% in San Carlos Park — top-decile yield for the area; either an underpriced asset or a hidden risk that comps aren't pricing in. Stress-test before assuming the spread holds.
Location & tenants
- Location reads 65/100 on livability (#662 in FL) — a middle-class / working-renter tenant base. Strengths: housing A+, employment A-, crime B+; Watch: schools F, amenities F, commute F.
- Lee (suburban): math 47% / reading 50% proficiency, ranked #42 of 73 in FL (top 58%) — families likely to look elsewhere, expect single-tenant / working-renter base with shorter leases.
- Market conditions: Rents falling (-5.7%/yr); 226 active listings in the ZIP; solid renter incomes; 15,411 units permitted in Lee County in 2024 (4,686 in 5+ unit buildings).
- At $4,894/mo this rent would consume 65% of the median local household income ($91k/yr) (locally 491% of renters already pay >50% of income on rent) — very limited rent-growth headroom before tenants either downsize or default.
Forward outlook
- Local home prices are declining (-3.0%/yr); year-one equity from $3k of loan paydown is wiped out by about $12k of value loss. Plan a longer hold.
- Lee County population projected at +44% by 2050 — long-run rental-demand tailwind backs the buy-and-hold thesis.
Negotiation context
- It's been on market 41 days — a 3% lower offer ($378k) is reasonable based on typical stale-listing flexibility.
Risks & watch-outs
- Climate carrying-cost: severe wind risk, 99% chance of damaging wind over 30y; extreme-heat days projected 7→30/yr by 2055 (HVAC capex compounding) — expect insurance premiums to compound above CPI over the hold.
Questions for the listing agent
- It's been on market 41 days. Have you received any prior offers? Is the seller open to a 3% concession, seller financing, or rate buy-down credit?
- Can we see the unit-by-unit rent roll, current vacancy, and any below-market leases? What's the average tenancy length?
- What capital expenditures (roof, boiler, parking lot, exteriors) have been made in the last 5 years, and what's planned in the next 2?
- Have any recent inspections been done? Can we get a copy of the seller's disclosures and any deferred-maintenance estimates?
- Is there a deadline driving the sale (1031 exchange, divorce, estate, relocation)? That informs how much negotiation room exists.
- Schools are F-rated, which usually means shorter tenancies and higher turnover. Who's the typical renter profile here, and what's been the actual vacancy rate?
- What's the average days-on-market for RENTAL listings here right now (not sales)? A rising rental-DOM trend means longer vacancies and softer asking-rent achievability than the comps imply.
- What's the recent tenant-quality profile in this submarket — average credit score on applications, eviction rate, late-payment / NSF rate, and stable-employment percentage? A property-management company in the area should have these aggregated.
- How much new apartment / multifamily construction is in the pipeline within 1–3 miles? Heavy new supply (>2% of stock underway) typically softens rents 12–24 months out; light construction supports rent growth.
Investment metrics
- 1% rule
- 1.26% ✓
- Cap rate
- 9.90%
- Cash-on-cash
- 12.88%
- DSCR
- 1.57
- GRM
- 6.6
CMA / ARV
No comps found within radius.
Projected returns pro-forma
-3.0% appreciation · 0.0% rent growth · sell at horizon
- IRR
- -0.7%
- Equity multiple
- 0.97×
- Total profit
- $-2,820
- Equity at exit
- $58,135
- IRR
- 5.5%
- Equity multiple
- 1.35×
- Total profit
- $38,514
- Equity at exit
- $33,711
Cash invested: $109,172 (down + closing). Projections, not guarantees.
Landlord ↔ Tenant lean methodology
- Overall (STATE)
- 87 Strongly Landlord-Friendly
- State Florida
- 87 Strongly Landlord-Friendly · R+3
- County
- — inherits STATE
- City
- — inherits STATE
ZIP-level market 33967
- Home prices YoY
- -29.3%
- Rents YoY
- -5.7%
- Active inventory
- 226
- Price-to-rent
- 19.9×
Monthly cashflow live
- Estimated rent
- $4,894 medium interval (Pro) →
- Mortgage (P&I)
- −$2,045
- Tax est. 1.5%
- −$487 /mo · $5,848/yr
- Insurance
- −$162
- HOA
- −$0
- Vacancy / Maint / Mgmt
- −$1,028
- Net cashflow
- $1,172
Break-even live
Sensitivity live
| Price | -10% $1,441 | -5% $1,306 | +0% $1,172 | +5% $1,037 | +10% $902 |
|---|---|---|---|---|---|
| Rent | -10% $785 | -5% $978 | +0% $1,172 | +5% $1,365 | +10% $1,558 |
| Rate | -1.0pp $1,368 | -0.5pp $1,271 | base $1,172 | +0.5pp $1,071 | +1.0pp $968 |
3-unit breakdown (identical units grouped — click to expand)
| Units | Beds | Baths | Est. rent |
|---|---|---|---|
| 3× units | 2 | 1 | $4,893 |
| #1 | 2 | 1 | $1,631 |
| #2 | 2 | 1 | $1,631 |
| #3 | 2 | 1 | $1,631 |
| Total (3 units) | $4,894 | ||
UW: 25.0% down · 7.5% · 30yr · 1.5% tax · 5.0% vac · 8.0% maint · 8.0% mgmt
Financing live
Cash to close
- Down payment
- $97,475
- Closing costs
- $11,697
- Reserves months
- —
- Total cash needed
- —
Loan-product check · same deal, 3 products live
Conventional
25% down · 7.5% · 30yr
- Down + closing
- —
- Monthly P&I
- —
- Monthly cashflow
- —
- DSCR
- —
- Eligible?
- —
Personal DTI + credit; lowest rate.
DSCR
20% down · 8.5% · 30yr
- Down + closing
- —
- Monthly P&I
- —
- Monthly cashflow
- —
- DSCR
- —
- Eligible?
- —
No personal income docs; deal must DSCR.
Hard money
10% down · 12.0% · 12mo
- Down + closing
- —
- Monthly P&I
- —
- Monthly cashflow
- —
- DSCR
- —
- Eligible?
- —
Short-term bridge; refi at stabilization.
Listing history 13 events
-
2026-06-17days on market $389,900 Active 41 DOM
-
2026-06-16days on market $389,900 Active 40 DOM
-
2026-06-15days on market $389,900 Active 39 DOM
-
2026-06-13days on market $389,900 Active 37 DOM
-
2026-06-10days on market $389,900 Active 34 DOM
-
2026-06-09days on market $389,900 Active 33 DOM
-
2026-06-08days on market $389,900 Active 32 DOM
-
2026-06-07days on market $389,900 Active 31 DOM
-
2026-06-03days on market $389,900 Active 27 DOM
-
2026-06-02days on market $389,900 Active 26 DOM
-
2026-06-01days on market $389,900 Active 25 DOM
-
2026-05-31days on market $389,900 Active 24 DOM
-
2026-05-07$389,900 Active
ⓘ Source: listings_history table (triggers on properties + properties_extension) + one-shot
backfill from property_details.listing_events for pre-trigger history.
Climate risk First Street
- Flood 4/10 Moderate FEMA zone X (unshaded) · 22% chance over 30 yrs
- Wildfire 1/10 Low
- Heat 10/10 Extreme 7 d/yr ≥107°F today · 30 d/yr by 30 yrs out
- Wind 10/10 Extreme 99% chance of damaging wind over 30 yrs
- Air quality 2/10 Low 1 unhealthy d/yr today · 1 by 30 yrs out
Nearby sold comps map
Loading sold comps map…
Walkable amenities ~0.75 mi
Loading nearby amenities…
Taxation est. · year 1
- Rental income
- $58,728
- − Mortgage interest
- −$21,840
- − Property taxes
- −$5,848
- − Insurance
- −$1,950
- − Repairs & maintenance
- −$4,698
- − Management
- −$4,698
- − Depreciation
- −$11,343
- Taxable income
- $8,351
- Est. tax owed @ 24.0%
- −$2,004
- After-tax cash flow
- $12,057/yr
For passive investors: Depreciation is non-cash, so a rental often shows a tax loss while cash-flowing — sheltering income. Rental losses are passive: they offset passive income freely, and up to $25,000/yr can offset ordinary (W-2) income if you actively participate and your MAGI is under $100k (phasing out to $0 by $150k); unused losses carry forward. On sale, claimed depreciation is recaptured at up to 25%, and gains may owe capital-gains tax (a 1031 exchange can defer both). Figures are a year-1 estimate at your 24.0% rate — not tax advice; consult a CPA.
Condition & rehab AI · 12 photos
This two-unit property in San Carlos Park, Florida, requires moderate renovations to improve its condition and increase its value. The home is located in a prime location with no HOA fees and a consistently high rental demand. Upgrading the kitchen, bathroom, exterior, and landscaping would significantly enhance the home's appearance and functionality.
Repairs flagged
- Minor kitchen countertops — Cluttered and could benefit from cleaning and organization.
- Minor bathroom fixtures — Dated and could be replaced with modern fixtures.
- Moderate exterior siding — Shows some wear and could benefit from a fresh coat of paint.
- Minor tile flooring — Shows some wear and could be cleaned or replaced with new tiles.
- Minor interior walls — Show some wear and could be painted or refreshed.
- Minor windows — Show some wear and could be replaced with energy-efficient windows.
- Minor HVAC filters — Could be replaced with new filters to improve air quality and efficiency.
- Minor landscaping — Could be refreshed with new plants and landscaping to improve curb appeal.
Value-add opportunities
- Both updating kitchen countertops — Cleaning and organizing the countertops would improve the overall appearance and functionality of the kitchen.
- Both replacing bathroom fixtures — Updating the dated fixtures would improve the bathroom's appearance and functionality.
- Both painting exterior siding — Painting the exterior siding would improve the home's curb appeal and increase its value.
- Both cleaning tile flooring — Cleaning the tile flooring would improve the home's appearance and functionality.
- Both painting interior walls — Painting the interior walls would improve the home's appearance and functionality.
- Both replacing windows — Replacing the windows would improve the home's energy efficiency and increase its value.
- Both replacing HVAC filters — Replacing the HVAC filters would improve the home's air quality and increase its value.
- Both refreshing landscaping — Refreshing the landscaping would improve the home's curb appeal and increase its value.
Renovation cost estimate screening
| Repair item | Severity | Est. cost |
|---|---|---|
| kitchen countertops · Cluttered and could benefit from cleaning and organization. | Minor | $500–3,000 |
| bathroom fixtures · Dated and could be replaced with modern fixtures. | Minor | $500–3,000 |
| exterior siding · Shows some wear and could benefit from a fresh coat of paint. | Moderate | $3,000–15,000 |
| tile flooring · Shows some wear and could be cleaned or replaced with new tiles. | Minor | $500–3,000 |
| interior walls · Show some wear and could be painted or refreshed. | Minor | $500–3,000 |
| windows · Show some wear and could be replaced with energy-efficient windows. | Minor | $500–3,000 |
| HVAC filters · Could be replaced with new filters to improve air quality and efficiency. | Minor | $500–3,000 |
| landscaping · Could be refreshed with new plants and landscaping to improve curb appeal. | Minor | $500–3,000 |
| Total estimated repair cost · 8 items | $6,500–36,000 |
Value-add ROI direction
- Both updating kitchen countertops — Cleaning and organizing the countertops would improve the overall appearance and functionality of the kitchen. ↑
- Both replacing bathroom fixtures — Updating the dated fixtures would improve the bathroom's appearance and functionality. ↑
- Both painting exterior siding — Painting the exterior siding would improve the home's curb appeal and increase its value. ↑
- Both cleaning tile flooring — Cleaning the tile flooring would improve the home's appearance and functionality. ↑
- Both painting interior walls — Painting the interior walls would improve the home's appearance and functionality. ↑
- Both replacing windows — Replacing the windows would improve the home's energy efficiency and increase its value. ↑
- Both replacing HVAC filters — Replacing the HVAC filters would improve the home's air quality and increase its value. ↑
- Both refreshing landscaping — Refreshing the landscaping would improve the home's curb appeal and increase its value. ↑
ⓘ Cost ranges are severity-bucket heuristics (US national rule-of-thumb). Get contractor quotes + a written scope before underwriting a rehab budget.
Schools (NCES district)
- District
- Lee
- NCES district ID
- 1201080
- Math proficiency
- 47% ▼ -11.00%
- Reading proficiency
- 50% ▼ -4.00%
- Median HH income
- $49,518
- Composite
- 41.49/100
- National rank
- #3458
- State rank
- #42 of 73 in FL
Livability — San Carlos Park
- Score
- 65/100
- State rank
- #662
- US rank
- #13354
Category grades
Schools grade is shown separately in the Schools card above.
Census & demographics
- Census place
- San Carlos Park, FL
- County
- Lee County · 788,662 people
- City population
- 27,337
- Metro
- Cape Coral-Fort Myers, FL
- Population (ZIP)
- 28,341
- Household income
- $90,519
- Rent vs Own
- Severe rent burden
- 491.0
Population outlook (Lee County) Hauer SSP2
- Today (2025)
- 871,946 people
- By 2030
- 955,468 · +9.6%
- By 2040
- 1,113,587 · +27.7%
- By 2050
- 1,256,891 · +44.1%
- By 2075
- 1,560,270 · +78.9%
- By 2100
- 1,726,848 · +98.0%
Race, ethnicity, and origin ACS 2023
- Neighborhood character
- Predominantly White (67%)
- Race & ethnicity
- White 67% Hispanic / Latino 23% Two or more races 16% Asian 3% Black 3%
- Hispanic origin (detail)
- Mexican 8% Puerto Rican 2% Cuban 4% Dominican 1%
- Common ancestry
- Romanian 3% Lithuanian 2% Slovak 2%
- Foreign-born
- 14% · Canada, Jamaica, Vietnam
- Languages at home
- 79% English-only · Spanish 16% Other Indo-European 1% Vietnamese 1%
Political lean MEDSL · Lee
- 2024 margin
- Strong R (+28.4) · D 35.5% · R 63.9%
- 2008→2024 swing
- -18.0pp toward R · 2008: -10.4pp · 2024: -28.4pp
- All cycles
- 2024: R+28.4 2020: R+19.2 2016: R+20.4 2012: R+16.6 2008: R+10.4
Not yet ingested
- Civics
- —
Market trends
- HPI YoY
- ▼ -123.07%
- Current HPI
- 296.5923
- Rent YoY
- ▼ -5.68%
- Metro
- Cape Coral-Fort Myers, FL
- State GDP YoY
- ▲ 3.28%
- F500 in state
- 36
Industry mix (Fortune 500 HQ in FL)
| Industry | F500 HQs | Revenue |
|---|---|---|
| Industrial Technology | 2 | $29B |
|
||
| Insurance | 2 | $17B |
|
||
| Retail | 1 | $60B |
|
||
| Technology Distribution | 1 | $58B |
|
||
| Homebuilding | 1 | $35B |
|
||
| Technology Manufacturing | 1 | $35B |
|
||
Price history
1 event — show timeline
- 2026-05-07 Listed $389,900 FORTMLS
Cash-flow waterfall
monthlySold comps — $/sqft
last 12 mo · ≤1 miLoading sold comps…