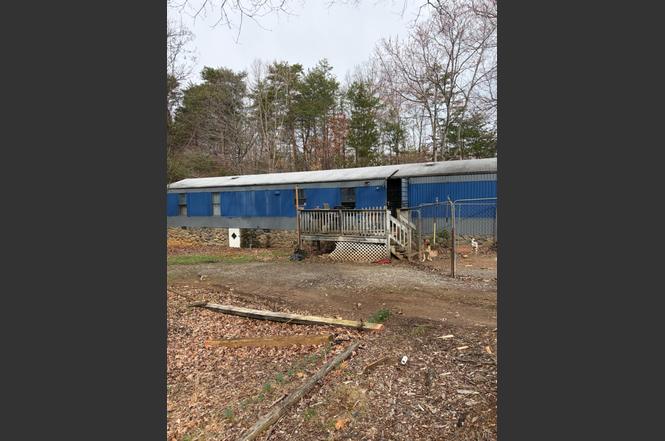
65 June Way · Timberlake, VA
Flood risk No data
- FEMA flood zone
- —
- Chance of flooding over 30 yrs
- —
- Est. flood insurance / yr
- —
Fire risk No data
- Est. fire insurance / yr
- —
Heat risk No data
- Hot days now (above threshold)
- —
- Hot days in 30 yrs
- —
Wind risk No data
- Chance of severe wind over 30 yrs
- —
Air-quality risk No data
- Unhealthy air days now
- —
- Unhealthy air days in 30 yrs
- —
Risk factors via First Street. Map © Google.
Why this score? — see what drove the B+ grade
The composite is a weighted blend of 9 inputs, each scored 0–100. Each bar is that input's sub-score; the figure is the points it added to the 100-point composite (weight × sub-score).
- Cash flow +30.0/30.0
- ARV discount +15.0/15.0
- DSCR +10.0/10.0
- 1% rule +9.6/10.0
- Schools +5.2/10.0
- Livability +3.5/5.0
- Rent growth +2.5/5.0
- Condition / age +2.5/5.0
- Appreciation +0.0/10.0
$99,000
🖨 Deal sheet (PDF) 📄 Offer letter ✓ Due diligence
Listing remarks
AS-IS Where is. Come see this 2bd trailer on 3 acrea in Rustburg school district. New floors
Key facts
- New floors
- 3 acres
- 3.01 acre lot
Tags
Neighborhood map
What this means for you Summary
Snapshot
- This is a 2-bed/1.0-bath single-family listed at $99k.
Deal economics
- At list price, monthly cash flow is $549 ($7k/yr) — positive.
- The deal already cash-flows at list — no discount required.
- Meets the 1% rule at list price ($1k rent vs $99k).
- Recommended offer: $96k (3.0% below list) — sets the bar for market timing.
- Cap rate 12.9% vs local median 3.8% in Timberlake — top-decile yield for the area; either an underpriced asset or a hidden risk that comps aren't pricing in. Stress-test before assuming the spread holds.
Location & tenants
- Location reads 70/100 on livability (#227 in VA) — a middle-class / working-renter tenant base. Strengths: cost of living A+, housing A+; Watch: health & safety C-, commute D+, amenities F.
- Campbell County Public School District (rural): math 55% / reading 68% proficiency, ranked #55 of 131 in VA (top 42%) — acceptable for families but not a draw, mixed tenant base, ~2y average lease.
- Zoned schools: Yellow Branch Elementary (math 60% / reading 63%, grade B, #516 of 1,108 statewide, top 47%, 573 students, 74% FRL); Rustburg Middle (math 49% / reading 65%, grade B, #178 of 342 statewide, top 53%, 606 students, 74% FRL); Rustburg High (math 77% / reading 67%, grade B+, #134 of 319 statewide, top 45%, 828 students, 67% FRL) — zoned schools average 72% FRL vs 37% district-wide (35 pts higher); higher-poverty schools than district average — tighter screening recommended.
- Market conditions: 36 active listings in the ZIP; 315 units permitted in Campbell County in 2024 (51 in 5+ unit buildings).
Forward outlook
- Local home prices are declining (-3.0%/yr); year-one equity from $684 of loan paydown is wiped out by about $3k of value loss. Plan a longer hold.
- Campbell County population projected to shrink 6% by 2050 — rents likely to lag national; underwrite the cash flow, not the appreciation.
- At projected returns (-3.0% appreciation + 3.0% rent growth), your $28k cash investment doubles in ~6 years — after that, you're playing with house money.
Negotiation context
- It's been on market 46 days — a 3% lower offer ($96k) is reasonable based on typical stale-listing flexibility.
- 2 sale attempts since 5y ago; this cycle's ask has dropped $6k (6%) from the opening price — seller is motivated, your offer sets the floor, not the list.
- Current owner paid $40k; list at $99k implies a 148% gain — meaningful room to come down on a strong offer.
Questions for the listing agent
- It's been on market 46 days. Have you received any prior offers? Is the seller open to a 3% concession, seller financing, or rate buy-down credit?
- Is there a deadline driving the sale (1031 exchange, divorce, estate, relocation)? That informs how much negotiation room exists.
- Schools are F-rated, which usually means shorter tenancies and higher turnover. Who's the typical renter profile here, and what's been the actual vacancy rate?
- What's the average days-on-market for RENTAL listings here right now (not sales)? A rising rental-DOM trend means longer vacancies and softer asking-rent achievability than the comps imply.
- What's the recent tenant-quality profile in this submarket — average credit score on applications, eviction rate, late-payment / NSF rate, and stable-employment percentage? A property-management company in the area should have these aggregated.
- How much new for-sale + rental construction is in the pipeline within 1–3 miles? Heavy new supply typically softens prices + rents 12–24 months out; constrained supply supports both.
Investment metrics
- 1% rule
- 1.46% ✓
- Cap rate
- 12.95%
- Cash-on-cash
- 23.77%
- DSCR
- 2.06
- GRM
- 5.7
CMA / ARV
- ARV (on-the-fly)
- $134,064
- Comps found
- 4
Show comp detail 4 sales within ~0.75 mi
| Address | Dist | Beds/Ba | Sqft | Sold | Price | $/sf | Match |
|---|---|---|---|---|---|---|---|
| 65 June Way | 0.00mi | 2/2.0 | 1,022 (+1%) | 1mo | $73,000 | $71 | 93 |
| 5935 Wards Rd | 0.68mi | 2/1.0 | 1,000 (-1%) | 10mo | $70,000 | $70 | 58 |
| 6304 Wards Rd | 0.34mi | 3/2.0 (+1) | 1,090 (+8%) | 7mo | $172,500 | $158 | 56 |
| 6019 Wards Rd | 0.62mi | 2/1.0 | 917 (-9%) | 13mo | $122,300 | $133 | 46 |
Match score weights: distance 35% · size 25% · config 20% · recency 20%. Top-matched comps best support the ARV.
Projected returns pro-forma
-3.0% appreciation · 3.0% rent growth · sell at horizon
- IRR
- 16.9%
- Equity multiple
- 1.68×
- Total profit
- $18,896
- Equity at exit
- $14,761
- IRR
- 25.4%
- Equity multiple
- 3.21×
- Total profit
- $61,348
- Equity at exit
- $8,560
Cash invested: $27,720 (down + closing). Projections, not guarantees.
Landlord ↔ Tenant lean methodology
- Overall (STATE)
- 55 Moderately Landlord-Leaning
- State Virginia
- 55 Moderately Landlord-Leaning · D+2
- County
- — inherits STATE
- City
- — inherits STATE
ZIP-level market 24550
- Home prices YoY
- -20.9%
- Active inventory
- 36
- Price-to-rent
- 5.7×
Monthly cashflow live
- Estimated rent
- $1,446 medium interval (Pro) →
- Mortgage (P&I)
- −$519
- Tax from tax record
- −$33 /mo · $394/yr
- Insurance
- −$41
- HOA
- −$0
- Vacancy / Maint / Mgmt
- −$304
- Net cashflow
- $549
Break-even live
Sensitivity live
| Price | -10% $605 | -5% $577 | +0% $549 | +5% $521 | +10% $493 |
|---|---|---|---|---|---|
| Rent | -10% $435 | -5% $492 | +0% $549 | +5% $606 | +10% $663 |
| Rate | -1.0pp $599 | -0.5pp $574 | base $549 | +0.5pp $523 | +1.0pp $497 |
UW: 25.0% down · 7.5% · 30yr · 1.5% tax · 5.0% vac · 8.0% maint · 8.0% mgmt
Financing live
Cash to close
- Down payment
- $24,750
- Closing costs
- $2,970
- Reserves months
- —
- Total cash needed
- —
Loan-product check · same deal, 3 products live
Conventional
25% down · 7.5% · 30yr
- Down + closing
- —
- Monthly P&I
- —
- Monthly cashflow
- —
- DSCR
- —
- Eligible?
- —
Personal DTI + credit; lowest rate.
DSCR
20% down · 8.5% · 30yr
- Down + closing
- —
- Monthly P&I
- —
- Monthly cashflow
- —
- DSCR
- —
- Eligible?
- —
No personal income docs; deal must DSCR.
Hard money
10% down · 12.0% · 12mo
- Down + closing
- —
- Monthly P&I
- —
- Monthly cashflow
- —
- DSCR
- —
- Eligible?
- —
Short-term bridge; refi at stabilization.
Listing history 7 events
-
2026-04-24status Pending
-
2026-04-16price $99,000
-
2026-03-09$105,000 Active
-
2022-01-13soldstatus $39,900
-
2022-01-13soldstatus $39,900
-
2021-11-02$39,900
-
2001-02-05soldstatus $32,400
ⓘ Source: listings_history table (triggers on properties + properties_extension) + one-shot
backfill from property_details.listing_events for pre-trigger history.
Tax reassessment forecast VA · Resets to sale price
- Current annual tax
- $394 · $33/mo
- Projected year-2 tax
- $812 · $68/mo
- Expected delta
- +$418/yr (+$35/mo · 105.9%)
ⓘ Screening estimate from a state-policy table — verify with the county assessor before closing.
Nearby sold comps map
Loading sold comps map…
Walkable amenities ~0.75 mi
Loading nearby amenities…
Taxation est. · year 1
- Rental income
- $17,352
- − Mortgage interest
- −$5,546
- − Property taxes
- −$394
- − Insurance
- −$495
- − Repairs & maintenance
- −$1,388
- − Management
- −$1,388
- − Depreciation
- −$2,880
- Taxable income
- $5,261
- Est. tax owed @ 24.0%
- −$1,263
- After-tax cash flow
- $5,326/yr
For passive investors: Depreciation is non-cash, so a rental often shows a tax loss while cash-flowing — sheltering income. Rental losses are passive: they offset passive income freely, and up to $25,000/yr can offset ordinary (W-2) income if you actively participate and your MAGI is under $100k (phasing out to $0 by $150k); unused losses carry forward. On sale, claimed depreciation is recaptured at up to 25%, and gains may owe capital-gains tax (a 1031 exchange can defer both). Figures are a year-1 estimate at your 24.0% rate — not tax advice; consult a CPA.
Schools (NCES district)
- District
- Campbell County Public School District
- NCES district ID
- 5100600
- Math proficiency
- 55% ▼ -29.00%
- Reading proficiency
- 68% ▼ -11.00%
- Median HH income
- $45,915
- Composite
- 51.88/100
- National rank
- #1656
- State rank
- #55 of 131 in VA
Livability — Timberlake
- Score
- 70/100
- State rank
- #227
- US rank
- #7595
Category grades
Schools grade is shown separately in the Schools card above.
Census & demographics
- Population (ZIP)
- 7,941
Population outlook (Campbell County) Hauer SSP2
- Today (2025)
- 56,306 people
- By 2030
- 56,366 · +0.1%
- By 2040
- 55,406 · -1.6%
- By 2050
- 53,011 · -5.9%
- By 2075
- 45,932 · -18.4%
- By 2100
- 36,029 · -36.0%
Race, ethnicity, and origin ACS 2023
- Neighborhood character
- Predominantly White (80%)
- Race & ethnicity
- White 80% Black 10% Two or more races 6% Asian 3%
- Common ancestry
- German 2% Italian 1% Slovak 1%
- Foreign-born
- 6% · Vietnam, Canada, Dominican Republic
- Languages at home
- 91% English-only · Vietnamese 3% Spanish 2%
Political lean MEDSL · Campbell
- 2024 margin
- Solid R (+48.6) · D 25.3% · R 73.9%
- 2008→2024 swing
- -12.3pp toward R · 2008: -36.2pp · 2024: -48.6pp
- All cycles
- 2024: R+48.6 2020: R+44.1 2016: R+47.2 2012: R+39.4 2008: R+36.2
Not yet ingested
- Civics
- —
Market trends
- HPI YoY
- ▼ -47.59%
- Current HPI
- 180.6833
- Rent YoY
- —
- Metro
- —
- State GDP YoY
- ▲ 2.40%
- F500 in state
- 50
Industry mix (Fortune 500 HQ in VA)
| Industry | F500 HQs | Revenue |
|---|---|---|
| Aerospace / Defense | 4 | $236B |
|
||
| Technology / Defense | 3 | $32B |
|
||
| Financial Services | 2 | $176B |
|
||
| Utilities | 2 | $27B |
|
||
| Insurance | 2 | $25B |
|
||
| Technology | 2 | $15B |
|
||
Price history
+205.6% since first listed7 events — show timeline
- 2026-04-24 Pending — LMLS
- 2026-04-16 Price Changed $99,000 LMLS
- 2026-03-09 Listed $105,000 LMLS
- 2022-01-13 Sold (Public Records) $39,900 Public Records
- 2022-01-13 Sold (MLS) $39,900 LMLS
- 2021-11-02 Listed $39,900 LMLS
- 2001-02-05 Sold (Public Records) $32,400 Public Records
Property tax history
+1.3%/yrLatest (2025): $394 · +0.0% YoY. Source: county tax records.
Cash-flow waterfall
monthlySold comps — $/sqft
last 12 mo · ≤1 miLoading sold comps…