 Multi-family
10203 Oak Branch Ln · Dallas, TX
Flood risk 1/10 · Minimal
- FEMA flood zone
- X (unshaded)
- Chance of flooding over 30 yrs
- 0.0%
- Est. flood insurance / yr
- $507 – $1,088
Fire risk 1/10 · Minimal
- Est. fire insurance / yr
- $1,222 – $2,270
Heat risk 8/10 · Major
- Hot days now (above 110°F)
- 7 days/yr
- Hot days in 30 yrs
- 25 days/yr
Wind risk 6/10 · Moderate
- Chance of severe wind over 30 yrs
- 27.0%
Air-quality risk 2/10 · Minimal
- Unhealthy air days now
- 1 days/yr
- Unhealthy air days in 30 yrs
- 2 days/yr
Risk factors via First Street. Map © Google.
Why this score? — see what drove the C- grade
The composite is a weighted blend of 9 inputs, each scored 0–100. Each bar is that input's sub-score; the figure is the points it added to the 100-point composite (weight × sub-score).
- Cash flow +20.5/30.0
- ARV discount +7.5/15.0
- 1% rule +7.0/10.0
- DSCR +6.5/10.0
- Livability +4.0/5.0
- Schools +2.8/10.0
- Condition / age +2.5/5.0
- Rent growth +2.4/5.0
- Appreciation +0.0/10.0
$150,000
🖨 Deal sheet (PDF) 📄 Offer letter ✓ Due diligence
Multi-family units
County records classify this as Multi-Family (2-4 Unit). Listing-text estimate: 1 unit. estimate disagrees with records
Listing remarks
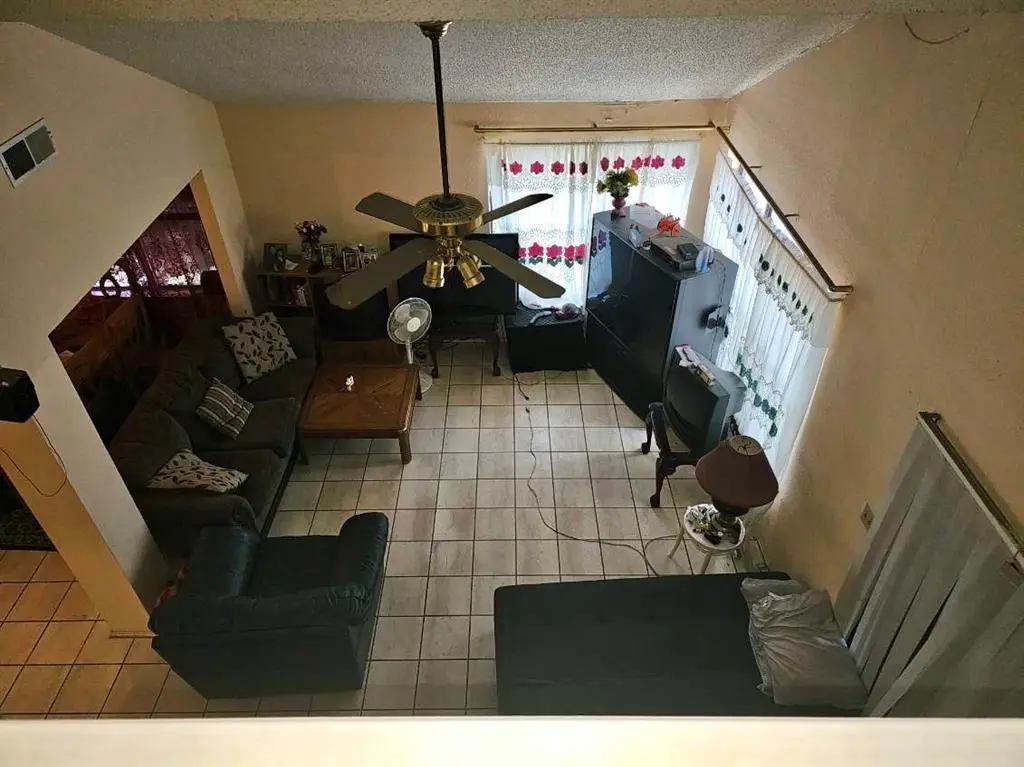
BACK ON MARKET Investor opportunity. No Blind Offers. Corner Lot, 3 bed 2 bath, 1 car rear entry garage half duplex. Home is livable as is, a little TLC and it will make a great home or income property. Primary bedroom, bath, kitchen, dining and living room are on the first floor, Vaulted ceiling makes way to 2 additional bedrooms, a full bath and small loft space upstairs. Kitchen has ample cabinet, counter space, and breakfast bar. Roof is approximately 4 years old. Located near major roads, shopping, and dining. Home is currently occupied, contact listing agent for showings and additional information. Seller does not have Survey, buyer to purchase Survey. Home sold AS IS.
Key facts
- 4,617 sq ft lot
- Garage
- Built 1985
Neighborhood map
What this means for you Summary
Snapshot
- This is a 3-bed/2.0-bath multifamily listed at $150k.
Deal economics
- At list price, monthly cash flow is $198 ($2k/yr) — positive.
- The deal already cash-flows at list — no discount required.
- Meets the 1% rule at list price ($2k rent vs $150k).
- Recommended offer: $141k (6.0% below list) — sets the bar for market timing.
- Cap rate 7.9% vs local median 2.3% in Dallas — top-decile yield for the area; either an underpriced asset or a hidden risk that comps aren't pricing in. Stress-test before assuming the spread holds.
Location & tenants
- Location reads 81/100 on livability (#24 in TX, #1,380 nationally) — a professional / high-income tenant draw. Strengths: amenities A+, commute A+, housing A+; Watch: crime F.
- Dallas ISD (urban): math 31% / reading 36% proficiency, ranked #559 of 826 in TX (top 68%) — families likely to look elsewhere, expect single-tenant / working-renter base with shorter leases; 83% free/reduced lunch — lower-income household profile, screen leases tightly.
- Zoned schools: Edward Titche El (math 31% / reading 31%, grade F, #2,429 of 4,322 statewide, top 57%, 678 students, 99% FRL) — zoned schools average 99% FRL vs 83% district-wide (16 pts higher); higher-poverty schools than district average — tighter screening recommended.
- Market conditions: Rents soft (-0.4%/yr); 179 active listings in the ZIP; 40 comparable units currently listed for rent nearby; rentals at typical pace (median 25d on market — plan ~3-4 weeks tenant-placement turnaround); 45% of comp listings sitting > 30 days — soft ceiling on asking rent; 12,577 units permitted in Dallas County in 2024 (6,829 in 5+ unit buildings).
- This rent runs 34% of the median local income ($64k/yr) — at the standard rent-burdened threshold; future hikes will face affordability resistance.
Forward outlook
- Local home prices are declining (-3.0%/yr); year-one equity from $1k of loan paydown is wiped out by about $4k of value loss. Plan a longer hold.
- Dallas County population projected at +35% by 2050 — long-run rental-demand tailwind backs the buy-and-hold thesis.
Negotiation context
- It's been on market 82 days — a 6% lower offer ($141k) is reasonable based on typical stale-listing flexibility.
- 3 sale attempts since 3y ago; this cycle's ask has dropped $45k (23%) from the opening price — seller is motivated, your offer sets the floor, not the list.
Risks & watch-outs
- Watch-outs: property tax is 3.0% of price.
- Climate carrying-cost: major wind risk, 27% chance of damaging wind over 30y; extreme-heat days projected 7→25/yr by 2055 (HVAC capex compounding) — expect insurance premiums to compound above CPI over the hold.
Questions for the listing agent
- It's been on market 82 days. Have you received any prior offers? Is the seller open to a 6% concession, seller financing, or rate buy-down credit?
- Property tax is high relative to price — has the assessment been appealed recently, and will the sale trigger a re-assessment?
- Why hasn't it sold? Are there any deal-killer items the seller is aware of (foundation, flood, title, zoning, code violations)?
- Is there a deadline driving the sale (1031 exchange, divorce, estate, relocation)? That informs how much negotiation room exists.
- Crime grade is F in this area — have there been break-ins, vandalism, or insurance claims at this property in the last 3 years? What carrier currently insures it and at what premium?
- What's the average days-on-market for RENTAL listings here right now (not sales)? A rising rental-DOM trend means longer vacancies and softer asking-rent achievability than the comps imply.
- What's the recent tenant-quality profile in this submarket — average credit score on applications, eviction rate, late-payment / NSF rate, and stable-employment percentage? A property-management company in the area should have these aggregated.
- How much new apartment / multifamily construction is in the pipeline within 1–3 miles? Heavy new supply (>2% of stock underway) typically softens rents 12–24 months out; light construction supports rent growth.
Investment metrics
- 1% rule
- 1.20% ✓
- Cap rate
- 7.88%
- Cash-on-cash
- 5.67%
- DSCR
- 1.25
- GRM
- 6.9
CMA / ARV
No comps found within radius.
Projected returns pro-forma
-3.0% appreciation · 0.0% rent growth · sell at horizon
- IRR
- -11.4%
- Equity multiple
- 0.60×
- Total profit
- $-16,805
- Equity at exit
- $22,365
- IRR
- -8.2%
- Equity multiple
- 0.57×
- Total profit
- $-18,173
- Equity at exit
- $12,969
Cash invested: $42,000 (down + closing). Projections, not guarantees.
Landlord ↔ Tenant lean methodology
- Overall (STATE)
- 87 Strongly Landlord-Friendly
- State Texas
- 87 Strongly Landlord-Friendly · R+5
- County
- — inherits STATE
- City
- — inherits STATE
ZIP-level market 75227
- Home prices YoY
- -30.9%
- Rents YoY
- -0.4%
- Active inventory
- 179
- Price-to-rent
- 6.9×
Monthly cashflow live
- Estimated rent
- $1,800 high interval (Pro) →
- Mortgage (P&I)
- −$787
- Tax from tax record
- −$375 /mo · $4,494/yr
- Insurance
- −$62
- HOA
- −$0
- Vacancy / Maint / Mgmt
- −$378
- Net cashflow
- $198
Break-even live
Sensitivity live
| Price | -10% $283 | -5% $241 | +0% $198 | +5% $156 | +10% $113 |
|---|---|---|---|---|---|
| Rent | -10% $56 | -5% $127 | +0% $198 | +5% $269 | +10% $341 |
| Rate | -1.0pp $274 | -0.5pp $237 | base $198 | +0.5pp $160 | +1.0pp $120 |
UW: 25.0% down · 7.5% · 30yr · 1.5% tax · 5.0% vac · 8.0% maint · 8.0% mgmt
Financing live
Cash to close
- Down payment
- $37,500
- Closing costs
- $4,500
- Reserves months
- —
- Total cash needed
- —
Loan-product check · same deal, 3 products live
Conventional
25% down · 7.5% · 30yr
- Down + closing
- —
- Monthly P&I
- —
- Monthly cashflow
- —
- DSCR
- —
- Eligible?
- —
Personal DTI + credit; lowest rate.
DSCR
20% down · 8.5% · 30yr
- Down + closing
- —
- Monthly P&I
- —
- Monthly cashflow
- —
- DSCR
- —
- Eligible?
- —
No personal income docs; deal must DSCR.
Hard money
10% down · 12.0% · 12mo
- Down + closing
- —
- Monthly P&I
- —
- Monthly cashflow
- —
- DSCR
- —
- Eligible?
- —
Short-term bridge; refi at stabilization.
Rent comps 40 comps
| Address | Beds | Baths | Sqft | Rent | $/sqft | DOM | Units | Dist |
|---|---|---|---|---|---|---|---|---|
| 10216 Blackjack Oaks Dr Dallas, TX | 3.0 | 2.0 | 1453 | $1,865 | $1.28 | 25d | 1 | 0.05mi |
| 10212 Hillhouse Ln Dallas, TX | 2.0 | 1.0 | 1183 | $1,499 | $1.27 | 8d | 1 | 0.10mi |
| 10236 Hillhouse Ln Dallas, TX | 3.0 | 2.0 | 1323 | $1,600 | $1.21 | 44d | 1 | 0.11mi |
| 10320 Carolina Oaks Dr Dallas, TX | 4.0 | 2.0 | 1453 | $1,900 | $1.31 | 8d | 1 | 0.16mi |
| 2255 Nantucket Village Dr Dallas, TX | 3.0 | 2.0 | 1037 | $1,625 | $1.57 | 44d | 1 | 0.21mi |
| 9920 Bluffcreek Dr Dallas, TX | 4.0 | 2.0 | 1377 | $2,191 | $1.59 | 25d | 1 | 0.22mi |
| 2315 Summit Ln Dallas, TX | 3.0 | 2.0 | 1200 | $1,800 | $1.50 | 8d | 1 | 0.25mi |
| 2123 Chatham Square Ct Dallas, TX | 4.0 | 2.5 | 1464 | $2,500 | $1.71 | 4d | 1 | 0.30mi |
| 2540 Winter Oak St Dallas, TX | 3.0 | 2.0 | 994 | $1,750 | $1.76 | 21d | 1 | 0.32mi |
| 10320 Nantucket Village Ct Dallas, TX | 3.0 | 2.0 | 1037 | $1,645 | $1.59 | 44d | 1 | 0.33mi |
| 2603 Winter Oak St Dallas, TX | 3.0 | 2.0 | 1004 | $1,921 | $1.91 | 44d | 1 | 0.34mi |
| 10368 Wood Heights Dr Dallas, TX | 4.0 | 2.5 | 1550 | $2,085 | $1.35 | 44d | 1 | 0.35mi |
| 10611 Woodleaf Dr Dallas, TX | 2.0 | 2.0 | 959 | $1,695 | $1.77 | 17d | 1 | 0.35mi |
| 10611 Woodleaf Dr Dallas, TX | 2.0 | 2.0 | 959 | $1,650 | $1.72 | 8d | 1 | 0.35mi |
| 10348 Wood Heights Dr Dallas, TX | 3.0 | 2.5 | 1358 | $2,000 | $1.47 | 44d | 1 | 0.36mi |
| 2703 Oak Bend Ln Dallas, TX | 3.0 | 2.0 | 1611 | $2,035 | $1.26 | 44d | 1 | 0.38mi |
| 2708 Briarbank Cir Dallas, TX | 3.0 | 2.0 | 1349 | $1,840 | $1.36 | 3d | 1 | 0.39mi |
| 2041 New Haven Dr Dallas, TX | 3.0 | 1.5 | 1362 | $1,720 | $1.26 | 17d | 1 | 0.44mi |
| 9921 Cedar Mountain Cir Dallas, TX | 3.0 | 2.0 | 1202 | $1,895 | $1.58 | 44d | 1 | 0.52mi |
| 1939 Naira Dr Dallas, TX | 3.0 | 2.0 | 1415 | $1,850 | $1.31 | 44d | 1 | 0.55mi |
| 10328 Chelmsford Dr Dallas, TX | 3.0 | 1.0 | 1061 | $1,300 | $1.23 | 44d | 1 | 0.56mi |
| 1937 Red Cloud Dr Dallas, TX | 3.0 | 2.0 | 1196 | $1,695 | $1.42 | 44d | 1 | 0.58mi |
| 10315 Limestone Dr Dallas, TX | 2.0 | 2.0 | 1068 | $1,450 | $1.36 | 44d | 1 | 0.63mi |
| 2722 N Saint Augustine Dr Dallas, TX | 4.0 | 2.0 | 1310 | $1,900 | $1.45 | 25d | 1 | 0.63mi |
| 9503 Olde Towne Row Dallas, TX | 2.0 | 2.5 | 1140 | $1,350 | $1.18 | 44d | 1 | 0.68mi |
| 10503 Leroy Ct Dallas, TX | 3.0 | 2.0 | 1253 | $1,941 | $1.55 | 8d | 1 | 0.69mi |
| 9666 Scyene Rd Dallas, TX | 1.0–2.0 | 1.0–2.0 | 753 | $1,286 | $1.71 | 0d | 20 | 0.70mi |
| 9467 Olde Towne Row Dallas, TX | 2.0 | 1.5 | 1110 | $975 | $0.88 | 44d | 1 | 0.72mi |
| 10206 Shayna Dr Dallas, TX | 3.0 | 2.0 | 1253 | $1,850 | $1.48 | 14d | 1 | 0.74mi |
| 9415 Bruton Rd Dallas, TX | 1.0–3.0 | 1.0–2.0 | 885 | $999 | $1.13 | 44d | 1 | 0.74mi |
| 9645 Limestone Dr Dallas, TX | 3.0 | 2.0 | 1178 | $2,000 | $1.70 | 44d | 1 | 0.81mi |
| 2198 Aspen Dr Dallas, TX | 2.0 | 1.5 | 1110 | $1,300 | $1.17 | 4d | 1 | 0.82mi |
| 2198 Aspen Dr Dallas, TX | 2.0 | 1.5 | 1110 | $1,300 | $1.17 | 0d | 1 | 0.82mi |
| 2194 Aspen Dr Dallas, TX | 2.0 | 1.5 | 1110 | $1,200 | $1.08 | 8d | 1 | 0.83mi |
| 9911 Crystal Valley Way Dallas, TX | 3.0 | 2.0 | 1192 | $1,750 | $1.47 | 25d | 1 | 0.85mi |
| 1705 Allentown Dr Dallas, TX | 3.0 | 2.0 | 1195 | $1,725 | $1.44 | 25d | 1 | 0.85mi |
| 2255 W Bruton Rd Mesquite, TX | 1.0–3.0 | 1.0–2.0 | 957 | $1,819 | $1.90 | 44d | 12 | 0.86mi |
| 3509 Apple Valley Way Dallas, TX | 3.0 | 2.5 | 1653 | $2,300 | $1.39 | 44d | 1 | 0.87mi |
| 303 Ridgefield Cir Mesquite, TX | 3.0 | 1.0 | 1021 | $2,095 | $2.05 | 25d | 1 | 0.88mi |
| 303 Ridgefield Cir Mesquite, TX | 3.0 | 1.0 | 1021 | $2,095 | $2.05 | 13d | 1 | 0.88mi |
Listing history 11 events
-
2025-08-23status Pending
-
2025-08-12price $150,000
-
2025-08-12status Active
-
2024-02-08status Pending
-
2024-01-20status Active
-
2024-01-12historical Active Option Contract
-
2023-12-19price $170,000
-
2023-12-06price $190,000
-
2023-11-28$195,000 Active
-
2002-01-16soldstatus
-
1990-12-03soldstatus
ⓘ Source: listings_history table (triggers on properties + properties_extension) + one-shot
backfill from property_details.listing_events for pre-trigger history.
Tax reassessment forecast TX · Resets to sale price
- Current annual tax
- $4,494 · $375/mo
- Projected year-2 tax
- $4,494 · $375/mo
- Expected delta
- $0/yr ($0/mo · 0.0%)
ⓘ Screening estimate from a state-policy table — verify with the county assessor before closing.
Climate risk First Street
- Flood 1/10 Low FEMA zone X (unshaded) · 0% chance over 30 yrs
- Wildfire 1/10 Low
- Heat 8/10 Severe 7 d/yr ≥110°F today · 25 d/yr by 30 yrs out
- Wind 6/10 Major 27% chance of damaging wind over 30 yrs
- Air quality 2/10 Low 1 unhealthy d/yr today · 2 by 30 yrs out
Nearby sold comps map
Loading sold comps map…
Walkable amenities ~0.75 mi
Loading nearby amenities…
Taxation est. · year 1
- Rental income
- $21,600
- − Mortgage interest
- −$8,402
- − Property taxes
- −$4,494
- − Insurance
- −$750
- − Repairs & maintenance
- −$1,728
- − Management
- −$1,728
- − Depreciation
- −$4,364
- Taxable income
- $134
- Est. tax owed @ 24.0%
- −$32
- After-tax cash flow
- $2,348/yr
For passive investors: Depreciation is non-cash, so a rental often shows a tax loss while cash-flowing — sheltering income. Rental losses are passive: they offset passive income freely, and up to $25,000/yr can offset ordinary (W-2) income if you actively participate and your MAGI is under $100k (phasing out to $0 by $150k); unused losses carry forward. On sale, claimed depreciation is recaptured at up to 25%, and gains may owe capital-gains tax (a 1031 exchange can defer both). Figures are a year-1 estimate at your 24.0% rate — not tax advice; consult a CPA.
Schools (NCES district)
- District
- Dallas ISD
- NCES district ID
- 4816230
- Math proficiency
- 31% ▼ -16.00%
- Reading proficiency
- 36% ▼ -4.00%
- Median HH income
- $42,881
- Composite
- 28.41/100
- National rank
- #6763
- State rank
- #559 of 826 in TX
Livability — Dallas
- Score
- 81/100
- State rank
- #24
- US rank
- #1380
Category grades
Schools grade is shown separately in the Schools card above.
Census & demographics
- Census place
- Dallas, TX
- County
- Dallas County · 2,612,404 people
- City population
- 1,168,437
- Metro
- Dallas-Fort Worth-Arlington, TX
- Population (ZIP)
- 58,319
- Household income
- $64,008
- Rent vs Own
- Severe rent burden
- 1679.0
Population outlook (Dallas County) Hauer SSP2
- Today (2025)
- 2,979,839 people
- By 2030
- 3,191,823 · +7.1%
- By 2040
- 3,619,611 · +21.5%
- By 2050
- 4,026,915 · +35.1%
- By 2075
- 4,957,073 · +66.4%
- By 2100
- 5,508,725 · +84.9%
Race, ethnicity, and origin ACS 2023
- Neighborhood character
- Majority Hispanic (62%)
- Race & ethnicity
- Hispanic / Latino 62% Two or more races 35% Black 28% White 8%
- Hispanic origin (detail)
- Mexican 56%
- Foreign-born
- 27% · Canada, Vietnam
- Languages at home
- 44% English-only · Spanish 55%
Political lean MEDSL · Dallas
- 2024 margin
- Strong D (+22.2) · D 60.2% · R 38.0% · Other 1.8%
- 2008→2024 swing
- +6.9pp toward D · 2008: 15.3pp · 2024: 22.2pp
- All cycles
- 2024: D+22.2 2020: D+31.6 2016: D+26.2 2012: D+15.4 2008: D+15.3
Not yet ingested
- Civics
- —
Market trends
- HPI YoY
- ▼ -148.56%
- Current HPI
- 332.3303
- Rent YoY
- ▼ -0.36%
- Metro
- Dallas-Fort Worth-Arlington, TX
- State GDP YoY
- ▲ 3.95%
- F500 in state
- 110
Industry mix (Fortune 500 HQ in TX)
| Industry | F500 HQs | Revenue |
|---|---|---|
| Energy | 16 | $1,198B |
|
||
| Technology | 5 | $198B |
|
||
| Engineering / Construction | 4 | $72B |
|
||
| Energy Services | 3 | $60B |
|
||
| Utilities | 3 | $41B |
|
||
| Healthcare | 2 | $330B |
|
||
Price history
-23.1% since first listed11 events — show timeline
- 2025-08-23 Pending — NTREIS
- 2025-08-12 Price Changed $150,000 NTREIS
- 2025-08-12 Relisted — NTREIS
- 2024-02-08 Pending — NTREIS
- 2024-01-20 Relisted — NTREIS
- 2024-01-12 Contingent — NTREIS
- 2023-12-19 Price Changed $170,000 NTREIS
- 2023-12-06 Price Changed $190,000 NTREIS
- 2023-11-28 Listed $195,000 NTREIS
- 2002-01-16 Sold (Public Records) — Public Records
- 1990-12-03 Sold (Public Records) — Public Records
Property tax history
+7.8%/yrLatest (2025): $4,494 · -0.4% YoY. Source: county tax records.
Cash-flow waterfall
monthlySold comps — $/sqft
last 12 mo · ≤1 miLoading sold comps…