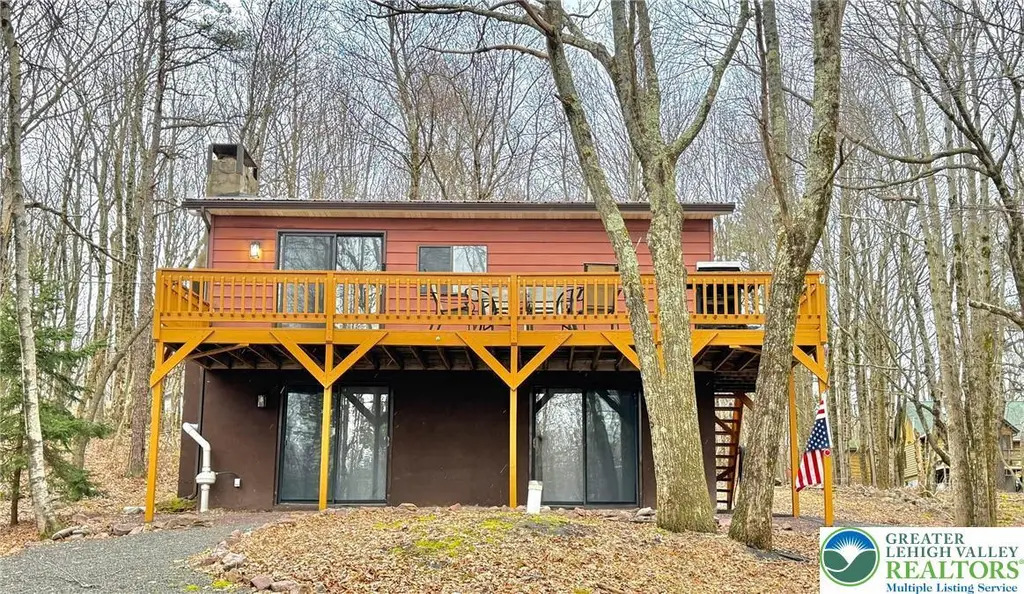
176 Birch Dr · Tunkhannock, PA
Flood risk 1/10 · Minimal
- FEMA flood zone
- X (unshaded)
- Chance of flooding over 30 yrs
- 0.0%
- Est. flood insurance / yr
- $473 – $860
Fire risk 4/10 · Minor
- Est. fire insurance / yr
- $511 – $949
Heat risk 2/10 · Minimal
- Hot days now (above 89°F)
- 7 days/yr
- Hot days in 30 yrs
- 16 days/yr
Wind risk 4/10 · Minor
- Chance of severe wind over 30 yrs
- 7.0%
Air-quality risk 3/10 · Minor
- Unhealthy air days now
- 1 days/yr
- Unhealthy air days in 30 yrs
- 4 days/yr
Risk factors via First Street. Map © Google.
Why this score? — see what drove the F grade
The composite is a weighted blend of 9 inputs, each scored 0–100. Each bar is that input's sub-score; the figure is the points it added to the 100-point composite (weight × sub-score).
- ARV discount +7.1/15.0
- Cash flow +6.2/30.0
- Appreciation +5.2/10.0
- Schools +4.0/10.0
- Livability +3.9/5.0
- Rent growth +2.5/5.0
- Condition / age +2.5/5.0
- 1% rule +1.2/10.0
- DSCR +0.5/10.0
$299,900
🖨 Deal sheet (PDF) 📄 Offer letter ✓ Due diligence
Listing remarks MLS
3-bedroom, 2-bathroom home nestled in the peaceful woodlands of the Poconos. Perfect as a primary residence or vacation retreat, this property offers the ideal blend of comfort, nature, and privacy. This home features a metal roof and an additional lot just under a half acre giving you approx 1 acre! Enjoy cozy living spaces surrounded by towering trees. The home features an open-concept layout. Located in a relaxed wooded community, residents can take advantage of nearby outdoor activities like hiking, fishing, skiing, and lake access, all while remaining close to local shops, restaurants, and major highways for easy access year-round.
Key facts
- Wooded community
- Additional lot
- Lake access
Tags
Neighborhood map
What this means for you Summary
Snapshot
- This is a 3-bed/2.0-bath single-family listed at $300k.
Deal economics
- At list price, monthly cash flow is $-545 ($-7k/yr) — negative.
- To cash-flow at today's rent, offer at most $204k (32.1% below list).
- To meet the 1% rule (rent ≥ 1% of price), the offer needs to be $186k (38.0% below list).
- Recommended offer: $186k (38.0% below list) — sets the bar for 1% rule.
Location & tenants
- Location reads 77/100 on livability (#371 in PA, #3,219 nationally) — a middle-class / working-renter tenant base. Strengths: cost of living A+, housing A, health & safety A-; Watch: employment D+, amenities F, commute F.
- Pocono Mountain SD (rural): math 37% / reading 55% proficiency, ranked #245 of 539 in PA (top 46%) — families likely to look elsewhere, expect single-tenant / working-renter base with shorter leases.
- Market conditions: 90 active listings in the ZIP; 278 units permitted in Monroe County in 2024 (52 in 5+ unit buildings).
Forward outlook
- In year one you build about $3k of equity ($2k loan paydown + $1k appreciation (0.5% local appreciation)).
- Monroe County population projected at -11% by 2050 — secular population decline; favor cash flow + early exit over multi-decade hold.
- By year 8, paydown + projected appreciation supports a ~$30k cash-out refi (75% LTV) — recoverable capital for the next deal without selling this one.
Negotiation context
- It's been on market 116 days — a 9% lower offer ($273k) is reasonable based on typical stale-listing flexibility.
- 6 sale attempts since 10y ago with the ask held roughly flat each time — persistent listings suggest the price (not the market) is what's stuck; bring a comps-based counter.
- Current owner paid $250k; 20% above their basis — modest negotiation headroom, anchor on the comps not their cost.
Questions for the listing agent
- What do current leases actually rent for vs. the listed asking? Can we see a recent rent roll and the last 12 months of T-12 income?
- It's been on market 116 days. Have you received any prior offers? Is the seller open to a 38% concession, seller financing, or rate buy-down credit?
- Built in 1978 — when were the roof, HVAC, electrical panel, plumbing, and water heater last replaced?
- What does the HOA fee cover, when was the last increase, and are there any pending special assessments or reserve-fund shortfalls?
- Why hasn't it sold? Are there any deal-killer items the seller is aware of (foundation, flood, title, zoning, code violations)?
- Is there a deadline driving the sale (1031 exchange, divorce, estate, relocation)? That informs how much negotiation room exists.
- Schools are B-rated — typically a magnet for longer-tenancy family renters. What's the average tenant stay here, and is there a school-zone premium baked into asking?
- The area grade is low — what's the realistic commute time and amenity access for the typical tenant pool here? Any planned neighborhood developments (good or bad) we should know about?
- What's the average days-on-market for RENTAL listings here right now (not sales)? A rising rental-DOM trend means longer vacancies and softer asking-rent achievability than the comps imply.
- What's the recent tenant-quality profile in this submarket — average credit score on applications, eviction rate, late-payment / NSF rate, and stable-employment percentage? A property-management company in the area should have these aggregated.
- How much new for-sale + rental construction is in the pipeline within 1–3 miles? Heavy new supply typically softens prices + rents 12–24 months out; constrained supply supports both.
Investment metrics
- 1% rule
- 0.62% ✗
- Cap rate
- 4.11%
- Cash-on-cash
- -7.78%
- DSCR
- 0.65
- GRM
- 13.4
CMA / ARV
- ARV (median comp)
- $297,134
- List price
- $299,900
- Delta
- 0.93%
- Verdict
- FAIR
- Comps
- 20 within 1.0 mi
Show comp detail 3 sales within ~0.75 mi
| Address | Dist | Beds/Ba | Sqft | Sold | Price | $/sf | Match |
|---|---|---|---|---|---|---|---|
| 185 Birch | 0.05mi | 2/1.0 (-1) | 700 (+4%) | 16mo | $152,000 | $217 | 68 |
| 199 Forest Hill Dr | 0.47mi | 2/1.0 (-1) | 720 (+7%) | 11mo | $231,000 | $321 | 48 |
| 358 Brier Crest Rd | 0.66mi | 2/1.0 (-1) | 680 (+1%) | 18mo | $213,800 | $314 | 43 |
Match score weights: distance 35% · size 25% · config 20% · recency 20%. Top-matched comps best support the ARV.
Projected returns pro-forma
0.47% appreciation · 3.0% rent growth · sell at horizon
- IRR
- -9.1%
- Equity multiple
- 0.56×
- Total profit
- $-36,807
- Equity at exit
- $94,165
- IRR
- -3.1%
- Equity multiple
- 0.65×
- Total profit
- $-29,726
- Equity at exit
- $119,011
Cash invested: $83,972 (down + closing). Projections, not guarantees.
Landlord ↔ Tenant lean methodology
- Overall (STATE)
- 62 Landlord-Friendly
- State Pennsylvania
- 62 Landlord-Friendly · EVEN
- County
- — inherits STATE
- City
- — inherits STATE
ZIP-level market 18610
- Home prices YoY
- 0.3%
- Active inventory
- 90
- Price-to-rent
- 13.4×
Monthly cashflow live
- Estimated rent
- $1,859 medium interval (Pro) →
- Mortgage (P&I)
- −$1,573
- Tax from tax record
- −$222 /mo · $2,660/yr
- Insurance
- −$125
- HOA
- −$94
- Vacancy / Maint / Mgmt
- −$390
- Net cashflow
- $-545
Break-even live
Sensitivity live
| Price | -10% $-375 | -5% $-460 | +0% $-545 | +5% $-629 | +10% $-714 |
|---|---|---|---|---|---|
| Rent | -10% $-691 | -5% $-618 | +0% $-545 | +5% $-471 | +10% $-398 |
| Rate | -1.0pp $-394 | -0.5pp $-468 | base $-545 | +0.5pp $-622 | +1.0pp $-701 |
UW: 25.0% down · 7.5% · 30yr · 1.5% tax · 5.0% vac · 8.0% maint · 8.0% mgmt
Financing live
Cash to close
- Down payment
- $74,975
- Closing costs
- $8,997
- Reserves months
- —
- Total cash needed
- —
Loan-product check · same deal, 3 products live
Conventional
25% down · 7.5% · 30yr
- Down + closing
- —
- Monthly P&I
- —
- Monthly cashflow
- —
- DSCR
- —
- Eligible?
- —
Personal DTI + credit; lowest rate.
DSCR
20% down · 8.5% · 30yr
- Down + closing
- —
- Monthly P&I
- —
- Monthly cashflow
- —
- DSCR
- —
- Eligible?
- —
No personal income docs; deal must DSCR.
Hard money
10% down · 12.0% · 12mo
- Down + closing
- —
- Monthly P&I
- —
- Monthly cashflow
- —
- DSCR
- —
- Eligible?
- —
Short-term bridge; refi at stabilization.
HOA detail
- Monthly dues
- $94 · $1,128/yr
Listing history 19 events
-
2026-06-02days on market $299,900 Active 116 DOM
-
2026-06-01days on market $299,900 Active 115 DOM
-
2026-05-31days on market $299,900 Active 114 DOM
-
2026-05-30days on market $299,900 Active 113 DOM
-
2026-03-23price $299,900 644-char remark
Show marketing remark (644 chars)
3-bedroom, 2-bathroom home nestled in the peaceful woodlands of the Poconos. Perfect as a primary residence or vacation retreat, this property offers the ideal blend of comfort, nature, and privacy. This home features a metal roof and an additional lot just under a half acre giving you approx 1 acre! Enjoy cozy living spaces surrounded by towering trees. The home features an open-concept layout. Located in a relaxed wooded community, residents can take advantage of nearby outdoor activities like hiking, fishing, skiing, and lake access, all while remaining close to local shops, restaurants, and major highways for easy access year-round.
-
2026-01-26$299,000 Active 644-char remark
Show marketing remark (651 chars)
3-bedroom, 2-bathroom home nestled in the peaceful woodlands of the Poconos. Perfect as a primary residence or vacation retreat, this property offers the ideal blend of comfort, nature, and privacy. This home features a metal roof and an additional lot just under a half acre giving you approximately 1 acre! Enjoy cozy living spaces surrounded by towering trees. The home features an open-concept layout. Located in a relaxed wooded community, residents can take advantage of nearby outdoor activities like hiking, fishing, skiing, and lake access, all while remaining close to local shops, restaurants, and major highways for easy access year-round.
-
2026-01-26$299,900 Active 651-char remark
Show marketing remark (651 chars)
3-bedroom, 2-bathroom home nestled in the peaceful woodlands of the Poconos. Perfect as a primary residence or vacation retreat, this property offers the ideal blend of comfort, nature, and privacy. This home features a metal roof and an additional lot just under a half acre giving you approximately 1 acre! Enjoy cozy living spaces surrounded by towering trees. The home features an open-concept layout. Located in a relaxed wooded community, residents can take advantage of nearby outdoor activities like hiking, fishing, skiing, and lake access, all while remaining close to local shops, restaurants, and major highways for easy access year-round.
-
2022-08-04soldstatus $249,900
-
2022-07-29soldstatus $249,900
-
2022-05-23$249,900
-
2017-07-08historical
-
2017-06-09soldstatus $89,500
-
2017-06-07soldstatus $89,500 Sold
-
2017-06-07soldstatus $89,500
-
2017-03-15$115,900 Active
-
2017-03-10$99,900
-
2017-02-08soldstatus $49,900
-
2017-02-03soldstatus $49,900
-
2016-11-23$49,900
ⓘ Source: listings_history table (triggers on properties + properties_extension) + one-shot
backfill from property_details.listing_events for pre-trigger history.
Tax reassessment forecast PA · Partial reset (capped growth)
- Current annual tax
- $2,660 · $222/mo
- Projected year-2 tax
- $3,699 · $308/mo
- Expected delta
- +$1,039/yr (+$87/mo · 39.1%)
ⓘ Screening estimate from a state-policy table — verify with the county assessor before closing.
Climate risk First Street
- Flood 1/10 Low FEMA zone X (unshaded) · 0% chance over 30 yrs
- Wildfire 4/10 Moderate
- Heat 2/10 Low 7 d/yr ≥89°F today · 16 d/yr by 30 yrs out
- Wind 4/10 Moderate 7% chance of damaging wind over 30 yrs
- Air quality 3/10 Moderate 1 unhealthy d/yr today · 4 by 30 yrs out
Nearby sold comps map
Loading sold comps map…
Walkable amenities ~0.75 mi
Loading nearby amenities…
Taxation est. · year 1
- Rental income
- $22,310
- − Mortgage interest
- −$16,799
- − Property taxes
- −$2,660
- − Insurance
- −$1,500
- − Repairs & maintenance
- −$1,785
- − Management
- −$1,785
- − HOA
- −$1,128
- − Depreciation
- −$8,724
- Taxable loss
- −$12,070
- Est. tax savings @ 24.0%
- +$2,897
- After-tax cash flow
- $-3,638/yr
For passive investors: Depreciation is non-cash, so a rental often shows a tax loss while cash-flowing — sheltering income. Rental losses are passive: they offset passive income freely, and up to $25,000/yr can offset ordinary (W-2) income if you actively participate and your MAGI is under $100k (phasing out to $0 by $150k); unused losses carry forward. On sale, claimed depreciation is recaptured at up to 25%, and gains may owe capital-gains tax (a 1031 exchange can defer both). Figures are a year-1 estimate at your 24.0% rate — not tax advice; consult a CPA.
Schools (NCES district)
- District
- Pocono Mountain SD
- NCES district ID
- 4219500
- Math proficiency
- 37% ▼ -5.00%
- Reading proficiency
- 55% ▲ 1.00%
- Median HH income
- $55,317
- Composite
- 39.91/100
- National rank
- #3856
- State rank
- #245 of 539 in PA
Livability — Tunkhannock
- Score
- 77/100
- State rank
- #371
- US rank
- #3219
Category grades
Schools grade is shown separately in the Schools card above.
Census & demographics
- Population (ZIP)
- 4,373
Population outlook (Monroe County) Hauer SSP2
- Today (2025)
- 164,099 people
- By 2030
- 161,412 · -1.6%
- By 2040
- 154,616 · -5.8%
- By 2050
- 146,710 · -10.6%
- By 2075
- 140,830 · -14.2%
- By 2100
- 138,472 · -15.6%
Race, ethnicity, and origin ACS 2023
- Neighborhood character
- Highly diverse neighborhood (Simpson 0.73)
- Race & ethnicity
- White 46% Hispanic / Latino 17% Black 15% Two or more races 10% Asian 7%
- Hispanic origin (detail)
- Puerto Rican 13%
- Common ancestry
- Romanian 6% Subsaharan African 2% Iranian 1%
- Foreign-born
- 9% · Canada
- Languages at home
- 85% English-only · Spanish 9% Tagalog/Filipino 3% Russian/Polish/Slavic 2%
Political lean MEDSL · Monroe
- 2024 margin
- Toss-up / Even · D 49.1% · R 49.9%
- 2008→2024 swing
- -17.1pp toward R · 2008: 16.3pp · 2024: -0.8pp
- All cycles
- 2024: R+0.8 2020: D+6.4 2016: D+0.3 2012: D+14.0 2008: D+16.3
Not yet ingested
- Civics
- —
Market trends
- HPI YoY
- ▲ 0.47%
- Current HPI
- 181.9087
- Rent YoY
- —
- Metro
- —
- State GDP YoY
- ▲ 1.68%
- F500 in state
- 34
Industry mix (Fortune 500 HQ in PA)
| Industry | F500 HQs | Revenue |
|---|---|---|
| Healthcare | 2 | $309B |
|
||
| Insurance | 2 | $27B |
|
||
| Telecommunications / Media | 1 | $124B |
|
||
| Industrial Distribution | 1 | $22B |
|
||
| Financial Services | 1 | $20B |
|
||
| Chemicals / Materials | 1 | $18B |
|
||
Price history
+501.0% since first listed15 events — show timeline
- 2026-03-23 Price Changed $299,900 GLVRMLS
- 2026-01-26 Listed $299,000 GLVRMLS
- 2026-01-26 Listed $299,900 PMAR
- 2022-08-04 Sold (Public Records) $249,900 Public Records
- 2022-07-29 Sold (MLS) $249,900 PMAR
- 2022-05-23 Listed $249,900 PMAR
- 2017-07-08 Listing Removed — GLVRMLS
- 2017-06-09 Sold (Public Records) $89,500 Public Records
- 2017-06-07 Sold (MLS) $89,500 PMAR
- 2017-06-07 Sold (MLS) $89,500 GLVRMLS
- 2017-03-15 Listed $115,900 GLVRMLS
- 2017-03-10 Listed $99,900 PMAR
- 2017-02-08 Sold (Public Records) $49,900 Public Records
- 2017-02-03 Sold (MLS) $49,900 PMAR
- 2016-11-23 Listed $49,900 PMAR
Property tax history
+2.2%/yrLatest (2026): $2,660 · +3.4% YoY. Source: county tax records.
Cash-flow waterfall
monthlySold comps — $/sqft
last 12 mo · ≤1 miLoading sold comps…