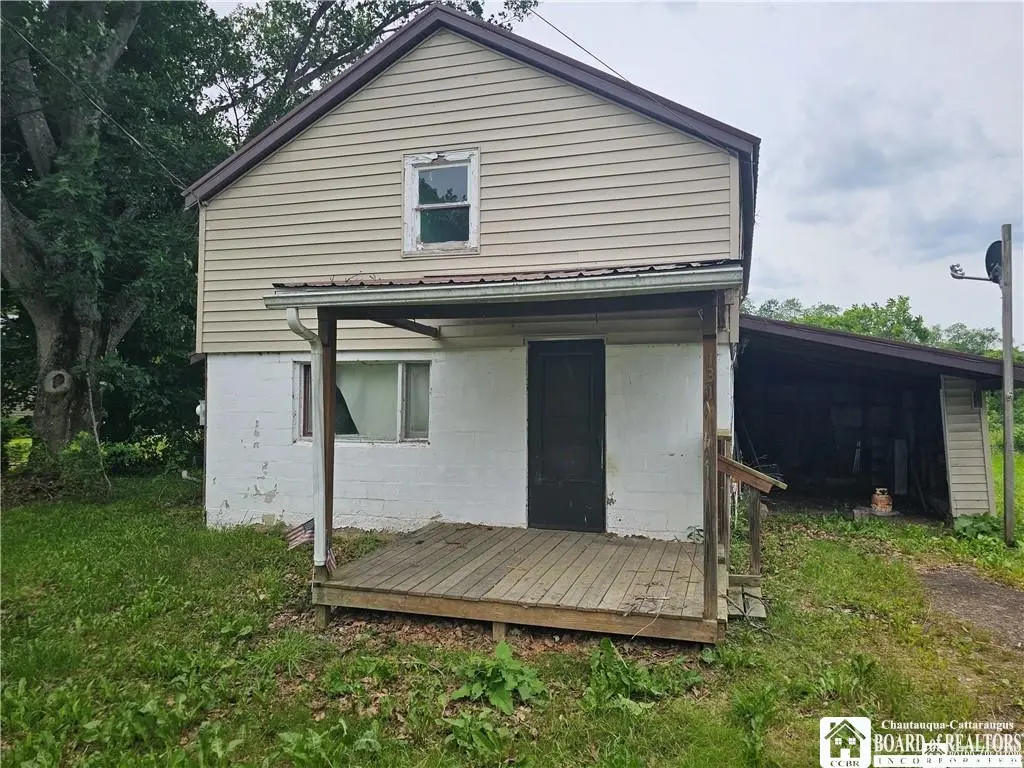
131 S Main St · Belfast, NY
Flood risk 6/10 · Moderate
- FEMA flood zone
- A
- Chance of flooding over 30 yrs
- 0.68%
- Est. flood insurance / yr
- $946 – $6,584
Fire risk 1/10 · Minimal
- Est. fire insurance / yr
- $691 – $1,283
Heat risk 2/10 · Minimal
- Hot days now (above 91°F)
- 7 days/yr
- Hot days in 30 yrs
- 17 days/yr
Wind risk 1/10 · Minimal
- Chance of severe wind over 30 yrs
- —
Air-quality risk 1/10 · Minimal
- Unhealthy air days now
- 0 days/yr
- Unhealthy air days in 30 yrs
- 0 days/yr
Risk factors via First Street. Map © Google.
Why this score? — see what drove the C- grade
The composite is a weighted blend of 9 inputs, each scored 0–100. Each bar is that input's sub-score; the figure is the points it added to the 100-point composite (weight × sub-score).
- Cash flow +15.0/30.0
- Appreciation +8.1/10.0
- ARV discount +7.5/15.0
- 1% rule +5.0/10.0
- DSCR +5.0/10.0
- Schools +4.0/10.0
- Livability +3.1/5.0
- Rent growth +2.5/5.0
- Condition / age +2.5/5.0
$21,900
🖨 Deal sheet 📄 Offer letter ✓ Due diligence
Listing remarks MLS
Opportunity awaits with this spacious 4-bedroom, 1-bath home located in the heart of Belfast, NY. Featuring a classic covered front porch perfect for relaxing, and a durable metal roof offering long-term protection, this property offers solid bones and endless potential. Inside, you'll find generous room sizes and a traditional layout ready for your vision and updates. Whether you're an investor, flipper, or ambitious homeowner looking for your next project, this is your chance to build equity from the ground up. The home will require repairs and is being sold as-is, making it ideal for those with a creative eye and renovation skills. With its affordable price point, this fixer-upper is a rare find in today’s market—don’t miss your chance to restore and reimagine this diamond in the rough.
Key facts
- Covered front porch
- Metal roof
- Traditional layout
Tags
Neighborhood map
What this means for you Summary
Snapshot
- This is a 4-bed/1.5-bath single-family listed at $22k.
Deal economics
- At list price, monthly cash flow is $396 ($5k/yr) — positive.
- The deal already cash-flows at list — no discount required.
- Meets the 1% rule at list price ($1k rent vs $22k).
- Recommended offer: $19k (12.0% below list) — sets the bar for market timing.
Location & tenants
- Location reads 61/100 on livability (#927 in NY) — a middle-class / working-renter tenant base. Strengths: cost of living A+, housing A+; Watch: employment C-, schools D+, crime F.
- Belfast Central School District (rural): math 50% / reading 40% proficiency, ranked #577 of 755 in NY (top 76%) — families likely to look elsewhere, expect single-tenant / working-renter base with shorter leases.
- Market conditions: 23 active listings in the ZIP; 87 units permitted in Allegany County in 2024 (0 in 5+ unit buildings).
Forward outlook
- In year one you build about $1k of equity ($151 loan paydown + $1k appreciation (6.1% local appreciation)).
- Allegany County population projected at -26% by 2050 — secular population decline; favor cash flow + early exit over multi-decade hold.
- At projected returns (6.1% appreciation + 3.0% rent growth), your $6k cash investment doubles in ~1 year — after that, you're playing with house money.
Negotiation context
- It's been on market 135 days — a 12% lower offer ($19k) is reasonable based on typical stale-listing flexibility.
- 2 sale attempts with the ask held roughly flat each time — persistent listings suggest the price (not the market) is what's stuck; bring a comps-based counter.
Risks & watch-outs
- Watch-outs: flood insurance adds $314/mo; built in 1930 — expect roof / HVAC / electrical / plumbing capex.
- Climate carrying-cost: in FEMA flood zone A (mandatory federal flood insurance) — expect insurance premiums to compound above CPI over the hold.
Questions for the listing agent
- It's been on market 135 days. Have you received any prior offers? Is the seller open to a 12% concession, seller financing, or rate buy-down credit?
- Built in 1930 — when were the roof, HVAC, electrical panel, plumbing, and water heater last replaced?
- What's the actual annual flood-insurance premium (NFIP or private), and is the property in a SFHA with mandatory coverage?
- Why hasn't it sold? Are there any deal-killer items the seller is aware of (foundation, flood, title, zoning, code violations)?
- Is there a deadline driving the sale (1031 exchange, divorce, estate, relocation)? That informs how much negotiation room exists.
- Schools are D-rated, which usually means shorter tenancies and higher turnover. Who's the typical renter profile here, and what's been the actual vacancy rate?
- Crime grade is F in this area — have there been break-ins, vandalism, or insurance claims at this property in the last 3 years? What carrier currently insures it and at what premium?
- What's the average days-on-market for RENTAL listings here right now (not sales)? A rising rental-DOM trend means longer vacancies and softer asking-rent achievability than the comps imply.
- What's the recent tenant-quality profile in this submarket — average credit score on applications, eviction rate, late-payment / NSF rate, and stable-employment percentage? A property-management company in the area should have these aggregated.
- How much new for-sale + rental construction is in the pipeline within 1–3 miles? Heavy new supply typically softens prices + rents 12–24 months out; constrained supply supports both.
Investment metrics
- 1% rule
- 4.98% ✓
- Cap rate
- 45.17%
- Cash-on-cash
- 138.85%
- DSCR
- 7.18
- GRM
- 1.7
CMA / ARV
- ARV (median comp)
- $83,083
- List price
- $21,900
- Delta
- -73.64%
- Verdict
- UNDERPRICED
- Comps
- 4 within 1.0 mi
Show comp detail 1 sale within ~0.75 mi
| Address | Dist | Beds/Ba | Sqft | Sold | Price | $/sf | Match |
|---|---|---|---|---|---|---|---|
| 32 Merton Ave | 0.69mi | 3/1.0 (-1) | 1,144 (+12%) | 10mo | $42,500 | $37 | 32 |
Match score weights: distance 35% · size 25% · config 20% · recency 20%. Top-matched comps best support the ARV.
Projected returns pro-forma
6.12% appreciation · 3.0% rent growth · sell at horizon
- IRR
- 84.7%
- Equity multiple
- 6.20×
- Total profit
- $31,894
- Equity at exit
- $13,930
- IRR
- 82.2%
- Equity multiple
- 13.14×
- Total profit
- $74,453
- Equity at exit
- $25,403
Cash invested: $6,132 (down + closing). Projections, not guarantees.
Landlord ↔ Tenant lean methodology
- Overall (STATE)
- 15 Strongly Tenant-Friendly
- State New York
- 15 Strongly Tenant-Friendly · D+10
- County
- — inherits STATE
- City
- — inherits STATE
ZIP-level market 14711
- Home prices YoY
- 2.2%
- Active inventory
- 23
- Price-to-rent
- 1.7×
Monthly cashflow live
- Estimated rent
- $1,090 medium interval (Pro) →
- Mortgage (P&I)
- −$115
- Tax est. 1.5%
- −$27 /mo · $328/yr
- Insurance
- −$9
- Flood insurance flood zone
- −$314 /mo · $3,765/yr
- HOA
- −$0
- Vacancy / Maint / Mgmt
- −$229
- Net cashflow
- $396
Break-even live
UW: 25.0% down · 7.5% · 30yr · 1.5% tax · 5.0% vac · 8.0% maint · 8.0% mgmt
Financing live
Cash to close
- Down payment
- $5,475
- Closing costs
- $657
- Reserves months
- —
- Total cash needed
- —
Loan-product check · same deal, 3 products live
Conventional
25% down · 7.5% · 30yr
- Down + closing
- —
- Monthly P&I
- —
- Monthly cashflow
- —
- DSCR
- —
- Eligible?
- —
Personal DTI + credit; lowest rate.
DSCR
20% down · 8.5% · 30yr
- Down + closing
- —
- Monthly P&I
- —
- Monthly cashflow
- —
- DSCR
- —
- Eligible?
- —
No personal income docs; deal must DSCR.
Hard money
10% down · 12.0% · 12mo
- Down + closing
- —
- Monthly P&I
- —
- Monthly cashflow
- —
- DSCR
- —
- Eligible?
- —
Short-term bridge; refi at stabilization.
Listing history 17 events
-
2026-06-18days on market $21,900 Active 135 DOM
-
2026-06-17days on market $21,900 Active 134 DOM
-
2026-06-16days on market $21,900 Active 133 DOM
-
2026-06-15days on market $21,900 Active 132 DOM
-
2026-06-13days on market $21,900 Active 130 DOM
-
2026-06-12days on market $21,900 Active 129 DOM
-
2026-06-09days on market $21,900 Active 126 DOM
-
2026-06-08days on market $21,900 Active 125 DOM
-
2026-06-07days on market $21,900 Active 124 DOM
-
2026-06-07days on market $21,900 Active 123 DOM
-
2026-06-04days on market $21,900 Active 120 DOM
-
2026-06-02days on market $21,900 Active 119 DOM
-
2026-06-01days on market $21,900 Active 118 DOM
-
2026-05-31days on market $21,900 Active 117 DOM
-
2026-02-03$21,900 Active 818-char remark
Show marketing remark (818 chars)
Opportunity awaits with this spacious 4-bedroom, 1-bath home located in the heart of Belfast, NY. Featuring a classic covered front porch perfect for relaxing, and a durable metal roof offering long-term protection, this property offers solid bones and endless potential. Inside, you'll find generous room sizes and a traditional layout ready for your vision and updates. Whether you're an investor, flipper, or ambitious homeowner looking for your next project, this is your chance to build equity from the ground up. The home will require repairs and is being sold as-is, making it ideal for those with a creative eye and renovation skills. With its affordable price point, this fixer-upper is a rare find in today’s market—don’t miss your chance to restore and reimagine this diamond in the rough.
-
2025-12-23historical
-
2025-06-23$21,999 Active
ⓘ Source: listings_history table (triggers on properties + properties_extension) + one-shot
backfill from property_details.listing_events for pre-trigger history.
Climate risk First Street
- Flood 6/10 Major FEMA zone A · 68% chance over 30 yrs
- Wildfire 1/10 Low
- Heat 2/10 Low 7 d/yr ≥91°F today · 17 d/yr by 30 yrs out
- Wind 1/10 Low
- Air quality 1/10 Low 0 unhealthy d/yr today · 0 by 30 yrs out
Nearby sold comps map
Loading sold comps map…
Walkable amenities ~0.75 mi
Loading nearby amenities…
Taxation est. · year 1
- Rental income
- $13,077
- − Mortgage interest
- −$1,227
- − Property taxes
- −$328
- − Insurance
- −$3,874
- − Repairs & maintenance
- −$1,046
- − Management
- −$1,046
- − Depreciation
- −$637
- Taxable income
- $4,918
- Est. tax owed @ 24.0%
- −$1,180
- After-tax cash flow
- $3,569/yr
For passive investors: Depreciation is non-cash, so a rental often shows a tax loss while cash-flowing — sheltering income. Rental losses are passive: they offset passive income freely, and up to $25,000/yr can offset ordinary (W-2) income if you actively participate and your MAGI is under $100k (phasing out to $0 by $150k); unused losses carry forward. On sale, claimed depreciation is recaptured at up to 25%, and gains may owe capital-gains tax (a 1031 exchange can defer both). Figures are a year-1 estimate at your 24.0% rate — not tax advice; consult a CPA.
Schools (NCES district)
- District
- Belfast Central School District
- NCES district ID
- 3604350
- Math proficiency
- 50% ▲ 10.00%
- Reading proficiency
- 40% ▬ 0.00%
- Median HH income
- $42,217
- Composite
- 40.14/100
- National rank
- #7847
- State rank
- #577 of 755 in NY
Livability — Belfast
- Score
- 61/100
- State rank
- #927
- US rank
- #18080
Category grades
Schools grade is shown separately in the Schools card above.
Census & demographics
- Census place
- Belfast, NY
- Population (ZIP)
- 1,861
Population outlook (Allegany County) Hauer SSP2
- Today (2025)
- 45,362 people
- By 2030
- 43,078 · -5.0%
- By 2040
- 38,031 · -16.2%
- By 2050
- 33,634 · -25.9%
- By 2075
- 25,285 · -44.3%
- By 2100
- 18,902 · -58.3%
Race, ethnicity, and origin ACS 2023
- Neighborhood character
- Predominantly White (98%)
- Race & ethnicity
- White 98% Two or more races 2%
- Common ancestry
- Romanian 5% Lithuanian 3% Iranian 3%
- Foreign-born
- 0% · Canada
- Languages at home
- 91% English-only · German/W. Germanic 9%
Political lean MEDSL · Allegany
- 2024 margin
- Solid R (+43.2) · D 28.4% · R 71.6%
- 2008→2024 swing
- -21.5pp toward R · 2008: -21.7pp · 2024: -43.2pp
- All cycles
- 2024: R+43.2 2020: R+38.9 2016: R+42.3 2012: R+25.3 2008: R+21.7
Not yet ingested
- Civics
- —
Market trends
- HPI YoY
- ▲ 6.12%
- Current HPI
- 286.2504
- Rent YoY
- —
- Metro
- —
- State GDP YoY
- ▲ 2.60%
- F500 in state
- 92
Industry mix (Fortune 500 HQ in NY)
| Industry | F500 HQs | Revenue |
|---|---|---|
| Financial Services | 10 | $950B |
|
||
| Consumer Goods | 9 | $162B |
|
||
| Insurance | 4 | $225B |
|
||
| Telecommunications | 2 | $144B |
|
||
| Pharmaceuticals | 2 | $112B |
|
||
| Media / Entertainment | 2 | $69B |
|
||
Price history
-0.5% since first listed3 events — show timeline
- 2026-02-03 Listed $21,900 UNYREIS
- 2025-12-23 Listing Removed — UNYREIS
- 2025-06-23 Listed $21,999 UNYREIS
Property tax history
+1.3%/yrLatest (2025): $1,635 · +0.6% YoY. Source: county tax records.
Cash-flow waterfall
monthlySold comps — $/sqft
last 12 mo · ≤1 miLoading sold comps…