 Triplex
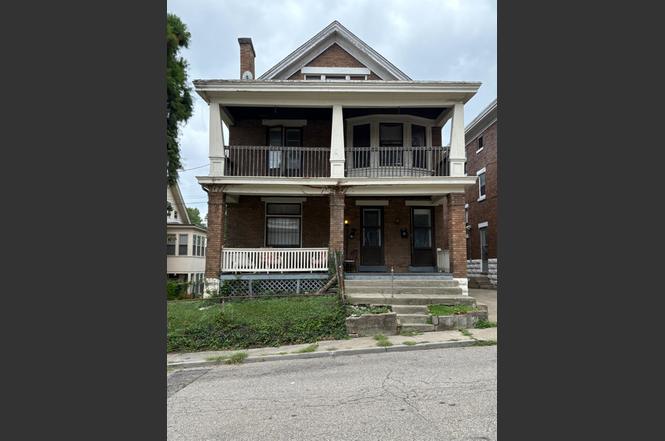
567 Stewart Pl · Cincinnati, OH
Flood risk 1/10 · Minimal
- FEMA flood zone
- X (unshaded)
- Chance of flooding over 30 yrs
- 0.0%
- Est. flood insurance / yr
- $473 – $860
Fire risk 1/10 · Minimal
- Est. fire insurance / yr
- $713 – $1,323
Heat risk 5/10 · Moderate
- Hot days now (above 103°F)
- 7 days/yr
- Hot days in 30 yrs
- 19 days/yr
Wind risk 2/10 · Minimal
- Chance of severe wind over 30 yrs
- 1.0%
Air-quality risk 3/10 · Minor
- Unhealthy air days now
- 2 days/yr
- Unhealthy air days in 30 yrs
- 3 days/yr
Risk factors via First Street. Map © Google.
Why this score? — see what drove the B+ grade
The composite is a weighted blend of 9 inputs, each scored 0–100. Each bar is that input's sub-score; the figure is the points it added to the 100-point composite (weight × sub-score).
- Cash flow +30.0/30.0
- ARV discount +12.6/15.0
- 1% rule +10.0/10.0
- DSCR +10.0/10.0
- Livability +4.0/5.0
- Rent growth +3.9/5.0
- Schools +2.5/10.0
- Condition / age +2.5/5.0
- Appreciation +0.0/10.0
$223,000
🖨 Deal sheet 📄 Offer letter ✓ Due diligence
Multi-family units
County records classify this as Multi-Family (2-4 Unit). Listing-text estimate: 3 units. confirmed
Listing remarks MLS
Triplex that is income ready for your TLC. On and off street parking. Long term leases, centrally located,5 mile radius from 2 colleges, highway close, Saturday Only Showings.All Unit occupied.
Key facts
- Highway close
- Long term leases
- Centrally located
Tags
Property features AI
Finance
- Other: Zoning: Residential
- Financial info: Unit rents noted: 1-bedroom rent listed at $700 (market listing shows Unit 1 rent $1,200), 2-bedroom rent listed at $1,100 (market listings show Unit 2 $1,500 and Unit 3 $700); Total buildings: 1
Exterior
- Parking: On-street parking; Driveway parking (2 open spaces)
- Utilities: Public water; Public sewer; Natural gas; Separate gas/electric meters (yes); Water paid by owner; heat paid by tenants
- Home design: Triplex; Two levels
- Construction: Brick construction; Shingle roof; Poured foundation
- Exterior features: Double-hung windows; Other window types
Interior
- Bedrooms: Unit 1: 1 bedroom; Unit 2: 2 bedrooms; Unit 3: 2 bedrooms; Total units: 3 (one 1-bedroom unit, two 2-bedroom units)
- Bathrooms: Each unit has 1 full bathroom
- Heating & cooling: Heat pump heating; Window air conditioning units
- Interior features: Full basement
Neighborhood map
What this means for you Summary
Snapshot
- This is a 3 × 3-bed/1.5-bath units multifamily listed at $223k.
Deal economics
- At list price, monthly cash flow is $2k ($21k/yr) — positive. Per door: $594/mo.
- The deal already cash-flows at list — no discount required.
- Meets the 1% rule at list price ($4k rent vs $223k).
- Recommended offer: $196k (12.0% below list) — sets the bar for market timing.
- Cap rate 15.9% vs local median 3.9% in Cincinnati — top-decile yield for the area; either an underpriced asset or a hidden risk that comps aren't pricing in. Stress-test before assuming the spread holds.
Location & tenants
- Location reads 80/100 on livability (#130 in OH, #1,856 nationally) — a professional / high-income tenant draw. Strengths: amenities A+, commute A+, cost of living A+; Watch: employment D, crime F.
- Cincinnati Public Schools (urban): math 25% / reading 36% proficiency, ranked #581 of 656 in OH (top 89%) — families likely to look elsewhere, expect single-tenant / working-renter base with shorter leases; 70% free/reduced lunch — lower-income household profile, screen leases tightly.
- Market conditions: Rents rising fast (+5.5%/yr); 49 active listings in the ZIP; 11 comparable units currently listed for rent nearby; rentals at typical pace (median 21d on market — plan ~3-4 weeks tenant-placement turnaround); lower-income renter base — watch delinquency; 801 units permitted in Hamilton County in 2024 (190 in 5+ unit buildings).
- At $4,247/mo this rent would consume 158% of the median local household income ($32k/yr) (locally 1730% of renters already pay >50% of income on rent) — very limited rent-growth headroom before tenants either downsize or default.
Forward outlook
- Local home prices are declining (-3.0%/yr); year-one equity from $2k of loan paydown is wiped out by about $7k of value loss. Plan a longer hold.
- At projected returns (-3.0% appreciation + 5.5% rent growth), your $62k cash investment doubles in ~4 years — after that, you're playing with house money.
Negotiation context
- It's been on market 168 days — a 12% lower offer ($196k) is reasonable based on typical stale-listing flexibility.
- 6 sale attempts since 12y ago with the ask held roughly flat each time — persistent listings suggest the price (not the market) is what's stuck; bring a comps-based counter.
Risks & watch-outs
- Watch-outs: built in 1916 — expect roof / HVAC / electrical / plumbing capex.
- Climate carrying-cost: extreme-heat days projected 7→19/yr by 2055 (HVAC capex compounding) — expect insurance premiums to compound above CPI over the hold.
Questions for the listing agent
- It's been on market 168 days. Have you received any prior offers? Is the seller open to a 12% concession, seller financing, or rate buy-down credit?
- Can we see the unit-by-unit rent roll, current vacancy, and any below-market leases? What's the average tenancy length?
- What capital expenditures (roof, boiler, parking lot, exteriors) have been made in the last 5 years, and what's planned in the next 2?
- Built in 1916 — when were the roof, HVAC, electrical panel, plumbing, and water heater last replaced?
- Why hasn't it sold? Are there any deal-killer items the seller is aware of (foundation, flood, title, zoning, code violations)?
- Is there a deadline driving the sale (1031 exchange, divorce, estate, relocation)? That informs how much negotiation room exists.
- Schools are B-rated — typically a magnet for longer-tenancy family renters. What's the average tenant stay here, and is there a school-zone premium baked into asking?
- Crime grade is F in this area — have there been break-ins, vandalism, or insurance claims at this property in the last 3 years? What carrier currently insures it and at what premium?
- What's the average days-on-market for RENTAL listings here right now (not sales)? A rising rental-DOM trend means longer vacancies and softer asking-rent achievability than the comps imply.
- What's the recent tenant-quality profile in this submarket — average credit score on applications, eviction rate, late-payment / NSF rate, and stable-employment percentage? A property-management company in the area should have these aggregated.
- How much new apartment / multifamily construction is in the pipeline within 1–3 miles? Heavy new supply (>2% of stock underway) typically softens rents 12–24 months out; light construction supports rent growth.
Investment metrics
- 1% rule
- 1.90% ✓
- Cap rate
- 15.88%
- Cash-on-cash
- 34.22%
- DSCR
- 2.52
- GRM
- 4.4
CMA / ARV
- ARV (on-the-fly)
- $251,370
- Comps found
- 3
Show comp detail 3 sales within ~0.75 mi
| Address | Dist | Beds/Ba | Sqft | Sold | Price | $/sf | Match |
|---|---|---|---|---|---|---|---|
| 844 Windham Ave | 0.42mi | 5/2.5 | 2,487 (+4%) | 7mo | $241,000 | $97 | 66 |
| 3016 Euclid Ave | 0.72mi | 4/2.0 (-1) | 2,567 (+7%) | 12mo | $418,500 | $163 | 36 |
| 848 Windham Ave | 0.43mi | 5/3.0 | 2,752 (+15%) | 24mo | $289,000 | $105 | 35 |
Match score weights: distance 35% · size 25% · config 20% · recency 20%. Top-matched comps best support the ARV.
Projected returns pro-forma
-3.0% appreciation · 5.55% rent growth · sell at horizon
- IRR
- 32.5%
- Equity multiple
- 2.42×
- Total profit
- $88,541
- Equity at exit
- $33,250
- IRR
- 41.0%
- Equity multiple
- 5.35×
- Total profit
- $271,800
- Equity at exit
- $19,281
Cash invested: $62,440 (down + closing). Projections, not guarantees.
Landlord ↔ Tenant lean methodology
- Overall (STATE)
- 73 Landlord-Friendly
- State Ohio
- 73 Landlord-Friendly · R+6
- County
- — inherits STATE
- City
- — inherits STATE
ZIP-level market 45229
- Home prices YoY
- -24.0%
- Rents YoY
- 5.5%
- Active inventory
- 49
- Price-to-rent
- 13.1×
Monthly cashflow live
- Estimated rent
- $4,247 high interval (Pro) →
- Mortgage (P&I)
- −$1,169
- Tax from tax record
- −$312 /mo · $3,744/yr
- Insurance
- −$93
- HOA
- −$0
- Vacancy / Maint / Mgmt
- −$892
- Net cashflow
- $1,781
Break-even live
3-unit breakdown (identical units grouped — click to expand)
| Units | Beds | Baths | Est. rent |
|---|---|---|---|
| 3× units | 3 | 1.5 | $4,248 |
| #1 | 3 | 1.5 | $1,416 |
| #2 | 3 | 1.5 | $1,416 |
| #3 | 3 | 1.5 | $1,416 |
| Total (3 units) | $4,247 | ||
UW: 25.0% down · 7.5% · 30yr · 1.5% tax · 5.0% vac · 8.0% maint · 8.0% mgmt
Financing live
Cash to close
- Down payment
- $55,750
- Closing costs
- $6,690
- Reserves months
- —
- Total cash needed
- —
Loan-product check · same deal, 3 products live
Conventional
25% down · 7.5% · 30yr
- Down + closing
- —
- Monthly P&I
- —
- Monthly cashflow
- —
- DSCR
- —
- Eligible?
- —
Personal DTI + credit; lowest rate.
DSCR
20% down · 8.5% · 30yr
- Down + closing
- —
- Monthly P&I
- —
- Monthly cashflow
- —
- DSCR
- —
- Eligible?
- —
No personal income docs; deal must DSCR.
Hard money
10% down · 12.0% · 12mo
- Down + closing
- —
- Monthly P&I
- —
- Monthly cashflow
- —
- DSCR
- —
- Eligible?
- —
Short-term bridge; refi at stabilization.
Rent comps 11 comps
| Address | Beds | Baths | Sqft | Rent | $/sqft | DOM | Units | Dist |
|---|---|---|---|---|---|---|---|---|
| 870 Rockdale Ave Cincinnati, OH | 4.0 | 2.0 | 1749 | $1,800 | $1.03 | 23d | 1 | 0.57mi |
| 3028 Gilbert Ave Cincinnati, OH | 5.0 | 1.5 | 1936 | $1,700 | $0.88 | 20d | 1 | 0.59mi |
| 241 E University Ave Cincinnati, OH | 5.0 | 2.0 | 1836 | $4,000 | $2.18 | 23d | 1 | 0.65mi |
| 2813 Gerard St Unit 1540075P Cincinnati, OH | 4.0 | 3.0 | 2152 | $6,281 | $2.92 | 20d | 1 | 0.75mi |
| 1524 Ruth Ave Unit 2 Cincinnati, OH | 4.0 | 1.0 | 1971 | $1,595 | $0.81 | 23d | 1 | 0.91mi |
| 2800 Jefferson Ave Cincinnati, OH | 4.0 | 2.0 | 2500 | $625 | $0.25 | 20d | 1 | 0.98mi |
| 3113 Harvard Ave Cincinnati, OH | 4.0 | 3.0 | 1895 | $2,700 | $1.42 | 14d | 1 | 0.98mi |
| 1718 Dexter Ave Cincinnati, OH | 4.0 | 2.0 | 2539 | $2,100 | $0.83 | 23d | 1 | 1.20mi |
| 7 W Hollister St Cincinnati, OH | 5.0 | 2.0 | 1585 | $2,750 | $1.74 | 14d | 1 | 1.31mi |
| 223 Woolper Ave Cincinnati, OH | 6.0 | 3.0 | 3000 | $3,500 | $1.17 | 12d | 1 | 1.35mi |
| 2105 Burnet Ave Unit 1056017P Cincinnati, OH | 4.0 | 2.0 | 2960 | $7,384 | $2.49 | 1d | 1 | 1.42mi |
Listing history 32 events
-
2026-06-18days on market $223,000 Active 168 DOM
-
2026-06-17days on market $223,000 Active 167 DOM
-
2026-06-16days on market $223,000 Active 166 DOM
-
2026-06-15days on market $223,000 Active 165 DOM
-
2026-06-13days on market $223,000 Active 163 DOM
-
2026-06-13days on market $223,000 Active 162 DOM
-
2026-06-09days on market $223,000 Active 159 DOM
-
2026-06-08days on market $223,000 Active 158 DOM
-
2026-06-07days on market $223,000 Active 157 DOM
-
2026-06-03days on market $223,000 Active 153 DOM
-
2026-06-02days on market $223,000 Active 152 DOM
-
2026-06-01days on market $223,000 Active 151 DOM
-
2026-05-31days on market $223,000 Active 150 DOM
-
2026-03-25price $223,000
-
2025-12-31$229,000 Active
-
2025-12-28historical 195-char remark
Show marketing remark (195 chars)
Triplex that is income ready for your TLC. On and off street parking. Long term leases, centrally located,5 mile radius from 2 colleges, highway close, Saturday Only Showings.All Unit occupied.
-
2025-12-11price $230,000 195-char remark
Show marketing remark (195 chars)
Triplex that is income ready for your TLC. On and off street parking. Long term leases, centrally located,5 mile radius from 2 colleges, highway close, Saturday Only Showings.All Unit occupied.
-
2025-11-24price $231,000 195-char remark
Show marketing remark (195 chars)
Triplex that is income ready for your TLC. On and off street parking. Long term leases, centrally located,5 mile radius from 2 colleges, highway close, Saturday Only Showings.All Unit occupied.
-
2025-11-14status Active 195-char remark
Show marketing remark (195 chars)
Triplex that is income ready for your TLC. On and off street parking. Long term leases, centrally located,5 mile radius from 2 colleges, highway close, Saturday Only Showings.All Unit occupied.
-
2025-11-14price $239,900 195-char remark
Show marketing remark (195 chars)
Triplex that is income ready for your TLC. On and off street parking. Long term leases, centrally located,5 mile radius from 2 colleges, highway close, Saturday Only Showings.All Unit occupied.
-
2025-11-02historical 195-char remark
Show marketing remark (195 chars)
Triplex that is income ready for your TLC. On and off street parking. Long term leases, centrally located,5 mile radius from 2 colleges, highway close, Saturday Only Showings.All Unit occupied.
-
2025-09-17status Active 195-char remark
Show marketing remark (195 chars)
Triplex that is income ready for your TLC. On and off street parking. Long term leases, centrally located,5 mile radius from 2 colleges, highway close, Saturday Only Showings.All Unit occupied.
-
2025-09-07historical Contingency Pending 195-char remark
Show marketing remark (195 chars)
Triplex that is income ready for your TLC. On and off street parking. Long term leases, centrally located,5 mile radius from 2 colleges, highway close, Saturday Only Showings.All Unit occupied.
-
2025-08-28$240,000 Active 195-char remark
Show marketing remark (195 chars)
Triplex that is income ready for your TLC. On and off street parking. Long term leases, centrally located,5 mile radius from 2 colleges, highway close, Saturday Only Showings.All Unit occupied.
-
2024-12-10soldstatus $272,000
-
2023-09-05historical 226-char remark
Show marketing remark (226 chars)
Bidding ends August 10th at 1:00pm ET. Great 3 family home. Two out of the three units are rented at $900/month and one unit is vacant. Reserve is at the list price. Sold 100% As-IS. 10% Buyer Premium is added to the high bid.
-
2023-07-27price $199,000 226-char remark
Show marketing remark (226 chars)
Bidding ends August 10th at 1:00pm ET. Great 3 family home. Two out of the three units are rented at $900/month and one unit is vacant. Reserve is at the list price. Sold 100% As-IS. 10% Buyer Premium is added to the high bid.
-
2023-07-05$150,000 Active 226-char remark
Show marketing remark (226 chars)
Bidding ends August 10th at 1:00pm ET. Great 3 family home. Two out of the three units are rented at $900/month and one unit is vacant. Reserve is at the list price. Sold 100% As-IS. 10% Buyer Premium is added to the high bid.
-
2022-01-28soldstatus $168,000
-
2014-05-30soldstatus $24,000
-
2014-03-11$29,900
-
2003-07-24soldstatus $80,000
ⓘ Source: listings_history table (triggers on properties + properties_extension) + one-shot
backfill from property_details.listing_events for pre-trigger history.
Tax reassessment forecast OH · Partial reset (capped growth)
- Current annual tax
- $3,744 · $312/mo
- Projected year-2 tax
- $3,744 · $312/mo
- Expected delta
- $0/yr ($0/mo · 0.0%)
ⓘ Screening estimate from a state-policy table — verify with the county assessor before closing.
Climate risk First Street
- Flood 1/10 Low FEMA zone X (unshaded) · 0% chance over 30 yrs
- Wildfire 1/10 Low
- Heat 5/10 Major 7 d/yr ≥103°F today · 19 d/yr by 30 yrs out
- Wind 2/10 Low 100% chance of damaging wind over 30 yrs
- Air quality 3/10 Moderate 2 unhealthy d/yr today · 3 by 30 yrs out
Nearby sold comps map
Loading sold comps map…
Walkable amenities ~0.75 mi
Loading nearby amenities…
Taxation est. · year 1
- Rental income
- $50,964
- − Mortgage interest
- −$12,491
- − Property taxes
- −$3,744
- − Insurance
- −$1,115
- − Repairs & maintenance
- −$4,077
- − Management
- −$4,077
- − Depreciation
- −$6,487
- Taxable income
- $18,972
- Est. tax owed @ 24.0%
- −$4,553
- After-tax cash flow
- $16,816/yr
For passive investors: Depreciation is non-cash, so a rental often shows a tax loss while cash-flowing — sheltering income. Rental losses are passive: they offset passive income freely, and up to $25,000/yr can offset ordinary (W-2) income if you actively participate and your MAGI is under $100k (phasing out to $0 by $150k); unused losses carry forward. On sale, claimed depreciation is recaptured at up to 25%, and gains may owe capital-gains tax (a 1031 exchange can defer both). Figures are a year-1 estimate at your 24.0% rate — not tax advice; consult a CPA.
Schools (NCES district)
- District
- Cincinnati Public Schools
- NCES district ID
- 3904375
- Math proficiency
- 25% ▼ -19.00%
- Reading proficiency
- 36% ▼ -14.00%
- Median HH income
- $35,743
- Composite
- 25.21/100
- National rank
- #7508
- State rank
- #581 of 656 in OH
Livability — Cincinnati
- Score
- 80/100
- State rank
- #130
- US rank
- #1856
Category grades
Schools grade is shown separately in the Schools card above.
Census & demographics
- Census place
- Cincinnati, OH
- County
- Hamilton County · 701,295 people
- City population
- 505,555
- Metro
- Cincinnati, OH-KY-IN
- Population (ZIP)
- 13,529
- Household income
- $32,263
- Rent vs Own
- Severe rent burden
- 1730.0
Population outlook (Hamilton County) Hauer SSP2
- Today (2025)
- 826,054 people
- By 2030
- 830,947 · +0.6%
- By 2040
- 832,319 · +0.8%
- By 2050
- 822,428 · -0.4%
- By 2075
- 788,688 · -4.5%
- By 2100
- 710,674 · -14.0%
Race, ethnicity, and origin ACS 2023
- Neighborhood character
- Predominantly Black (65%)
- Race & ethnicity
- Black 65% White 24% Two or more races 5% Hispanic / Latino 4% Asian 1%
- Common ancestry
- Italian 2% Iranian 1% Lithuanian 1%
- Foreign-born
- 5% · Canada
- Languages at home
- 93% English-only · Spanish 4% Russian/Polish/Slavic 1% Other Indo-European 1%
Political lean MEDSL · Hamilton
- 2024 margin
- D (+14.9) · D 57.0% · R 42.1%
- 2008→2024 swing
- +7.9pp toward D · 2008: 7.0pp · 2024: 14.9pp
- All cycles
- 2024: D+14.9 2020: D+15.9 2016: D+9.5 2012: D+4.9 2008: D+7.0
Not yet ingested
- Civics
- —
Market trends
- HPI YoY
- ▼ -80.34%
- Current HPI
- 254.492
- Rent YoY
- ▲ 5.55%
- Metro
- Cincinnati, OH-KY-IN
- State GDP YoY
- ▲ 1.98%
- F500 in state
- 48
Industry mix (Fortune 500 HQ in OH)
| Industry | F500 HQs | Revenue |
|---|---|---|
| Insurance | 3 | $145B |
|
||
| Industrial Machinery | 3 | $49B |
|
||
| Financial Services | 3 | $24B |
|
||
| Consumer Goods | 2 | $93B |
|
||
| Aerospace / Defense | 2 | $47B |
|
||
| Utilities | 2 | $33B |
|
||
Price history
+178.8% since first listed19 events — show timeline
- 2026-03-25 Price Changed $223,000 Cincy MLS
- 2025-12-31 Listed $229,000 Cincy MLS
- 2025-12-28 Listing Removed — Cincy MLS
- 2025-12-11 Price Changed $230,000 Cincy MLS
- 2025-11-24 Price Changed $231,000 Cincy MLS
- 2025-11-14 Relisted — Cincy MLS
- 2025-11-14 Price Changed $239,900 Cincy MLS
- 2025-11-02 Listing Removed — Cincy MLS
- 2025-09-17 Relisted — Cincy MLS
- 2025-09-07 Contingent — Cincy MLS
- 2025-08-28 Listed $240,000 Cincy MLS
- 2024-12-10 Sold (Public Records) $272,000 Public Records
- 2023-09-05 Listing Removed — Cincy MLS
- 2023-07-27 Price Changed $199,000 Cincy MLS
- 2023-07-05 Listed $150,000 Cincy MLS
- 2022-01-28 Sold (Public Records) $168,000 Public Records
- 2014-05-30 Sold (MLS) $24,000 Cincy MLS
- 2014-03-11 Listed $29,900 Cincy MLS
- 2003-07-24 Sold (Public Records) $80,000 Public Records
Property tax history
+18.4%/yrLatest (2025): $3,744 · +0.1% YoY. Source: county tax records.
Cash-flow waterfall
monthlySold comps — $/sqft
last 12 mo · ≤1 miLoading sold comps…