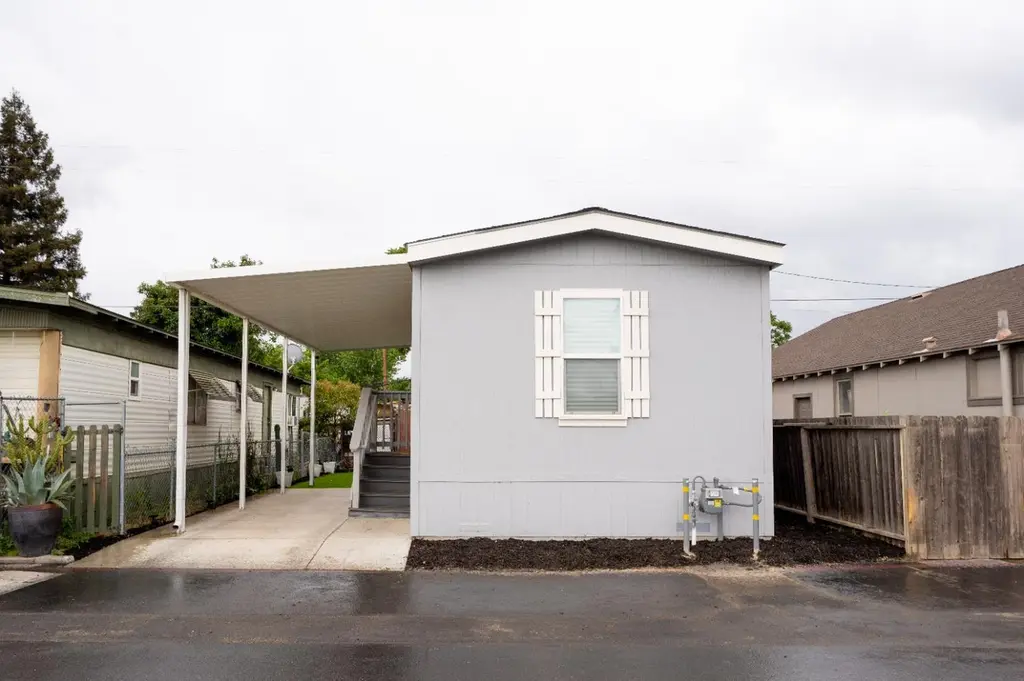
1412 S 1st St #21 · Turlock, CA
Flood risk 1/10 · Minimal
- FEMA flood zone
- X (unshaded)
- Chance of flooding over 30 yrs
- 0.0%
- Est. flood insurance / yr
- $507 – $1,088
Fire risk 7/10 · Major
- Est. fire insurance / yr
- $659 – $1,223
Heat risk 7/10 · Major
- Hot days now (above 102°F)
- 7 days/yr
- Hot days in 30 yrs
- 16 days/yr
Wind risk 1/10 · Minimal
- Chance of severe wind over 30 yrs
- —
Air-quality risk 10/10 · Severe
- Unhealthy air days now
- 42 days/yr
- Unhealthy air days in 30 yrs
- 43 days/yr
Risk factors via First Street. Map © Google.
Why this score? — see what drove the B- grade
The composite is a weighted blend of 9 inputs, each scored 0–100. Each bar is that input's sub-score; the figure is the points it added to the 100-point composite (weight × sub-score).
- Cash flow +30.0/30.0
- DSCR +10.0/10.0
- 1% rule +8.5/10.0
- ARV discount +7.5/15.0
- Condition / age +3.8/5.0
- Livability +3.3/5.0
- Rent growth +2.8/5.0
- Schools +2.7/10.0
- Appreciation +0.0/10.0
$110,000
🖨 Deal sheet (PDF) 📄 Offer letter ✓ Due diligence
Listing remarks
Welcome to 1412 S 1st S in Turlock! This Beautifully updated 2-bedroom, 1-bathoom home features a sleek, brand-new shower and fresh interior touches. Step outside to your private oasis featuring newly installed turf- perfect for low-maintenance lounging. Just a few minutes from Golden State Highway. Clean, contempary, and ready for you to call it HOME!
Key facts
- Newly installed turf
- Private oasis
- Brand-new shower
Tags
Property features AI
Finance
- Other: Located in Stanislaus County, Turlock, CA (postal code 95380); Address: 1412 S 1st St #21; Cross street: Golf Rd; Directions: S Golden State to Golf Rd to 1st St; Not a senior community
- Financial info: Land lease: No (note: a land lease amount field is present but land lease is marked No)
- HOA & community: No association
Exterior
- Parking: Covered parking; Guest parking available
- Utilities: Public water; Public sewer; 220 volts available in laundry
- Home design: Manufactured in park; Single-wide; Built in 2023
- Construction: Manufacturer: Champion; Skirting: Other
- Exterior features: Shingle roof; Regular-shaped lot
Interior
- Kitchen: Stone counter
- Bedrooms: 2 bedrooms
- Flooring: Carpet; Linoleum
- Bathrooms: 1 full bathroom with shower stall
- Heating & cooling: Central heating; Ceiling fans; Window air conditioning units
- Interior features: Stone countertops; Living room with flexible/other features; Dining space in kitchen
- Laundry & utility: Laundry inside (220V outlet in laundry)
Neighborhood map
What this means for you Summary
Snapshot
- This is a 2-bed/1.0-bath manufactured listed at $110k. Condition is rated good.
Deal economics
- At list price, monthly cash flow is $415 ($5k/yr) — positive.
- The deal already cash-flows at list — no discount required.
- Meets the 1% rule at list price ($1k rent vs $110k).
- Recommended offer: $107k (3.0% below list) — sets the bar for market timing.
- Cap rate 10.8% vs local median 3.1% in Turlock — top-decile yield for the area; either an underpriced asset or a hidden risk that comps aren't pricing in. Stress-test before assuming the spread holds.
Location & tenants
- Location reads 66/100 on livability (#353 in CA) — a middle-class / working-renter tenant base. Strengths: housing A, health & safety A-, commute B; Watch: amenities D, crime D-, cost of living F.
- Turlock Unified (suburban): math 23% / reading 38% proficiency, ranked #334 of 517 in CA (top 65%) — families likely to look elsewhere, expect single-tenant / working-renter base with shorter leases.
- Zoned schools: Cunningham Elementary (math 11% / reading 15%, grade F, #1,463 of 1,571 statewide, top 94%, 572 students, 76% FRL); Turlock Junior High (math 26% / reading 43%, grade F, #183 of 498 statewide, top 38%, 1,257 students, 62% FRL); Turlock High (math 21% / reading 48%, grade F, #618 of 1,170 statewide, top 56%, 2,475 students, 54% FRL).
- Market conditions: Rents rising (+1.3%/yr); 130 active listings in the ZIP; 1 comparable units currently listed for rent nearby; 923 units permitted in Stanislaus County in 2024 (63 in 5+ unit buildings).
Forward outlook
- Local home prices are declining (-3.0%/yr); year-one equity from $761 of loan paydown is wiped out by about $3k of value loss. Plan a longer hold.
- Stanislaus County population projected at +14% by 2050 — modest demand growth; plan on rents tracking national, not racing it.
- At projected returns (-3.0% appreciation + 1.3% rent growth), your $31k cash investment doubles in ~9 years — after that, you're playing with house money.
Negotiation context
- It's been on market 58 days — a 3% lower offer ($107k) is reasonable based on typical stale-listing flexibility.
Risks & watch-outs
- Climate carrying-cost: major wildfire risk; extreme-heat days projected 7→16/yr by 2055 (HVAC capex compounding) — expect insurance premiums to compound above CPI over the hold.
Questions for the listing agent
- It's been on market 58 days. Have you received any prior offers? Is the seller open to a 3% concession, seller financing, or rate buy-down credit?
- Is there a deadline driving the sale (1031 exchange, divorce, estate, relocation)? That informs how much negotiation room exists.
- Schools are F-rated, which usually means shorter tenancies and higher turnover. Who's the typical renter profile here, and what's been the actual vacancy rate?
- Crime grade is D in this area — have there been break-ins, vandalism, or insurance claims at this property in the last 3 years? What carrier currently insures it and at what premium?
- What's the average days-on-market for RENTAL listings here right now (not sales)? A rising rental-DOM trend means longer vacancies and softer asking-rent achievability than the comps imply.
- What's the recent tenant-quality profile in this submarket — average credit score on applications, eviction rate, late-payment / NSF rate, and stable-employment percentage? A property-management company in the area should have these aggregated.
- How much new for-sale + rental construction is in the pipeline within 1–3 miles? Heavy new supply typically softens prices + rents 12–24 months out; constrained supply supports both.
Investment metrics
- 1% rule
- 1.35% ✓
- Cap rate
- 10.82%
- Cash-on-cash
- 16.16%
- DSCR
- 1.72
- GRM
- 6.2
CMA / ARV
No comps found within radius.
Projected returns pro-forma
-3.0% appreciation · 1.27% rent growth · sell at horizon
- IRR
- 5.2%
- Equity multiple
- 1.20×
- Total profit
- $6,074
- Equity at exit
- $16,401
- IRR
- 13.0%
- Equity multiple
- 1.95×
- Total profit
- $29,315
- Equity at exit
- $9,511
Cash invested: $30,800 (down + closing). Projections, not guarantees.
Landlord ↔ Tenant lean methodology
- Overall (STATE)
- 18 Strongly Tenant-Friendly
- State California
- 18 Strongly Tenant-Friendly · D+13
- County
- — inherits STATE
- City
- — inherits STATE
ZIP-level market 95380
- Rents YoY
- 1.3%
- Active inventory
- 130
- Price-to-rent
- 6.2×
Monthly cashflow live
- Estimated rent
- $1,487 medium interval (Pro) →
- Mortgage (P&I)
- −$577
- Tax est. 1.5%
- −$138 /mo · $1,650/yr
- Insurance
- −$46
- HOA
- −$0
- Vacancy / Maint / Mgmt
- −$312
- Net cashflow
- $415
Break-even live
Sensitivity live
| Price | -10% $491 | -5% $453 | +0% $415 | +5% $377 | +10% $339 |
|---|---|---|---|---|---|
| Rent | -10% $297 | -5% $356 | +0% $415 | +5% $474 | +10% $532 |
| Rate | -1.0pp $470 | -0.5pp $443 | base $415 | +0.5pp $386 | +1.0pp $357 |
UW: 25.0% down · 7.5% · 30yr · 1.5% tax · 5.0% vac · 8.0% maint · 8.0% mgmt
Financing live
Cash to close
- Down payment
- $27,500
- Closing costs
- $3,300
- Reserves months
- —
- Total cash needed
- —
Loan-product check · same deal, 3 products live
Conventional
25% down · 7.5% · 30yr
- Down + closing
- —
- Monthly P&I
- —
- Monthly cashflow
- —
- DSCR
- —
- Eligible?
- —
Personal DTI + credit; lowest rate.
DSCR
20% down · 8.5% · 30yr
- Down + closing
- —
- Monthly P&I
- —
- Monthly cashflow
- —
- DSCR
- —
- Eligible?
- —
No personal income docs; deal must DSCR.
Hard money
10% down · 12.0% · 12mo
- Down + closing
- —
- Monthly P&I
- —
- Monthly cashflow
- —
- DSCR
- —
- Eligible?
- —
Short-term bridge; refi at stabilization.
Rent comps 1 comps
| Address | Beds | Baths | Sqft | Rent | $/sqft | DOM | Units | Dist |
|---|---|---|---|---|---|---|---|---|
| 1500 East Ave Turlock, CA | 1.0 | 1.0 | 620 | $1,115 | $1.80 | 15d | 1 | 0.76mi |
Listing history 17 events
-
2026-06-21days on market $110,000 Active 58 DOM
-
2026-06-18days on market $110,000 Active 55 DOM
-
2026-06-17days on market $110,000 Active 54 DOM
-
2026-06-16days on market $110,000 Active 53 DOM
-
2026-06-15days on market $110,000 Active 52 DOM
-
2026-06-14days on market $110,000 Active 50 DOM
-
2026-06-13days on market $110,000 Active 49 DOM
-
2026-06-10days on market $110,000 Active 47 DOM
-
2026-06-09days on market $110,000 Active 46 DOM
-
2026-06-08days on market $110,000 Active 45 DOM
-
2026-06-07days on market $110,000 Active 44 DOM
-
2026-06-05days on market $110,000 Active 41 DOM
-
2026-06-03days on market $110,000 Active 40 DOM
-
2026-06-02days on market $110,000 Active 39 DOM
-
2026-06-01days on market $110,000 Active 38 DOM
-
2026-05-31days on market $110,000 Active 37 DOM
-
2026-05-30days on market $110,000 Active 36 DOM
ⓘ Source: listings_history table (triggers on properties + properties_extension) + one-shot
backfill from property_details.listing_events for pre-trigger history.
Climate risk First Street
- Flood 1/10 Low FEMA zone X (unshaded) · 0% chance over 30 yrs
- Wildfire 7/10 Severe
- Heat 7/10 Severe 7 d/yr ≥102°F today · 16 d/yr by 30 yrs out
- Wind 1/10 Low
- Air quality 10/10 Extreme 42 unhealthy d/yr today · 43 by 30 yrs out
Nearby sold comps map
Loading sold comps map…
Walkable amenities ~0.75 mi
Loading nearby amenities…
Taxation est. · year 1
- Rental income
- $17,849
- − Mortgage interest
- −$6,162
- − Property taxes
- −$1,650
- − Insurance
- −$550
- − Repairs & maintenance
- −$1,428
- − Management
- −$1,428
- − Depreciation
- −$3,200
- Taxable income
- $3,431
- Est. tax owed @ 24.0%
- −$823
- After-tax cash flow
- $4,155/yr
For passive investors: Depreciation is non-cash, so a rental often shows a tax loss while cash-flowing — sheltering income. Rental losses are passive: they offset passive income freely, and up to $25,000/yr can offset ordinary (W-2) income if you actively participate and your MAGI is under $100k (phasing out to $0 by $150k); unused losses carry forward. On sale, claimed depreciation is recaptured at up to 25%, and gains may owe capital-gains tax (a 1031 exchange can defer both). Figures are a year-1 estimate at your 24.0% rate — not tax advice; consult a CPA.
Condition & rehab AI · 3 photos
This beautifully updated 2-bedroom, 1-bathroom home is move-in ready with good curb appeal and minimal maintenance required.
Value-add opportunities
- Both Paint exterior walls — Enhances curb appeal and can increase both resale and rental value.
- Both Replace HVAC filters — Improves air quality and can attract tenants or buyers.
- Both Install smart home features — Can increase both resale and rental value by adding modern amenities.
Renovation cost estimate screening
Value-add ROI direction
- Both Paint exterior walls — Enhances curb appeal and can increase both resale and rental value. ↑
- Both Replace HVAC filters — Improves air quality and can attract tenants or buyers. ↑
- Both Install smart home features — Can increase both resale and rental value by adding modern amenities. ↑
ⓘ Cost ranges are severity-bucket heuristics (US national rule-of-thumb). Get contractor quotes + a written scope before underwriting a rehab budget.
Schools (NCES district)
- District
- Turlock Unified
- NCES district ID
- 0600158
- Math proficiency
- 23% ▼ -8.00%
- Reading proficiency
- 38% ▼ -7.00%
- Median HH income
- $50,249
- Composite
- 26.58/100
- National rank
- #7184
- State rank
- #334 of 517 in CA
Livability — Turlock
- Score
- 66/100
- State rank
- #353
- US rank
- #11971
Category grades
Schools grade is shown separately in the Schools card above.
Census & demographics
- Census place
- Turlock, CA
- County
- Stanislaus County · 445,786 people
- City population
- 83,043
- Metro
- Modesto, CA
- Population (ZIP)
- 43,960
- Household income
- $74,534
- Rent vs Own
- Severe rent burden
- 1545.0
Population outlook (Stanislaus County) Hauer SSP2
- Today (2025)
- 579,493 people
- By 2030
- 598,000 · +3.2%
- By 2040
- 630,930 · +8.9%
- By 2050
- 658,300 · +13.6%
- By 2075
- 712,363 · +22.9%
- By 2100
- 719,805 · +24.2%
Race, ethnicity, and origin ACS 2023
- Neighborhood character
- Diverse neighborhood (Simpson 0.57)
- Race & ethnicity
- Hispanic / Latino 54% White 36% Two or more races 14% Asian 4% Black 1%
- Hispanic origin (detail)
- Mexican 51%
- Common ancestry
- Russian 8% Italian 1% Portuguese 1%
- Foreign-born
- 22% · Canada
- Languages at home
- 52% English-only · Spanish 39% Other Indo-European 7%
Political lean MEDSL · Stanislaus
- 2024 margin
- R (+11.0) · D 43.2% · R 54.2% · Other 2.6%
- 2008→2024 swing
- -12.7pp toward R · 2008: 1.7pp · 2024: -11.0pp
- All cycles
- 2024: R+11.0 2020: D+0.8 2016: D+0.6 2012: D+0.7 2008: D+1.7
Not yet ingested
- Civics
- —
Market trends
- HPI YoY
- ▼ -614.27%
- Current HPI
- 307.7264
- Rent YoY
- ▲ 1.27%
- Metro
- Modesto, CA
- State GDP YoY
- ▲ 3.21%
- F500 in state
- 116
Industry mix (Fortune 500 HQ in CA)
| Industry | F500 HQs | Revenue |
|---|---|---|
| Technology | 27 | $1,492B |
|
||
| Financial Services | 3 | $174B |
|
||
| Retail | 3 | $44B |
|
||
| Insurance | 3 | $26B |
|
||
| Media / Entertainment | 2 | $115B |
|
||
| Pharmaceuticals / Biotech | 2 | $62B |
|
||
Cash-flow waterfall
monthlySold comps — $/sqft
last 12 mo · ≤1 miLoading sold comps…