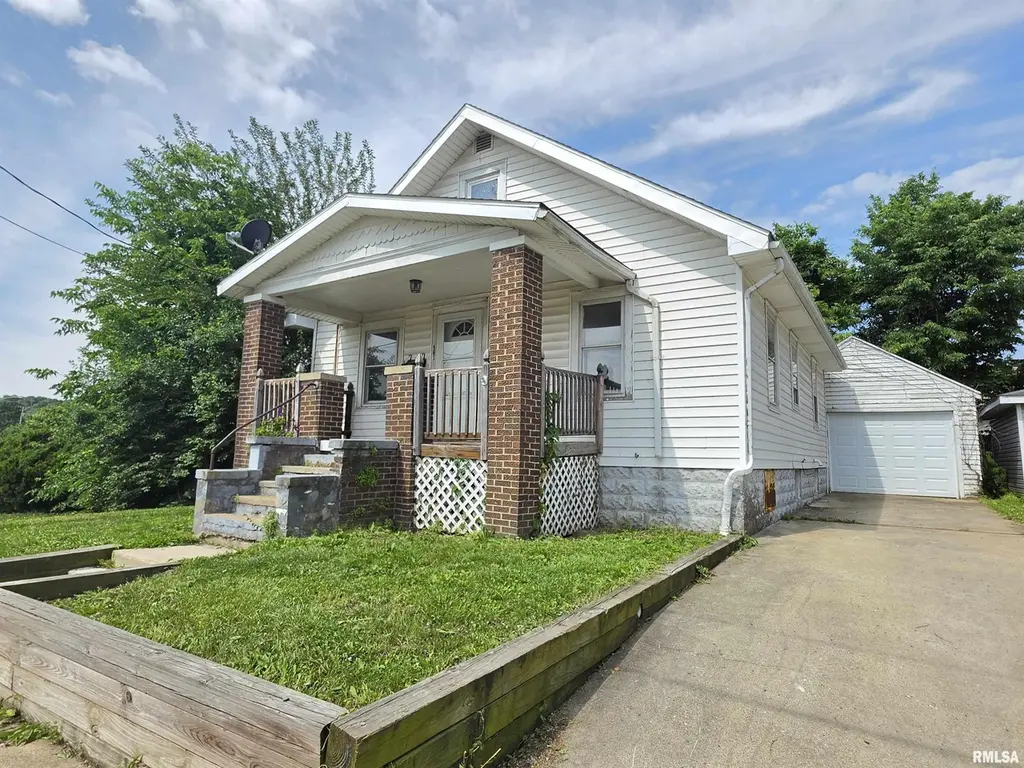
121 Pershing Pl · East Peoria, IL
Flood risk 4/10 · Minor
- FEMA flood zone
- X (unshaded)
- Chance of flooding over 30 yrs
- 0.2%
- Est. flood insurance / yr
- $473 – $860
Fire risk 3/10 · Minor
- Est. fire insurance / yr
- $804 – $1,492
Heat risk 3/10 · Minor
- Hot days now (above 104°F)
- 7 days/yr
- Hot days in 30 yrs
- 19 days/yr
Wind risk 2/10 · Minimal
- Chance of severe wind over 30 yrs
- 1.0%
Air-quality risk 3/10 · Minor
- Unhealthy air days now
- 1 days/yr
- Unhealthy air days in 30 yrs
- 3 days/yr
Risk factors via First Street. Map © Google.
Why this score? — see what drove the D+ grade
The composite is a weighted blend of 9 inputs, each scored 0–100. Each bar is that input's sub-score; the figure is the points it added to the 100-point composite (weight × sub-score).
- Cash flow +22.9/30.0
- DSCR +7.4/10.0
- 1% rule +6.2/10.0
- Livability +3.8/5.0
- Rent growth +2.5/5.0
- Condition / age +2.5/5.0
- Schools +1.5/10.0
- ARV discount +0.0/15.0
- Appreciation +0.0/10.0
$109,900
🖨 Deal sheet 📄 Offer letter ✓ Due diligence
Listing remarks MLS
3 bedroom home in central East Peoria location close to schools, restaurants and amenities. Main floor has living room, formal dining room and 2 bedrooms. Upper level is one large bedroom. Full Basement has laundry area, unfinished recreation room and storage area. Fenced in backyard with privacy fencing and 1 stall garage. Exterior and garage need some TLC - great for equity build or investor!
Key facts
- Shaded yard
- Nearby parks
- Functional layout
Tags
Property features AI
Exterior
- Parking: Detached 1-car garage
- Utilities: Public water; Public sewer
- Home design: Single-family residence; Approximately 1260 total building area; Built in 1928
- Construction: Shingle roof; Not new construction
- Exterior features: Level lot; Lot dimensions approximately 75 x 40
Interior
- Kitchen: Kitchen included (refrigerator provided)
- Bedrooms: Three bedrooms; Primary bedroom on the upper level; One bedroom on the lower level; Bedrooms have egress windows
- Flooring: Laminate flooring in several rooms; Carpet in the living room; Vinyl flooring in the kitchen
- Bathrooms: One full bathroom
- Heating & cooling: Forced air heating; Central air conditioning
- Interior features: Full, unfinished basement; Washer and dryer included; Refrigerator included; No fireplace
- Laundry & utility: Washer and dryer included; Full basement provides additional utility/storage space
Neighborhood map
What this means for you Summary
Snapshot
- This is a 3-bed/1.0-bath single-family listed at $110k.
Deal economics
- At list price, monthly cash flow is $193 ($2k/yr) — positive.
- The deal already cash-flows at list — no discount required.
- Meets the 1% rule at list price ($1k rent vs $110k).
- Recommended offer: $108k (1.5% below list) — sets the bar for market timing.
- Cap rate 8.4% vs local median 4.6% in East Peoria — top-decile yield for the area; either an underpriced asset or a hidden risk that comps aren't pricing in. Stress-test before assuming the spread holds.
Location & tenants
- Location reads 75/100 on livability (#209 in IL, #3,927 nationally) — a middle-class / working-renter tenant base. Strengths: cost of living A+, housing A+, health & safety A+; Watch: amenities D, commute F.
- East Peoria Chsd 309 (suburban): math 17% / reading 15% proficiency, ranked #482 of 620 in IL (top 78%) — low school quality limits family demand, transient renter base, plan for 1-2y turnover.
- Zoned schools: East Peoria High School (math 17% / reading 15%, grade F, #457 of 693 statewide, top 66%, 947 students, 0% FRL).
- Market conditions: 145 active listings in the ZIP; 77 units permitted in Tazewell County in 2024 (0 in 5+ unit buildings).
Forward outlook
- Local home prices are declining (-3.0%/yr); year-one equity from $760 of loan paydown is wiped out by about $3k of value loss. Plan a longer hold.
- Tazewell County population projected at -15% by 2050 — secular population decline; favor cash flow + early exit over multi-decade hold.
Negotiation context
- It's been on market 17 days — a 2% lower offer ($108k) is reasonable based on typical stale-listing flexibility.
- 8 sale attempts since 5y ago with the ask held roughly flat each time — persistent listings suggest the price (not the market) is what's stuck; bring a comps-based counter.
- Current owner paid $65k; list at $110k implies a 69% gain — meaningful room to come down on a strong offer.
Risks & watch-outs
- Watch-outs: built in 1928 — expect roof / HVAC / electrical / plumbing capex.
Questions for the listing agent
- Built in 1928 — when were the roof, HVAC, electrical panel, plumbing, and water heater last replaced?
- Is there a deadline driving the sale (1031 exchange, divorce, estate, relocation)? That informs how much negotiation room exists.
- Schools are F-rated, which usually means shorter tenancies and higher turnover. Who's the typical renter profile here, and what's been the actual vacancy rate?
- The area grade is low — what's the realistic commute time and amenity access for the typical tenant pool here? Any planned neighborhood developments (good or bad) we should know about?
- What's the average days-on-market for RENTAL listings here right now (not sales)? A rising rental-DOM trend means longer vacancies and softer asking-rent achievability than the comps imply.
- What's the recent tenant-quality profile in this submarket — average credit score on applications, eviction rate, late-payment / NSF rate, and stable-employment percentage? A property-management company in the area should have these aggregated.
- How much new for-sale + rental construction is in the pipeline within 1–3 miles? Heavy new supply typically softens prices + rents 12–24 months out; constrained supply supports both.
Investment metrics
- 1% rule
- 1.12% ✓
- Cap rate
- 8.40%
- Cash-on-cash
- 7.54%
- DSCR
- 1.34
- GRM
- 7.4
CMA / ARV
- ARV (on-the-fly)
- $89,700
- Comps found
- 4
Show comp detail 4 sales within ~0.75 mi
| Address | Dist | Beds/Ba | Sqft | Sold | Price | $/sf | Match |
|---|---|---|---|---|---|---|---|
| 147 Caroline St | 0.25mi | 2/1.0 (-1) | 813 (+4%) | 2mo | $109,000 | $134 | 75 |
| 320 E Sheen Ave | 0.17mi | 2/1.0 (-1) | 728 (-7%) | 20mo | $49,900 | $69 | 59 |
| 116 Linden St | 0.29mi | 2/1.0 (-1) | 824 (+6%) | 19mo | $95,000 | $115 | 57 |
| 129 Pierson St | 0.18mi | 2/1.0 (-1) | 672 (-14%) | 11mo | $73,900 | $110 | 55 |
Match score weights: distance 35% · size 25% · config 20% · recency 20%. Top-matched comps best support the ARV.
Projected returns pro-forma
-3.0% appreciation · 3.0% rent growth · sell at horizon
- IRR
- -4.8%
- Equity multiple
- 0.82×
- Total profit
- $-5,459
- Equity at exit
- $16,386
- IRR
- 5.0%
- Equity multiple
- 1.37×
- Total profit
- $11,234
- Equity at exit
- $9,502
Cash invested: $30,772 (down + closing). Projections, not guarantees.
Landlord ↔ Tenant lean methodology
- Overall (STATE)
- 43 Moderately Tenant-Leaning
- State Illinois
- 43 Moderately Tenant-Leaning · D+7
- County
- — inherits STATE
- City
- — inherits STATE
ZIP-level market 61611
- Home prices YoY
- -30.8%
- Active inventory
- 145
- Price-to-rent
- 7.4×
Monthly cashflow live
- Estimated rent
- $1,231 medium interval (Pro) →
- Mortgage (P&I)
- −$576
- Tax from tax record
- −$157 /mo · $1,884/yr
- Insurance
- −$46
- HOA
- −$0
- Vacancy / Maint / Mgmt
- −$259
- Net cashflow
- $193
Break-even live
UW: 25.0% down · 7.5% · 30yr · 1.5% tax · 5.0% vac · 8.0% maint · 8.0% mgmt
Financing live
Cash to close
- Down payment
- $27,475
- Closing costs
- $3,297
- Reserves months
- —
- Total cash needed
- —
Loan-product check · same deal, 3 products live
Conventional
25% down · 7.5% · 30yr
- Down + closing
- —
- Monthly P&I
- —
- Monthly cashflow
- —
- DSCR
- —
- Eligible?
- —
Personal DTI + credit; lowest rate.
DSCR
20% down · 8.5% · 30yr
- Down + closing
- —
- Monthly P&I
- —
- Monthly cashflow
- —
- DSCR
- —
- Eligible?
- —
No personal income docs; deal must DSCR.
Hard money
10% down · 12.0% · 12mo
- Down + closing
- —
- Monthly P&I
- —
- Monthly cashflow
- —
- DSCR
- —
- Eligible?
- —
Short-term bridge; refi at stabilization.
Listing history 13 events
-
2026-06-19days on market $109,900 Active 17 DOM
-
2026-06-18days on market $109,900 Active 16 DOM
-
2026-06-17days on market $109,900 Active 15 DOM
-
2026-06-16days on market $109,900 Active 14 DOM
-
2026-06-15days on market $109,900 Active 13 DOM
-
2026-06-14days on market $109,900 Active 11 DOM
-
2026-06-13days on market $109,900 Active 10 DOM
-
2026-06-10days on market $109,900 Active 8 DOM
-
2026-06-09days on market $109,900 Active 7 DOM
-
2026-06-08days on market $109,900 Active 6 DOM
-
2026-06-07days on market $109,900 Active 5 DOM
-
2026-06-03remarks 665-char remark
-
2026-06-03$109,900 Active 1 DOM
ⓘ Source: listings_history table (triggers on properties + properties_extension) + one-shot
backfill from property_details.listing_events for pre-trigger history.
Tax reassessment forecast IL · Partial reset (capped growth)
- Current annual tax
- $1,884 · $157/mo
- Projected year-2 tax
- $2,189 · $182/mo
- Expected delta
- +$305/yr (+$25/mo · 16.2%)
ⓘ Screening estimate from a state-policy table — verify with the county assessor before closing.
Climate risk First Street
- Flood 4/10 Moderate FEMA zone X (unshaded) · 20% chance over 30 yrs
- Wildfire 3/10 Moderate
- Heat 3/10 Moderate 7 d/yr ≥104°F today · 19 d/yr by 30 yrs out
- Wind 2/10 Low 100% chance of damaging wind over 30 yrs
- Air quality 3/10 Moderate 1 unhealthy d/yr today · 3 by 30 yrs out
Nearby sold comps map
Loading sold comps map…
Walkable amenities ~0.75 mi
Loading nearby amenities…
Taxation est. · year 1
- Rental income
- $14,773
- − Mortgage interest
- −$6,156
- − Property taxes
- −$1,884
- − Insurance
- −$550
- − Repairs & maintenance
- −$1,182
- − Management
- −$1,182
- − Depreciation
- −$3,197
- Taxable income
- $622
- Est. tax owed @ 24.0%
- −$149
- After-tax cash flow
- $2,172/yr
For passive investors: Depreciation is non-cash, so a rental often shows a tax loss while cash-flowing — sheltering income. Rental losses are passive: they offset passive income freely, and up to $25,000/yr can offset ordinary (W-2) income if you actively participate and your MAGI is under $100k (phasing out to $0 by $150k); unused losses carry forward. On sale, claimed depreciation is recaptured at up to 25%, and gains may owe capital-gains tax (a 1031 exchange can defer both). Figures are a year-1 estimate at your 24.0% rate — not tax advice; consult a CPA.
Schools (NCES district)
- District
- East Peoria Chsd 309
- NCES district ID
- 1713230
- Math proficiency
- 17% ▼ -6.00%
- Reading proficiency
- 15% ▼ -9.00%
- Median HH income
- $51,439
- Composite
- 14.75/100
- National rank
- #9394
- State rank
- #482 of 620 in IL
Livability — East Peoria
- Score
- 75/100
- State rank
- #209
- US rank
- #3927
Category grades
Schools grade is shown separately in the Schools card above.
Census & demographics
- Census place
- East Peoria, IL
- City population
- 23,698
- Population (ZIP)
- 23,698
Population outlook (Tazewell County) Hauer SSP2
- Today (2025)
- 131,252 people
- By 2030
- 128,028 · -2.5%
- By 2040
- 120,443 · -8.2%
- By 2050
- 111,872 · -14.8%
- By 2075
- 89,843 · -31.5%
- By 2100
- 66,468 · -49.4%
Race, ethnicity, and origin ACS 2023
- Neighborhood character
- Predominantly White (92%)
- Race & ethnicity
- White 92% Two or more races 4% Hispanic / Latino 3% Black 1%
- Common ancestry
- Lithuanian 3% Italian 2% Romanian 2%
- Foreign-born
- 1%
- Languages at home
- 98% English-only · Spanish 1%
Political lean MEDSL · Tazewell
- 2024 margin
- Strong R (+26.7) · D 35.8% · R 62.5% · Other 1.8%
- 2008→2024 swing
- -20.6pp toward R · 2008: -6.0pp · 2024: -26.7pp
- All cycles
- 2024: R+26.7 2020: R+25.6 2016: R+28.5 2012: R+17.9 2008: R+6.0
Not yet ingested
- Civics
- —
Market trends
- HPI YoY
- ▼ -71.82%
- Current HPI
- 161.385
- Rent YoY
- —
- Metro
- —
- State GDP YoY
- ▲ 1.59%
- F500 in state
- 60
Industry mix (Fortune 500 HQ in IL)
| Industry | F500 HQs | Revenue |
|---|---|---|
| Insurance | 4 | $201B |
|
||
| Consumer Goods | 4 | $87B |
|
||
| Industrial Machinery | 3 | $64B |
|
||
| Healthcare | 2 | $55B |
|
||
| Retail / Pharmacy | 1 | $148B |
|
||
| Agriculture / Food | 1 | $86B |
|
||
Price history
+103.5% since first listed20 events — show timeline
- 2026-06-02 Listed $109,900 RMLSA as Distributed by MLS Grid
- 2025-05-25 Rental Removed $1,250 APPFOLIO
- 2025-05-09 Listed for Rent $1,250 APPFOLIO
- 2025-03-20 Sold (MLS) $65,000 RMLSA as Distributed by MLS Grid
- 2025-02-17 Contingent — RMLSA as Distributed by MLS Grid
- 2025-02-14 Listed $59,900 RMLSA as Distributed by MLS Grid
- 2024-11-12 Listing Removed — RMLSA as Distributed by MLS Grid
- 2024-09-06 Price Changed — RMLSA as Distributed by MLS Grid
- 2024-06-14 Price Changed — RMLSA as Distributed by MLS Grid
- 2024-05-20 Listed — RMLSA as Distributed by MLS Grid
- 2023-10-17 Relisted — RMLSA as Distributed by MLS Grid
- 2022-08-04 Listing Removed — RMLSA as Distributed by MLS Grid
- 2022-08-02 Listing Removed — RMLSA as Distributed by MLS Grid
- 2022-08-02 Relisted — RMLSA as Distributed by MLS Grid
- 2022-08-02 Listing Removed — RMLSA as Distributed by MLS Grid
- 2022-08-01 Listed — RMLSA as Distributed by MLS Grid
- 2022-05-24 Price Changed $995 RENT.
- 2022-01-07 Sold (Public Records) $75,000 Public Records
- 2022-01-05 Sold (MLS) $50,000 RMLSA as Distributed by MLS Grid
- 2021-12-07 Listed $54,000 RMLSA as Distributed by MLS Grid
Property tax history
+1.6%/yrLatest (2024): $1,884 · -6.7% YoY. Source: county tax records.
Cash-flow waterfall
monthlySold comps — $/sqft
last 12 mo · ≤1 miLoading sold comps…