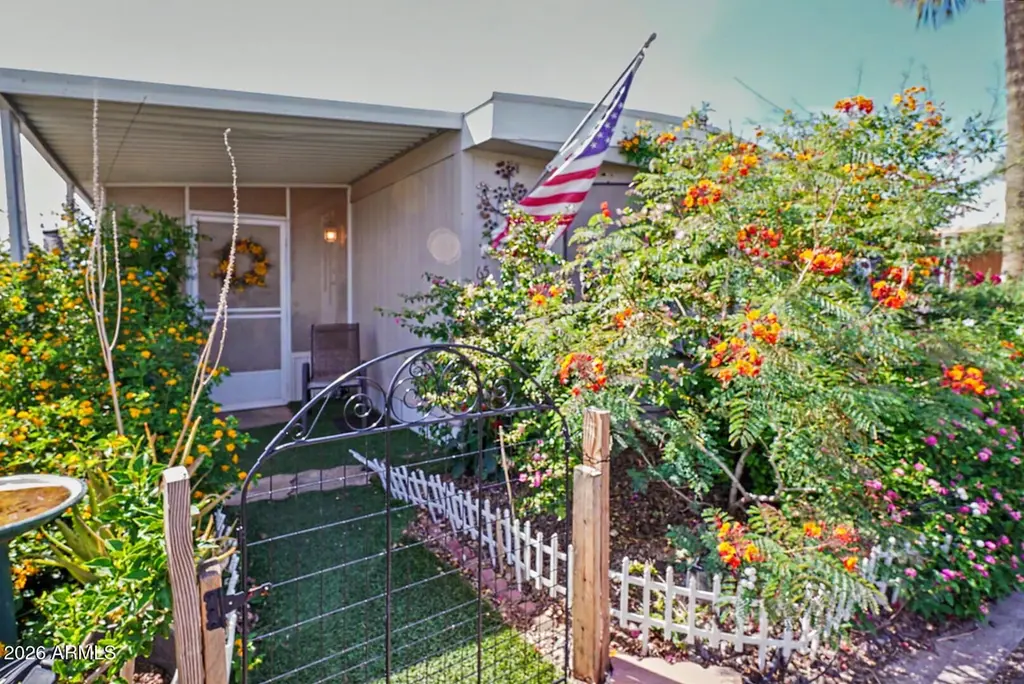
2605 S Tomahawk Rd #65 · Apache Junction, AZ
Flood risk 1/10 · Minimal
- FEMA flood zone
- X (unshaded)
- Chance of flooding over 30 yrs
- 0.0%
- Est. flood insurance / yr
- $507 – $1,088
Fire risk 5/10 · Moderate
- Est. fire insurance / yr
- $610 – $1,132
Heat risk 8/10 · Major
- Hot days now (above 111°F)
- 3 days/yr
- Hot days in 30 yrs
- 9 days/yr
Wind risk 1/10 · Minimal
- Chance of severe wind over 30 yrs
- —
Air-quality risk 3/10 · Minor
- Unhealthy air days now
- 3 days/yr
- Unhealthy air days in 30 yrs
- 4 days/yr
Risk factors via First Street. Map © Google.
Why this score? — see what drove the C+ grade
The composite is a weighted blend of 9 inputs, each scored 0–100. Each bar is that input's sub-score; the figure is the points it added to the 100-point composite (weight × sub-score).
- Cash flow +30.0/30.0
- 1% rule +10.0/10.0
- DSCR +10.0/10.0
- Condition / age +3.8/5.0
- Livability +3.3/5.0
- Rent growth +2.9/5.0
- Schools +1.5/10.0
- ARV discount +0.0/15.0
- Appreciation +0.0/10.0
$42,000
🖨 Deal sheet 📄 Offer letter ✓ Due diligence
Listing remarks
Ready for a quick move-in and packed with charm, this Apache Junction gem is the perfect place to start your next chapter. Stay cool year-round with a brand new AC already installed, then unwind as hummingbirds flutter through the colorful, thoughtfully curated garden just outside your window. This lovingly maintained home offers a peaceful setting that's hard to find. Inside, you'll love the bright and efficient layout with the kitchen and living area up front to capture natural light, while two bedrooms and a bathroom are tucked privately in the back. Located in a smaller gated community with stunning Superstition Mountain views, you'll enjoy amenities designed for an active lifestyle whi
Key facts
- Colorful garden
- Gated community
- Curated garden
Tags
Property features AI
Finance
- Other: Property listed as leasehold
- Financial info: Current financing: Other
- HOA & community: Land lease: $797 monthly; No association fees included; Community pool; Pickleball courts; Community spa (heated); Fitness center
Exterior
- Parking: 1 open parking space; 2 covered parking spaces; 2 carport spaces
- Security: Gated community
- Utilities: City water; Septic (connected)
- Home design: Manufactured/mobile home; Leasehold ownership
- Construction: Metal siding and wood frame construction; Foam roof; Rolled/hot mop roofing
- Exterior features: Screened-in patio(s); Outdoor storage; East/West exposure; Gravel/stone backyard; Synthetic grass front yard; Mountain views
Interior
- Kitchen: Built-in microwave; Refrigerator; Dishwasher; Garbage disposal; Built-in electric oven; Pantry
- Bedrooms: Up to 2 possible bedrooms
- Flooring: Laminate
- Bathrooms: 1 full bathroom (total 1 bathroom)
- Heating & cooling: Heat pump heating; Ceiling fans; Window/wall air conditioning
- Interior features: High-speed internet; Eat-in kitchen; Pantry; Master bedroom with 3/4 bath
- Laundry & utility: Laundry inside
Neighborhood map
What this means for you Summary
Snapshot
- This is a 2-bed/1.0-bath manufactured listed at $42k. Condition is rated good.
Deal economics
- At list price, monthly cash flow is $737 ($9k/yr) — positive.
- The deal already cash-flows at list — no discount required.
- Meets the 1% rule at list price ($1k rent vs $42k).
- Recommended offer: $41k (3.0% below list) — sets the bar for market timing.
- Cap rate 27.3% vs local median 3.5% in Apache Junction — top-decile yield for the area; either an underpriced asset or a hidden risk that comps aren't pricing in. Stress-test before assuming the spread holds.
Location & tenants
- Location reads 66/100 on livability (#70 in AZ) — a middle-class / working-renter tenant base. Strengths: cost of living A+, housing A+; Watch: crime D+, schools F, amenities F.
- Apache Junction Unified District (4443) (suburban): math 15% / reading 20% proficiency, ranked #195 of 249 in AZ (top 78%) — low school quality limits family demand, transient renter base, plan for 1-2y turnover.
- Market conditions: Rents rising (+1.6%/yr); 354 active listings in the ZIP; 8 comparable units currently listed for rent nearby; rentals leasing fast (median 6d on market — plan ~1-2 weeks tenant-placement turnaround); 9,504 units permitted in Pinal County in 2024 (776 in 5+ unit buildings).
Forward outlook
- Local home prices are declining (-3.0%/yr); year-one equity from $290 of loan paydown is wiped out by about $1k of value loss. Plan a longer hold.
- At projected returns (-3.0% appreciation + 1.6% rent growth), your $12k cash investment doubles in ~2 years — after that, you're playing with house money.
Negotiation context
- It's been on market 56 days — a 3% lower offer ($41k) is reasonable based on typical stale-listing flexibility.
Risks & watch-outs
- Climate carrying-cost: moderate wildfire risk; extreme-heat days projected 3→9/yr by 2055 (HVAC capex compounding) — expect insurance premiums to compound above CPI over the hold.
Questions for the listing agent
- It's been on market 56 days. Have you received any prior offers? Is the seller open to a 3% concession, seller financing, or rate buy-down credit?
- Is there a deadline driving the sale (1031 exchange, divorce, estate, relocation)? That informs how much negotiation room exists.
- Schools are F-rated, which usually means shorter tenancies and higher turnover. Who's the typical renter profile here, and what's been the actual vacancy rate?
- Crime grade is D in this area — have there been break-ins, vandalism, or insurance claims at this property in the last 3 years? What carrier currently insures it and at what premium?
- What's the average days-on-market for RENTAL listings here right now (not sales)? A rising rental-DOM trend means longer vacancies and softer asking-rent achievability than the comps imply.
- What's the recent tenant-quality profile in this submarket — average credit score on applications, eviction rate, late-payment / NSF rate, and stable-employment percentage? A property-management company in the area should have these aggregated.
- How much new for-sale + rental construction is in the pipeline within 1–3 miles? Heavy new supply typically softens prices + rents 12–24 months out; constrained supply supports both.
Investment metrics
- 1% rule
- 3.10% ✓
- Cap rate
- 27.35%
- Cash-on-cash
- 75.20%
- DSCR
- 4.35
- GRM
- 2.7
CMA / ARV
- ARV (on-the-fly)
- $28,152
- Comps found
- 10
Show comp detail 10 sales within ~0.75 mi
| Address | Dist | Beds/Ba | Sqft | Sold | Price | $/sf | Match |
|---|---|---|---|---|---|---|---|
| 1517 E 22nd Ave | 0.29mi | 2/1.0 | 780 (-0%) | 4mo | $160,000 | $205 | 83 |
| 2605 S Tomahawk Rd #99 | 0.00mi | 2/1.5 | 896 (+15%) | 3mo | $28,700 | $32 | 71 |
| 2605 S Tomahawk Rd #28 | 0.05mi | 1/1.0 (-1) | 728 (-7%) | 17mo | $26,500 | $36 | 67 |
| 1524 E 23rd Ave | 0.28mi | 2/1.0 | 841 (+8%) | 13mo | $224,000 | $266 | 64 |
| 2605 S Tomahawk Rd #8 | 0.05mi | 2/2.0 | 896 (+15%) | 13mo | $26,500 | $30 | 59 |
| 2348 S Pomo Ave | 0.34mi | 1/1.5 (-1) | 750 (-4%) | 16mo | $239,000 | $319 | 57 |
| 1563 E 23rd Ave | 0.23mi | 1/1.0 (-1) | 705 (-10%) | 24mo | $198,000 | $281 | 48 |
| 1617 S Cortez Rd #26 | 0.68mi | 1/1.0 (-1) | 756 (-3%) | 17mo | $17,000 | $22 | 43 |
| 3405 S Tomahawk Rd #14 | 0.48mi | 2/2.0 | 896 (+15%) | 10mo | $15,000 | $17 | 42 |
| 3405 S Tomahawk Rd #111 | 0.48mi | 2/1.0 | 896 (+15%) | 15mo | $30,000 | $33 | 41 |
Match score weights: distance 35% · size 25% · config 20% · recency 20%. Top-matched comps best support the ARV.
Projected returns pro-forma
-3.0% appreciation · 1.57% rent growth · sell at horizon
- IRR
- 73.5%
- Equity multiple
- 4.26×
- Total profit
- $38,308
- Equity at exit
- $6,262
- IRR
- 76.9%
- Equity multiple
- 8.36×
- Total profit
- $86,524
- Equity at exit
- $3,631
Cash invested: $11,760 (down + closing). Projections, not guarantees.
Landlord ↔ Tenant lean methodology
- Overall (STATE)
- 87 Strongly Landlord-Friendly
- State Arizona
- 87 Strongly Landlord-Friendly · R+3
- County
- — inherits STATE
- City
- — inherits STATE
ZIP-level market 85119
- Home prices YoY
- -33.5%
- Rents YoY
- 1.6%
- Active inventory
- 354
- Price-to-rent
- 2.7×
Monthly cashflow live
- Estimated rent
- $1,300 high interval (Pro) →
- Mortgage (P&I)
- −$220
- Tax est. 1.5%
- −$52 /mo · $630/yr
- Insurance
- −$18
- HOA
- −$0
- Vacancy / Maint / Mgmt
- −$273
- Net cashflow
- $737
Break-even live
UW: 25.0% down · 7.5% · 30yr · 1.5% tax · 5.0% vac · 8.0% maint · 8.0% mgmt
Financing live
Cash to close
- Down payment
- $10,500
- Closing costs
- $1,260
- Reserves months
- —
- Total cash needed
- —
Loan-product check · same deal, 3 products live
Conventional
25% down · 7.5% · 30yr
- Down + closing
- —
- Monthly P&I
- —
- Monthly cashflow
- —
- DSCR
- —
- Eligible?
- —
Personal DTI + credit; lowest rate.
DSCR
20% down · 8.5% · 30yr
- Down + closing
- —
- Monthly P&I
- —
- Monthly cashflow
- —
- DSCR
- —
- Eligible?
- —
No personal income docs; deal must DSCR.
Hard money
10% down · 12.0% · 12mo
- Down + closing
- —
- Monthly P&I
- —
- Monthly cashflow
- —
- DSCR
- —
- Eligible?
- —
Short-term bridge; refi at stabilization.
Rent comps 8 comps
| Address | Beds | Baths | Sqft | Rent | $/sqft | DOM | Units | Dist |
|---|---|---|---|---|---|---|---|---|
| 1540 E 25th Ave Apache Junction, AZ | 2.0 | 1.0 | 850 | $995 | $1.17 | 12d | 1 | 0.15mi |
| 501 E Quail Ave Apache Junction, AZ | 2.0 | 1.0 | 720 | $1,150 | $1.60 | 3d | 1 | 0.80mi |
| 501 E Quail Ave Apache Junction, AZ | 2.0 | 1.0 | 720 | $1,150 | $1.60 | 5d | 1 | 0.80mi |
| 403 E Quail Ave Apache Junction, AZ | 2.0 | 1.0 | 800 | $1,350 | $1.69 | 4d | 1 | 0.85mi |
| 1297 E Broadway Ave Apache Junction, AZ | 1.0–3.0 | 1.0–2.0 | 954 | $1,937 | $2.03 | 1d | 29 | 1.03mi |
| 975 S Royal Palm Rd Apache Junction, AZ | 2.0–3.0 | 2.0 | 1000 | $1,325 | $1.32 | 2d | 13 | 1.14mi |
| 452 E 10th Ave Unit 104 Apache Junction, AZ | 2.0 | 1.0 | 783 | $1,000 | $1.28 | 22d | 1 | 1.26mi |
| 2061 S Apache Dr Unit 1 Apache Junction, AZ | 2.0 | 1.0 | 800 | $1,095 | $1.37 | 5d | 1 | 1.27mi |
Listing history 15 events
-
2026-06-18days on market $42,000 Active 56 DOM
-
2026-06-17days on market $42,000 Active 55 DOM
-
2026-06-16days on market $42,000 Active 54 DOM
-
2026-06-15days on market $42,000 Active 53 DOM
-
2026-06-13days on market $42,000 Active 51 DOM
-
2026-06-09days on market $42,000 Active 47 DOM
-
2026-06-08days on market $42,000 Active 46 DOM
-
2026-06-07days on market $42,000 Active 45 DOM
-
2026-06-04days on market $42,000 Active 42 DOM
-
2026-06-03days on market $42,000 Active 41 DOM
-
2026-06-02days on market $42,000 Active 40 DOM
-
2026-06-01days on market $42,000 Active 39 DOM
-
2026-05-31days on market $42,000 Active 38 DOM
-
2026-05-08price $42,000
-
2026-04-22$40,000 Active
ⓘ Source: listings_history table (triggers on properties + properties_extension) + one-shot
backfill from property_details.listing_events for pre-trigger history.
Climate risk First Street
- Flood 1/10 Low FEMA zone X (unshaded) · 0% chance over 30 yrs
- Wildfire 5/10 Major
- Heat 8/10 Severe 3 d/yr ≥111°F today · 9 d/yr by 30 yrs out
- Wind 1/10 Low
- Air quality 3/10 Moderate 3 unhealthy d/yr today · 4 by 30 yrs out
Nearby sold comps map
Loading sold comps map…
Walkable amenities ~0.75 mi
Loading nearby amenities…
Taxation est. · year 1
- Rental income
- $15,604
- − Mortgage interest
- −$2,353
- − Property taxes
- −$630
- − Insurance
- −$210
- − Repairs & maintenance
- −$1,248
- − Management
- −$1,248
- − Depreciation
- −$1,222
- Taxable income
- $8,693
- Est. tax owed @ 24.0%
- −$2,086
- After-tax cash flow
- $6,758/yr
For passive investors: Depreciation is non-cash, so a rental often shows a tax loss while cash-flowing — sheltering income. Rental losses are passive: they offset passive income freely, and up to $25,000/yr can offset ordinary (W-2) income if you actively participate and your MAGI is under $100k (phasing out to $0 by $150k); unused losses carry forward. On sale, claimed depreciation is recaptured at up to 25%, and gains may owe capital-gains tax (a 1031 exchange can defer both). Figures are a year-1 estimate at your 24.0% rate — not tax advice; consult a CPA.
Condition & rehab AI · 11 photos
This home is in good condition with a good condition score of 75. It has a cosmetic rehab level and requires minor maintenance. The highest-ROI updates would be painting the exterior siding and replacing the window screens to enhance curb appeal and improve comfort for tenants.
Value-add opportunities
- Resale Paint exterior siding — Enhances curb appeal and can add value to the home.
- Rental Replace window screens — Improves comfort and energy efficiency for tenants.
Renovation cost estimate screening
Value-add ROI direction
- Resale Paint exterior siding — Enhances curb appeal and can add value to the home. ↑
- Rental Replace window screens — Improves comfort and energy efficiency for tenants. ↑
ⓘ Cost ranges are severity-bucket heuristics (US national rule-of-thumb). Get contractor quotes + a written scope before underwriting a rehab budget.
Schools (NCES district)
- District
- Apache Junction Unified District (4443)
- NCES district ID
- 0400790
- Math proficiency
- 15% ▼ -17.00%
- Reading proficiency
- 20% ▼ -13.00%
- Median HH income
- $44,930
- Composite
- 15.34/100
- National rank
- #9325
- State rank
- #195 of 249 in AZ
Livability — Apache Junction
- Score
- 66/100
- State rank
- #70
- US rank
- #11242
Category grades
Schools grade is shown separately in the Schools card above.
Census & demographics
- County
- Pinal County · 399,947 people
- City population
- 56,611
- Metro
- Phoenix-Mesa-Chandler, AZ
- Population (ZIP)
- 25,420
- Household income
- $71,585
- Rent vs Own
- Severe rent burden
- 305.0
Population outlook (Pinal County) Hauer SSP2
- Today (2025)
- 437,574 people
- By 2030
- 446,903 · +2.1%
- By 2040
- 452,589 · +3.4%
- By 2050
- 444,126 · +1.5%
- By 2075
- 430,300 · -1.7%
- By 2100
- 393,536 · -10.1%
Race, ethnicity, and origin ACS 2023
- Neighborhood character
- Predominantly White (74%)
- Race & ethnicity
- White 74% Hispanic / Latino 19% Two or more races 12% Black 2% Asian 1%
- Hispanic origin (detail)
- Mexican 17%
- Common ancestry
- Slovak 5% Portuguese 3% Lithuanian 3%
- Foreign-born
- 8% · Canada
- Languages at home
- 87% English-only · Spanish 11%
Political lean MEDSL · Pinal
- 2024 margin
- Strong R (+22.1) · D 38.5% · R 60.6%
- 2008→2024 swing
- -7.6pp toward R · 2008: -14.5pp · 2024: -22.1pp
- All cycles
- 2024: R+22.1 2020: R+17.3 2016: R+19.3 2012: R+17.1 2008: R+14.5
Not yet ingested
- Civics
- —
Market trends
- HPI YoY
- ▼ -138.19%
- Current HPI
- 274.3808
- Rent YoY
- ▲ 1.57%
- Metro
- Phoenix-Mesa-Chandler, AZ
- State GDP YoY
- ▲ 4.54%
- F500 in state
- 20
Industry mix (Fortune 500 HQ in AZ)
| Industry | F500 HQs | Revenue |
|---|---|---|
| Technology | 2 | $13B |
|
||
| Mining / Metals | 1 | $23B |
|
||
| Environmental Services | 1 | $16B |
|
||
| Metals / Steel | 1 | $14B |
|
||
| Technology Distribution | 1 | $9B |
|
||
| Homebuilding | 1 | $8B |
|
||
Price history
+5.0% since first listed2 events — show timeline
- 2026-05-08 Price Changed $42,000 ARMLS
- 2026-04-22 Listed $40,000 ARMLS
Cash-flow waterfall
monthlySold comps — $/sqft
last 12 mo · ≤1 miLoading sold comps…