 Fourplex
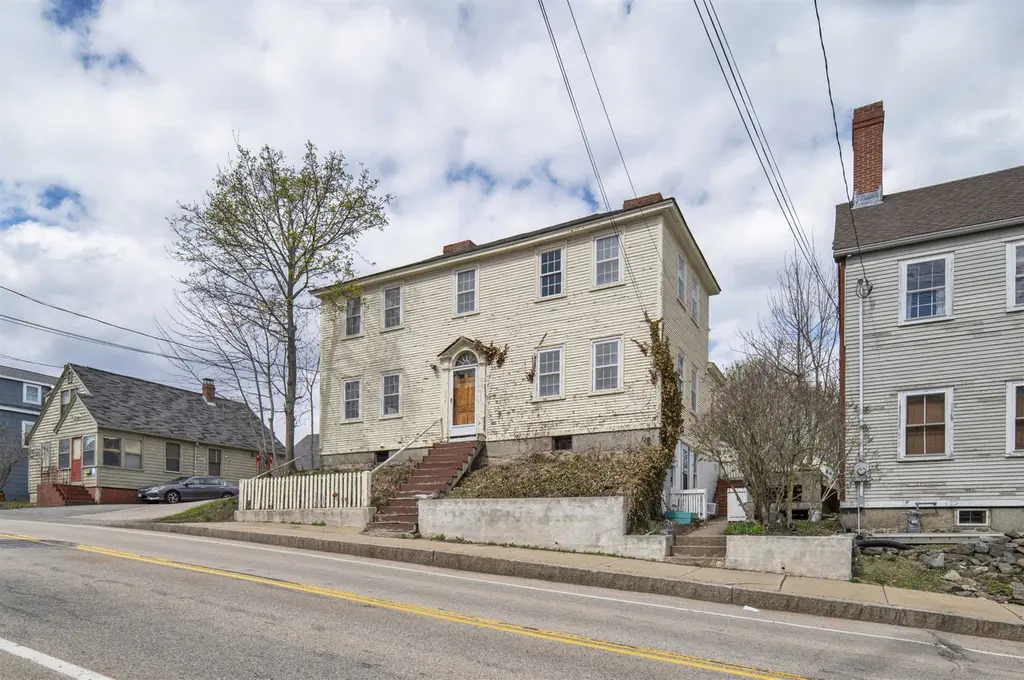
357 Maplewood Ave · Portsmouth, NH
Flood risk 1/10 · Minimal
- FEMA flood zone
- X (unshaded)
- Chance of flooding over 30 yrs
- 0.0%
- Est. flood insurance / yr
- $473 – $860
Fire risk 1/10 · Minimal
- Est. fire insurance / yr
- $507 – $941
Heat risk 5/10 · Moderate
- Hot days now (above 94°F)
- 7 days/yr
- Hot days in 30 yrs
- 16 days/yr
Wind risk 6/10 · Moderate
- Chance of severe wind over 30 yrs
- 65.0%
Air-quality risk 2/10 · Minimal
- Unhealthy air days now
- 2 days/yr
- Unhealthy air days in 30 yrs
- 2 days/yr
Risk factors via First Street. Map © Google.
Why this score? — see what drove the B grade
The composite is a weighted blend of 9 inputs, each scored 0–100. Each bar is that input's sub-score; the figure is the points it added to the 100-point composite (weight × sub-score).
- Cash flow +28.9/30.0
- DSCR +10.0/10.0
- 1% rule +7.6/10.0
- ARV discount +7.5/15.0
- Schools +5.8/10.0
- Livability +4.3/5.0
- Rent growth +3.6/5.0
- Condition / age +2.5/5.0
- Appreciation +0.0/10.0
$1,200,800
🖨 Deal sheet 📄 Offer letter ✓ Due diligence
Multi-family units
County records classify this as Multi-Family (5+ Unit). Listing-text estimate: 4 units. estimate disagrees with records
5+ unit building — per-unit beds/baths from public records are typically unavailable; the breakdown below (if shown) is an estimate from the listing text.
Listing remarks
Investors, builders, and contractors—don’t miss this value-add 4-unit multifamily opportunity at 357 Maplewood Ave, Portsmouth, NH, located within walking distance to downtown Portsmouth. Prime chance to renovate and reposition in one of the Seacoast’s most desirable rental markets. The property needs significant updating, making it an ideal project for an experienced contractor or builder looking to add sweat equity and create long-term upside. Convenient to shops, dining, waterfront, and commuter routes. Bring your vision and transform this multi-family into a standout investment.
Key facts
- Convenient to shops
- Convenient to dining
- Significant updating
Tags
Property features AI
Finance
- Other: Total units: 4 (two 1-bed, one 2-bed, one 3-bed); Unit 1 is a basement studio rented month-to-month; Unit 3 and Unit 1 are month-to-month; Unit 2 and others listed as annual or heat included per unit details
- Financial info: Operating expenses include heat, insurance, maintenance, snow removal, utilities, and water/sewer
Exterior
- Parking: Paved driveway
- Utilities: Public water; Public sewer; Cable and internet (cable) available; Electric service via circuit breakers
- Home design: Apartment building / New Englander style; Existing construction; Built in 1890
- Construction: Clapboard exterior; Shingle (asphalt) roof; Built in 1890
- Exterior features: Paved driveway; Sidewalks; Property located in town near shopping and hospital; Surveyed
Interior
- Kitchen: Unit 4: Dishwasher, Electric range
- Bedrooms: Unit 1: 1 bedroom (basement studio); Unit 2: 2 bedrooms; Unit 3: 1 bedroom; Unit 4: 3 bedrooms
- Flooring: Carpet, vinyl, and wood flooring
- Bathrooms: Unit 1: 1 bath; Unit 2: 1 bath; Unit 3: 1 bath; Unit 4: 2 baths
- Heating & cooling: Heating: Oil and hot water systems; Cooling: None listed
- Interior features: Unfinished walk-up basement; Heat included for some units; Laundry hookup in Unit 4; Deed and property disclosure available
- Laundry & utility: Unit 4: Laundry hookup; Electric service (circuit breaker panels); Hot water heating in some units; Oil-fired heating in some units
Neighborhood map
What this means for you Summary
Snapshot
- This is a 4 × 7-bed/5.0-bath units multifamily listed at $1.20M.
Deal economics
- At list price, monthly cash flow is $4k ($49k/yr) — positive. Per door: $1k/mo.
- The deal already cash-flows at list — no discount required.
- Meets the 1% rule at list price ($15k rent vs $1.20M).
- Cap rate 10.4% vs local median 1.9% in Portsmouth — top-decile yield for the area; either an underpriced asset or a hidden risk that comps aren't pricing in. Stress-test before assuming the spread holds.
Location & tenants
- Location reads 86/100 on livability (#5 in NH, #354 nationally) — a professional / high-income tenant draw. Strengths: commute A+, employment A+, health & safety A+; Watch: cost of living F.
- Portsmouth School District (suburban): math 60% / reading 72% proficiency, ranked #13 of 98 in NH (top 13%) — acceptable for families but not a draw, mixed tenant base, ~2y average lease; only 18% free/reduced lunch — higher-income household profile.
- Zoned schools: New Franklin School (math 77% / reading 87%, grade A+, #2 of 263 statewide, top 0%, 259 students, 19% FRL) — zoned schools at 19% FRL track the district average.
- Zoned-school proficiency averages 82% at this address vs 66% district-wide (+16 pts) — the actual schools serving this property are materially stronger than the Portsmouth School District average implies; a family-tenant draw the district grade alone would hide.
- Market conditions: Rents rising fast (+4.4%/yr); 157 active listings in the ZIP; solid renter incomes; 1,276 units permitted in Rockingham County in 2024 (593 in 5+ unit buildings).
- At $15,182/mo this rent would consume 171% of the median local household income ($107k/yr) (locally 843% of renters already pay >50% of income on rent) — very limited rent-growth headroom before tenants either downsize or default.
Forward outlook
- Local home prices are declining (-3.0%/yr); year-one equity from $8k of loan paydown is wiped out by about $36k of value loss. Plan a longer hold.
- At projected returns (-3.0% appreciation + 4.4% rent growth), your $336k cash investment doubles in ~8 years — after that, you're playing with house money.
Negotiation context
- Only 9 days on market — expect competitive offers; lowballing is unlikely to land.
Risks & watch-outs
- Watch-outs: built in 1890 — expect roof / HVAC / electrical / plumbing capex.
- Climate carrying-cost: major wind risk, 65% chance of damaging wind over 30y; extreme-heat days projected 7→16/yr by 2055 (HVAC capex compounding) — expect insurance premiums to compound above CPI over the hold.
Questions for the listing agent
- Can we see the unit-by-unit rent roll, current vacancy, and any below-market leases? What's the average tenancy length?
- What capital expenditures (roof, boiler, parking lot, exteriors) have been made in the last 5 years, and what's planned in the next 2?
- Built in 1890 — when were the roof, HVAC, electrical panel, plumbing, and water heater last replaced?
- Is there a deadline driving the sale (1031 exchange, divorce, estate, relocation)? That informs how much negotiation room exists.
- Schools are A-rated — typically a magnet for longer-tenancy family renters. What's the average tenant stay here, and is there a school-zone premium baked into asking?
- What's the average days-on-market for RENTAL listings here right now (not sales)? A rising rental-DOM trend means longer vacancies and softer asking-rent achievability than the comps imply.
- What's the recent tenant-quality profile in this submarket — average credit score on applications, eviction rate, late-payment / NSF rate, and stable-employment percentage? A property-management company in the area should have these aggregated.
- How much new apartment / multifamily construction is in the pipeline within 1–3 miles? Heavy new supply (>2% of stock underway) typically softens rents 12–24 months out; light construction supports rent growth.
Investment metrics
- 1% rule
- 1.26% ✓
- Cap rate
- 10.37%
- Cash-on-cash
- 14.55%
- DSCR
- 1.65
- GRM
- 6.6
CMA / ARV
No comps found within radius.
Projected returns pro-forma
-3.0% appreciation · 4.41% rent growth · sell at horizon
- IRR
- 6.5%
- Equity multiple
- 1.26×
- Total profit
- $86,840
- Equity at exit
- $179,043
- IRR
- 17.1%
- Equity multiple
- 2.49×
- Total profit
- $502,094
- Equity at exit
- $103,823
Cash invested: $336,224 (down + closing). Projections, not guarantees.
Landlord ↔ Tenant lean methodology
- Overall (STATE)
- 56 Moderately Landlord-Leaning
- State New Hampshire
- 56 Moderately Landlord-Leaning · D+1
- County
- — inherits STATE
- City
- — inherits STATE
ZIP-level market 03801
- Rents YoY
- 4.4%
- Active inventory
- 157
- Price-to-rent
- 26.4×
Monthly cashflow live
- Estimated rent
- $15,182 medium interval (Pro) →
- Mortgage (P&I)
- −$6,297
- Tax from tax record
- −$1,121 /mo · $13,447/yr
- Insurance
- −$500
- HOA
- −$0
- Vacancy / Maint / Mgmt
- −$3,188
- Net cashflow
- $4,076
Break-even live
4-unit breakdown (identical units grouped — click to expand)
| Units | Beds | Baths | Est. rent |
|---|---|---|---|
| 4× units | 7 | 5 | $15,184 |
| #1 | 7 | 5 | $3,796 |
| #2 | 7 | 5 | $3,796 |
| #3 | 7 | 5 | $3,796 |
| #4 | 7 | 5 | $3,796 |
| Total (4 units) | $15,182 | ||
UW: 25.0% down · 7.5% · 30yr · 1.5% tax · 5.0% vac · 8.0% maint · 8.0% mgmt
Financing live
Cash to close
- Down payment
- $300,200
- Closing costs
- $36,024
- Reserves months
- —
- Total cash needed
- —
Loan-product check · same deal, 3 products live
Conventional
25% down · 7.5% · 30yr
- Down + closing
- —
- Monthly P&I
- —
- Monthly cashflow
- —
- DSCR
- —
- Eligible?
- —
Personal DTI + credit; lowest rate.
DSCR
20% down · 8.5% · 30yr
- Down + closing
- —
- Monthly P&I
- —
- Monthly cashflow
- —
- DSCR
- —
- Eligible?
- —
No personal income docs; deal must DSCR.
Hard money
10% down · 12.0% · 12mo
- Down + closing
- —
- Monthly P&I
- —
- Monthly cashflow
- —
- DSCR
- —
- Eligible?
- —
Short-term bridge; refi at stabilization.
Listing history 7 events
-
2026-06-18days on market $1,200,800 Active 9 DOM
-
2026-06-17days on market $1,200,800 Active 8 DOM
-
2026-06-16days on market $1,200,800 Active 7 DOM
-
2026-06-15days on market $1,200,800 Active 6 DOM
-
2026-06-13days on market $1,200,800 Active 4 DOM
-
2026-06-10remarks 589-char remark
-
2026-06-10$1,200,800 Active 1 DOM
ⓘ Source: listings_history table (triggers on properties + properties_extension) + one-shot
backfill from property_details.listing_events for pre-trigger history.
Tax reassessment forecast NH · Partial reset (capped growth)
- Current annual tax
- $13,447 · $1,121/mo
- Projected year-2 tax
- $19,812 · $1,651/mo
- Expected delta
- +$6,365/yr (+$530/mo · 47.3%)
ⓘ Screening estimate from a state-policy table — verify with the county assessor before closing.
Climate risk First Street
- Flood 1/10 Low FEMA zone X (unshaded) · 0% chance over 30 yrs
- Wildfire 1/10 Low
- Heat 5/10 Major 7 d/yr ≥94°F today · 16 d/yr by 30 yrs out
- Wind 6/10 Major 65% chance of damaging wind over 30 yrs
- Air quality 2/10 Low 2 unhealthy d/yr today · 2 by 30 yrs out
Nearby sold comps map
Loading sold comps map…
Walkable amenities ~0.75 mi
Loading nearby amenities…
Taxation est. · year 1
- Rental income
- $182,184
- − Mortgage interest
- −$67,263
- − Property taxes
- −$13,447
- − Insurance
- −$6,004
- − Repairs & maintenance
- −$14,575
- − Management
- −$14,575
- − Depreciation
- −$34,932
- Taxable income
- $31,388
- Est. tax owed @ 24.0%
- −$7,533
- After-tax cash flow
- $41,376/yr
For passive investors: Depreciation is non-cash, so a rental often shows a tax loss while cash-flowing — sheltering income. Rental losses are passive: they offset passive income freely, and up to $25,000/yr can offset ordinary (W-2) income if you actively participate and your MAGI is under $100k (phasing out to $0 by $150k); unused losses carry forward. On sale, claimed depreciation is recaptured at up to 25%, and gains may owe capital-gains tax (a 1031 exchange can defer both). Figures are a year-1 estimate at your 24.0% rate — not tax advice; consult a CPA.
Schools (NCES district)
- District
- Portsmouth School District
- NCES district ID
- 3305820
- Math proficiency
- 60% ▼ -9.00%
- Reading proficiency
- 72% ▼ -3.00%
- Median HH income
- $67,302
- Composite
- 57.66/100
- National rank
- #1060
- State rank
- #13 of 98 in NH
Livability — Portsmouth
- Score
- 86/100
- State rank
- #5
- US rank
- #354
Category grades
Schools grade is shown separately in the Schools card above.
Census & demographics
- Census place
- Portsmouth, NH
- County
- Rockingham County · 137,526 people
- City population
- 23,484
- Metro
- Boston-Cambridge-Newton, MA-NH
- Population (ZIP)
- 23,484
- Household income
- $106,756
- Rent vs Own
- Severe rent burden
- 843.0
Population outlook (Rockingham County) Hauer SSP2
- Today (2025)
- 316,118 people
- By 2030
- 320,929 · +1.5%
- By 2040
- 323,358 · +2.3%
- By 2050
- 314,977 · -0.4%
- By 2075
- 297,686 · -5.8%
- By 2100
- 256,363 · -18.9%
Race, ethnicity, and origin ACS 2023
- Neighborhood character
- Predominantly White (87%)
- Race & ethnicity
- White 87% Two or more races 5% Asian 4% Hispanic / Latino 3%
- Common ancestry
- Lithuanian 5% Slovak 5% Romanian 3%
- Foreign-born
- 9% · Canada, China, South Korea
- Languages at home
- 91% English-only · Other Indo-European 3% Spanish 2% Chinese 1%
Political lean MEDSL · Rockingham
- 2024 margin
- Toss-up / Even · D 48.3% · R 50.8%
- 2008→2024 swing
- -3.5pp toward R · 2008: 1.1pp · 2024: -2.4pp
- All cycles
- 2024: R+2.4 2020: D+2.1 2016: R+5.8 2012: R+4.5 2008: D+1.1
Not yet ingested
- Civics
- —
Market trends
- HPI YoY
- ▼ -281.76%
- Current HPI
- 383.8843
- Rent YoY
- ▲ 4.41%
- Metro
- Boston-Cambridge-Newton, MA-NH
- State GDP YoY
- —
- F500 in state
- 0
Price history
1 event — show timeline
- 2026-06-09 Listed $1,200,800 PrimeMLS
Property tax history
+2.5%/yrLatest (2025): $13,447 · +2.9% YoY. Source: county tax records.
Cash-flow waterfall
monthlySold comps — $/sqft
last 12 mo · ≤1 miLoading sold comps…