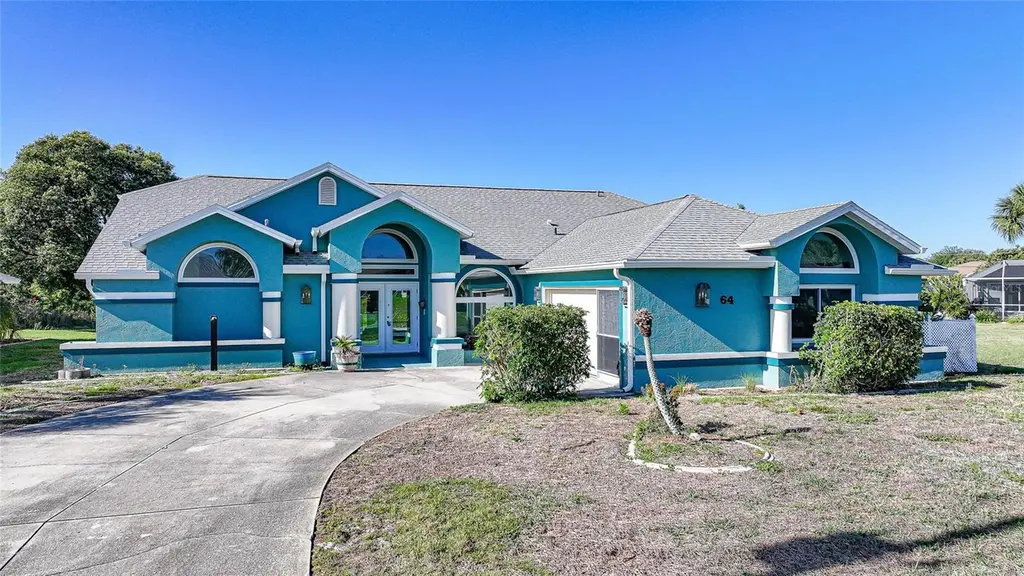
64 Sportsman Ct · Rotonda, FL
Flood risk 6/10 · Moderate
- FEMA flood zone
- X (unshaded)
- Chance of flooding over 30 yrs
- 0.57%
- Est. flood insurance / yr
- $507 – $1,088
Fire risk 1/10 · Minimal
- Est. fire insurance / yr
- $947 – $1,759
Heat risk 10/10 · Severe
- Hot days now (above 107°F)
- 7 days/yr
- Hot days in 30 yrs
- 29 days/yr
Wind risk 10/10 · Severe
- Chance of severe wind over 30 yrs
- 99.0%
Air-quality risk 2/10 · Minimal
- Unhealthy air days now
- 1 days/yr
- Unhealthy air days in 30 yrs
- 1 days/yr
Risk factors via First Street. Map © Google.
Why this score? — see what drove the C grade
The composite is a weighted blend of 9 inputs, each scored 0–100. Each bar is that input's sub-score; the figure is the points it added to the 100-point composite (weight × sub-score).
- Cash flow +15.3/30.0
- ARV discount +15.0/15.0
- Appreciation +5.6/10.0
- DSCR +4.7/10.0
- Schools +4.6/10.0
- Livability +3.4/5.0
- 1% rule +3.3/10.0
- Condition / age +2.5/5.0
- Rent growth +2.4/5.0
$375,000
🖨 Deal sheet (PDF) 📄 Offer letter ✓ Due diligence
Listing remarks
Under contract-accepting backup offers. Virtually Staged. This 3 bedroom, 3 bathroom pool home with a 2-car garage offers 2,159 square feet under air in the highly sought-after golf community of Rotonda West, presenting a great opportunity to enjoy the Florida lifestyle while adding your own personal touches. A traditional split floor plan provides both functionality and privacy, with double glass front doors opening to a welcoming view of the pool and tranquil pond beyond. Cathedral ceilings elevate the main living space, creating an open and airy feel, while the spacious kitchen features a center island and ample room for gathering. The family room is filled with natural light from archit
Key facts
- Pool bath
- Split floor plan
- Cathedral ceilings
Tags
Property features AI
Finance
- Other: Lot size approximately 0.33 acres (1/4 to less than 1/2 acre); Concrete/paved road access; Lake view with lake access; Living area approximately 2,159 (per public records); Total building area approximately 2,949 (per public records)
- HOA & community: ROTONDA GRANDE PROPERTY SERVICES HOA; HOA required; $190 annually (approximately $15.83/month); Pets allowed
Exterior
- Parking: Attached garage; 2-car garage; Garage faces side
- Utilities: Public water; Public sewer; Public utilities
- Home design: Single family residence; One story; Residential property; Faces northeast
- Construction: Block and stucco construction; Shingle roof; Slab foundation; Built on one level
- Exterior features: Hurricane shutters; Rain gutters; Private pool with screen enclosure and tile
Interior
- Kitchen: Dishwasher; Microwave; Range; Refrigerator
- Bedrooms: 3 bedrooms
- Flooring: Carpet; Tile
- Bathrooms: 3 full bathrooms
- Heating & cooling: Central heating (electric); Central air conditioning
- Interior features: Ceiling fans; Living room/dining room combo; Open floorplan; Vaulted ceilings
- Laundry & utility: Dedicated laundry room
Neighborhood map
What this means for you Summary
Snapshot
- This is a 3-bed/3.0-bath single-family listed at $375k.
Deal economics
- At list price, monthly cash flow is $139 ($2k/yr) — positive.
- The deal already cash-flows at list — no discount required.
- To meet the 1% rule (rent ≥ 1% of price), the offer needs to be $311k (17.0% below list).
- Recommended offer: $311k (17.0% below list) — sets the bar for 1% rule.
- Cap rate 6.7% vs local median 3.1% in Rotonda — top-decile yield for the area; either an underpriced asset or a hidden risk that comps aren't pricing in. Stress-test before assuming the spread holds.
Location & tenants
- Location reads 67/100 on livability (#548 in FL) — a middle-class / working-renter tenant base. Strengths: crime A+, housing A-, cost of living B+; Watch: amenities F, commute F, health & safety D-.
- Charlotte (suburban): math 54% / reading 54% proficiency, ranked #22 of 73 in FL (top 30%) — acceptable for families but not a draw, mixed tenant base, ~2y average lease.
- Zoned schools: Vineland Elementary School (math 74% / reading 67%, grade A-, #333 of 2,144 statewide, top 16%, 579 students, 45% FRL); Lemon Bay High School (math 50% / reading 56%, grade C-, #148 of 667 statewide, top 23%, 1,360 students, 28% FRL) — zoned schools average 37% FRL vs 54% district-wide (17 pts lower); this property's tenant base skews higher-income than the district average.
- Market conditions: Rents soft (-0.2%/yr); 863 active listings in the ZIP; 29 comparable units currently listed for rent nearby; rentals at typical pace (median 22d on market — plan ~3-4 weeks tenant-placement turnaround); solid renter incomes; 4,585 units permitted in Charlotte County in 2024 (703 in 5+ unit buildings).
- At $3,112/mo this rent would consume 47% of the median local household income ($80k/yr) (locally 91% of renters already pay >50% of income on rent) — very limited rent-growth headroom before tenants either downsize or default.
Forward outlook
- In year one you build about $7k of equity ($3k loan paydown + $5k appreciation (1.2% local appreciation)).
- Charlotte County population projected at +24% by 2050 — long-run rental-demand tailwind backs the buy-and-hold thesis.
- By year 5, paydown + projected appreciation supports a ~$33k cash-out refi (75% LTV) — recoverable capital for the next deal without selling this one.
Negotiation context
- It's been on market 52 days — a 3% lower offer ($364k) is reasonable based on typical stale-listing flexibility.
- Current owner paid $265k; 42% above their basis — modest negotiation headroom, anchor on the comps not their cost.
Risks & watch-outs
- Climate carrying-cost: major flood risk; severe wind risk, 99% chance of damaging wind over 30y; extreme-heat days projected 7→29/yr by 2055 (HVAC capex compounding) — expect insurance premiums to compound above CPI over the hold.
Questions for the listing agent
- It's been on market 52 days. Have you received any prior offers? Is the seller open to a 17% concession, seller financing, or rate buy-down credit?
- What does the HOA fee cover, when was the last increase, and are there any pending special assessments or reserve-fund shortfalls?
- Is there a deadline driving the sale (1031 exchange, divorce, estate, relocation)? That informs how much negotiation room exists.
- Schools are D-rated, which usually means shorter tenancies and higher turnover. Who's the typical renter profile here, and what's been the actual vacancy rate?
- What's the average days-on-market for RENTAL listings here right now (not sales)? A rising rental-DOM trend means longer vacancies and softer asking-rent achievability than the comps imply.
- What's the recent tenant-quality profile in this submarket — average credit score on applications, eviction rate, late-payment / NSF rate, and stable-employment percentage? A property-management company in the area should have these aggregated.
- How much new for-sale + rental construction is in the pipeline within 1–3 miles? Heavy new supply typically softens prices + rents 12–24 months out; constrained supply supports both.
Investment metrics
- 1% rule
- 0.83% ✗
- Cap rate
- 6.74%
- Cash-on-cash
- 1.59%
- DSCR
- 1.07
- GRM
- 10.0
CMA / ARV
- ARV (on-the-fly)
- $453,390
- Comps found
- 12
Show comp detail 12 sales within ~0.75 mi
| Address | Dist | Beds/Ba | Sqft | Sold | Price | $/sf | Match |
|---|---|---|---|---|---|---|---|
| 46 Sportsman Ct | 0.14mi | 3/2.0 | 2,022 (-6%) | 3mo | $439,000 | $217 | 76 |
| 243 Mariner Ln | 0.31mi | 4/2.0 (+1) | 2,169 (+0%) | 3mo | $358,000 | $165 | 73 |
| 32 Sportsman Ter | 0.48mi | 3/2.0 | 2,135 (-1%) | 3mo | $355,000 | $166 | 70 |
| 251 Rotonda Blvd N | 0.24mi | 3/2.0 | 1,906 (-12%) | 1mo | $401,000 | $210 | 64 |
| 74 Broadmoor Ln | 0.32mi | 3/2.0 | 1,866 (-14%) | 2mo | $425,000 | $228 | 57 |
| 231 Broadmoor Ln | 0.68mi | 4/3.0 (+1) | 2,252 (+4%) | 1mo | $442,500 | $196 | 56 |
| 682 Boundary Blvd | 0.65mi | 3/2.0 | 2,000 (-7%) | 1mo | $466,000 | $233 | 53 |
| 11058 Gulfstream Blvd | 0.55mi | 3/2.0 | 1,934 (-10%) | 1mo | $365,000 | $189 | 52 |
| 44 Sportsman Ln | 0.44mi | 3/2.0 | 1,840 (-15%) | 2mo | $382,000 | $208 | 50 |
| 239 Broadmoor Ln | 0.68mi | 3/2.0 | 1,900 (-12%) | 1mo | $495,000 | $261 | 43 |
| 11101 Sandrift Ave | 0.57mi | 3/2.0 | 1,844 (-15%) | 7mo | $749,000 | $406 | 40 |
| 188 Broadmoor Ln | 0.73mi | 3/2.0 | 1,910 (-12%) | 6mo | $390,000 | $204 | 38 |
Match score weights: distance 35% · size 25% · config 20% · recency 20%. Top-matched comps best support the ARV.
Projected returns pro-forma
1.25% appreciation · 0.0% rent growth · sell at horizon
- IRR
- 2.1%
- Equity multiple
- 1.11×
- Total profit
- $11,255
- Equity at exit
- $132,921
- IRR
- 4.9%
- Equity multiple
- 1.59×
- Total profit
- $61,647
- Equity at exit
- $180,495
Cash invested: $105,000 (down + closing). Projections, not guarantees.
Landlord ↔ Tenant lean methodology
- Overall (STATE)
- 87 Strongly Landlord-Friendly
- State Florida
- 87 Strongly Landlord-Friendly · R+3
- County
- — inherits STATE
- City
- — inherits STATE
ZIP-level market 33947
- Home prices YoY
- 0.4%
- Rents YoY
- -0.2%
- Active inventory
- 863
- Price-to-rent
- 10.0×
Monthly cashflow live
- Estimated rent
- $3,112 high interval (Pro) →
- Mortgage (P&I)
- −$1,967
- Tax from tax record
- −$182 /mo · $2,178/yr
- Insurance
- −$156
- HOA
- −$15
- Vacancy / Maint / Mgmt
- −$654
- Net cashflow
- $139
Break-even live
Sensitivity live
| Price | -10% $352 | -5% $245 | +0% $139 | +5% $33 | +10% $-73 |
|---|---|---|---|---|---|
| Rent | -10% $-107 | -5% $16 | +0% $139 | +5% $262 | +10% $385 |
| Rate | -1.0pp $328 | -0.5pp $235 | base $139 | +0.5pp $42 | +1.0pp $-57 |
UW: 25.0% down · 7.5% · 30yr · 1.5% tax · 5.0% vac · 8.0% maint · 8.0% mgmt
Financing live
Cash to close
- Down payment
- $93,750
- Closing costs
- $11,250
- Reserves months
- —
- Total cash needed
- —
Loan-product check · same deal, 3 products live
Conventional
25% down · 7.5% · 30yr
- Down + closing
- —
- Monthly P&I
- —
- Monthly cashflow
- —
- DSCR
- —
- Eligible?
- —
Personal DTI + credit; lowest rate.
DSCR
20% down · 8.5% · 30yr
- Down + closing
- —
- Monthly P&I
- —
- Monthly cashflow
- —
- DSCR
- —
- Eligible?
- —
No personal income docs; deal must DSCR.
Hard money
10% down · 12.0% · 12mo
- Down + closing
- —
- Monthly P&I
- —
- Monthly cashflow
- —
- DSCR
- —
- Eligible?
- —
Short-term bridge; refi at stabilization.
Rent comps 29 comps
| Address | Beds | Baths | Sqft | Rent | $/sqft | DOM | Units | Dist |
|---|---|---|---|---|---|---|---|---|
| 589 Rotonda Cir Rotonda West, FL | 3.0 | 2.5 | 2190 | $4,200 | $1.92 | 21d | 1 | 0.27mi |
| 527 Rotonda Cir Rotonda West, FL | 3.0 | 2.0 | 1586 | $2,375 | $1.50 | 21d | 1 | 0.36mi |
| 613 Boundary Blvd Rotonda West, FL | 3.0 | 2.0 | 2469 | $2,900 | $1.17 | 21d | 1 | 0.38mi |
| 114 Albatross Rd Rotonda West, FL | 3.0 | 2.0 | 1648 | $5,300 | $3.22 | 21d | 1 | 0.41mi |
| 30 Pinehurst Pl Rotonda West, FL | 3.0 | 3.0 | 2461 | $3,900 | $1.58 | 21d | 1 | 0.46mi |
| 12 Broadmoor Rd Unit 1 Rotonda West, FL | 3.0 | 2.0 | 2065 | $3,500 | $1.69 | 21d | 1 | 0.65mi |
| 686 Boundary Blvd Rotonda West, FL | 3.0 | 2.5 | 2282 | $2,800 | $1.23 | 21d | 1 | 0.68mi |
| 72 Long Meadow Ln Rotonda West, FL | 3.0 | 2.0 | 1945 | $1,920 | $0.99 | 14d | 1 | 0.75mi |
| 65 Fairway Rd Rotonda West, FL | 3.0 | 2.0 | 1865 | $2,700 | $1.45 | 21d | 1 | 0.93mi |
| 123 Marker Rd Rotonda West, FL | 3.0 | 2.0 | 2006 | $2,400 | $1.20 | 14d | 1 | 0.93mi |
| 72 Long Meadow Ct Rotonda West, FL | 3.0 | 2.0 | 1570 | $5,200 | $3.31 | 21d | 1 | 0.95mi |
| 80 Mariner Ln Rotonda West, FL | 3.0 | 2.0 | 2052 | $4,800 | $2.34 | 21d | 1 | 0.95mi |
| 25 Fairway Rd Rotonda West, FL | 3.0 | 2.0 | 2068 | $2,375 | $1.15 | 21d | 1 | 1.05mi |
| 155 Long Meadow Ln Rotonda West, FL | 3.0 | 2.0 | 1598 | $4,500 | $2.82 | 21d | 1 | 1.09mi |
| 138 Jade St Rotonda West, FL | 3.0 | 2.0 | 1564 | $1,869 | $1.20 | 21d | 1 | 1.09mi |
| 22 Mariner Ln Rotonda West, FL | 3.0 | 2.0 | 2015 | $4,200 | $2.08 | 21d | 1 | 1.10mi |
| 7152 Bougainvillea St Englewood, FL | 3.0 | 3.0 | 2150 | $4,500 | $2.09 | 14d | 1 | 1.14mi |
| 48 Par View Ct Rotonda West, FL | 3.0 | 2.0 | 2000 | $3,500 | $1.75 | 21d | 1 | 1.20mi |
| 7114 Sunnybrook Blvd Englewood, FL | 4.0 | 2.0 | 1636 | $2,297 | $1.40 | 21d | 1 | 1.21mi |
| 285 Mark Twain Ln Rotonda West, FL | 3.0 | 2.0 | 1759 | $1,750 | $0.99 | 21d | 1 | 1.21mi |
| 11268 Oceanspray Blvd Englewood, FL | 3.0 | 2.0 | 1702 | $6,750 | $3.97 | 21d | 1 | 1.21mi |
| 12005 Helicon Ave Port Charlotte, FL | 4.0 | 2.0 | 1636 | $2,800 | $1.71 | 21d | 1 | 1.27mi |
| 36 Bunker Cir Rotonda West, FL | 2.0 | 2.0 | 1533 | $3,999 | $2.61 | 21d | 1 | 1.28mi |
| 127 White Marsh Ln Rotonda West, FL | 3.0 | 2.0 | 2216 | $2,700 | $1.22 | 21d | 1 | 1.30mi |
| 135 David Blvd Rotonda West, FL | 3.0 | 2.0 | 1880 | $2,695 | $1.43 | 14d | 1 | 1.40mi |
| 10123 Bay Ave Englewood, FL | 3.0 | 2.0 | 2010 | $2,150 | $1.07 | 21d | 1 | 1.46mi |
| 289 Antis Dr Rotonda West, FL | 3.0 | 2.0 | 1648 | $2,150 | $1.30 | 21d | 1 | 1.46mi |
| 358 Albatross Rd Rotonda West, FL | 4.0 | 2.0 | 1664 | $2,100 | $1.26 | 21d | 1 | 1.48mi |
| 511 Sweetwater Dr Rotonda West, FL | 4.0 | 2.5 | 2160 | $2,200 | $1.02 | 21d | 1 | 1.50mi |
HOA detail
- Monthly dues
- $15 · $180/yr
- Likely covers
- pool
Listing history 16 events
-
2026-06-13statusdays on market $375,000 Pending 52 DOM
-
2026-06-10days on market $375,000 Active 51 DOM
-
2026-06-09days on market $375,000 Active 50 DOM
-
2026-06-08days on market $375,000 Active 49 DOM
-
2026-06-07days on market $375,000 Active 48 DOM
-
2026-06-05days on market $375,000 Active 45 DOM
-
2026-06-03days on market $375,000 Active 44 DOM
-
2026-06-03price $375,000 Active 43 DOM
-
2026-06-02days on market $400,000 Active 43 DOM
-
2026-06-01days on market $400,000 Active 42 DOM
-
2026-05-31days on market $400,000 Active 41 DOM
-
2026-05-30days on market $400,000 Active 40 DOM
-
2026-05-06price $400,000
-
2026-04-20$415,000 Active
-
2004-04-13soldstatus $264,900
-
1997-02-05soldstatus $149,700
ⓘ Source: listings_history table (triggers on properties + properties_extension) + one-shot
backfill from property_details.listing_events for pre-trigger history.
Tax reassessment forecast FL · Resets to sale price
- Current annual tax
- $2,178 · $182/mo
- Projected year-2 tax
- $3,112 · $259/mo
- Expected delta
- +$934/yr (+$78/mo · 42.9%)
ⓘ Screening estimate from a state-policy table — verify with the county assessor before closing.
Climate risk First Street
- Flood 6/10 Major FEMA zone X (unshaded) · 57% chance over 30 yrs
- Wildfire 1/10 Low
- Heat 10/10 Extreme 7 d/yr ≥107°F today · 29 d/yr by 30 yrs out
- Wind 10/10 Extreme 99% chance of damaging wind over 30 yrs
- Air quality 2/10 Low 1 unhealthy d/yr today · 1 by 30 yrs out
Nearby sold comps map
Loading sold comps map…
Walkable amenities ~0.75 mi
Loading nearby amenities…
Taxation est. · year 1
- Rental income
- $37,347
- − Mortgage interest
- −$21,006
- − Property taxes
- −$2,178
- − Insurance
- −$1,875
- − Repairs & maintenance
- −$2,988
- − Management
- −$2,988
- − HOA
- −$180
- − Depreciation
- −$10,909
- Taxable loss
- −$4,777
- Est. tax savings @ 24.0%
- +$1,146
- After-tax cash flow
- $2,819/yr
For passive investors: Depreciation is non-cash, so a rental often shows a tax loss while cash-flowing — sheltering income. Rental losses are passive: they offset passive income freely, and up to $25,000/yr can offset ordinary (W-2) income if you actively participate and your MAGI is under $100k (phasing out to $0 by $150k); unused losses carry forward. On sale, claimed depreciation is recaptured at up to 25%, and gains may owe capital-gains tax (a 1031 exchange can defer both). Figures are a year-1 estimate at your 24.0% rate — not tax advice; consult a CPA.
Schools (NCES district)
- District
- Charlotte
- NCES district ID
- 1200240
- Math proficiency
- 54% ▼ -6.00%
- Reading proficiency
- 54% ▼ -1.00%
- Median HH income
- $44,864
- Composite
- 45.62/100
- National rank
- #2586
- State rank
- #22 of 73 in FL
Livability — Rotonda
- Score
- 67/100
- State rank
- #548
- US rank
- #10359
Category grades
Schools grade is shown separately in the Schools card above.
Census & demographics
- Census place
- Rotonda, FL
- County
- Charlotte County · 196,994 people
- City population
- 10,490
- Metro
- Punta Gorda, FL
- Population (ZIP)
- 10,447
- Household income
- $80,091
- Rent vs Own
- Severe rent burden
- 91.0
Population outlook (Charlotte County) Hauer SSP2
- Today (2025)
- 198,646 people
- By 2030
- 210,507 · +6.0%
- By 2040
- 230,857 · +16.2%
- By 2050
- 247,148 · +24.4%
- By 2075
- 281,777 · +41.8%
- By 2100
- 293,609 · +47.8%
Race, ethnicity, and origin ACS 2023
- Neighborhood character
- Predominantly White (96%)
- Race & ethnicity
- White 96% Hispanic / Latino 2% Two or more races 2%
- Common ancestry
- Romanian 5% Lithuanian 4% Slovak 4%
- Foreign-born
- 8% · Canada, Vietnam
- Languages at home
- 93% English-only · Russian/Polish/Slavic 3% Spanish 2% German/W. Germanic 1%
Political lean MEDSL · Charlotte
- 2024 margin
- Solid R (+34.0) · D 32.7% · R 66.7%
- 2008→2024 swing
- -26.7pp toward R · 2008: -7.2pp · 2024: -34.0pp
- All cycles
- 2024: R+34.0 2020: R+26.6 2016: R+27.8 2012: R+14.3 2008: R+7.2
Not yet ingested
- Civics
- —
Market trends
- HPI YoY
- ▲ 1.25%
- Current HPI
- 311.3231
- Rent YoY
- ▼ -0.22%
- Metro
- Punta Gorda, FL
- State GDP YoY
- ▲ 3.28%
- F500 in state
- 36
Industry mix (Fortune 500 HQ in FL)
| Industry | F500 HQs | Revenue |
|---|---|---|
| Industrial Technology | 2 | $29B |
|
||
| Insurance | 2 | $17B |
|
||
| Retail | 1 | $60B |
|
||
| Technology Distribution | 1 | $58B |
|
||
| Homebuilding | 1 | $35B |
|
||
| Technology Manufacturing | 1 | $35B |
|
||
Price history
+167.2% since first listed4 events — show timeline
- 2026-05-06 Price Changed $400,000 Stellar MLS as Distributed by MLS Grid
- 2026-04-20 Listed $415,000 Stellar MLS as Distributed by MLS Grid
- 2004-04-13 Sold (Public Records) $264,900 Public Records
- 1997-02-05 Sold (Public Records) $149,700 Public Records
Property tax history
-1.1%/yrLatest (2025): $2,178 · +2.6% YoY. Source: county tax records.
Cash-flow waterfall
monthlySold comps — $/sqft
last 12 mo · ≤1 miLoading sold comps…