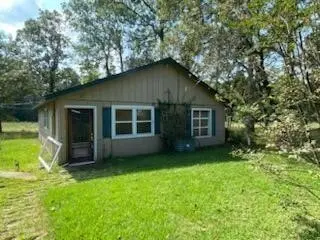
6 Post Oak · Riverside, TX
Flood risk 1/10 · Minimal
- FEMA flood zone
- X (unshaded)
- Chance of flooding over 30 yrs
- 0.0%
- Est. flood insurance / yr
- $507 – $1,088
Fire risk 5/10 · Moderate
- Est. fire insurance / yr
- $1,222 – $2,270
Heat risk 8/10 · Major
- Hot days now (above 111°F)
- 7 days/yr
- Hot days in 30 yrs
- 24 days/yr
Wind risk 8/10 · Major
- Chance of severe wind over 30 yrs
- 96.0%
Air-quality risk 2/10 · Minimal
- Unhealthy air days now
- 0 days/yr
- Unhealthy air days in 30 yrs
- 1 days/yr
Risk factors via First Street. Map © Google.
Why this score? — see what drove the B+ grade
The composite is a weighted blend of 9 inputs, each scored 0–100. Each bar is that input's sub-score; the figure is the points it added to the 100-point composite (weight × sub-score).
- Cash flow +30.0/30.0
- ARV discount +15.0/15.0
- 1% rule +10.0/10.0
- DSCR +10.0/10.0
- Rent growth +3.2/5.0
- Livability +3.0/5.0
- Schools +2.6/10.0
- Condition / age +2.5/5.0
- Appreciation +0.0/10.0
$69,999
🖨 Deal sheet (PDF) 📄 Offer letter ✓ Due diligence
Listing remarks
2 BEDROOM 1 BATH "ESTATE SALE" APARTMENT ON HALF ACRE+ LOT - 2 STORAGE SHEDS INCLUDED - BUILDINGS ARE IN NEED OF FULL REHAB OR TEARDOWN - SELLING AS LOT VALUE ONLY - SELLER WILL ENTERTAIN ALL REASONABLE OFFERS- WOULD BE A PERFERCT LAKE GETAWAY CABIN OR START FRESH BY BUILDING YOUR DREAM HOME - QUIET COUNTRY STYLE NEIGHBORHHOD IN THE HEART OF HUNTSVILLE. .. BEING SOLD "AS-IS / WHERE IS" . .. . MAKE US AN OFFER WE CAN'T REFUSE !!!!!
Key facts
- Half acre lot
- Storage sheds
- 0.57 acre lot
Tags
Property features AI
Finance
- HOA & community: Community managed by Riverside Lakeland Management Co; Annual association fee of $400
Exterior
- Utilities: Public water; Septic tank sewer
- Home design: Residential property; Single-story (first-floor living); Built in 1979; Slab foundation; Facing direction not specified
- Construction: Wood siding; Composition roof
- Exterior features: Located in a subdivision; Lot is about 0.57 acres
Interior
- Kitchen: First-floor kitchen (approximately 12 x 8); Breakfast nook adjacent to kitchen (approximately 8 x 6)
- Bedrooms: Two first-floor bedrooms (each about 13 x 12)
- Bathrooms: 1 full bathroom
- Heating & cooling: Central heating (electric); Central air conditioning (electric)
- Interior features: Washer hookup; Electric dryer hookup; Total of 4 rooms
- Laundry & utility: Washer hookup; Electric dryer hookup
Neighborhood map
What this means for you Summary
Snapshot
- This is a 2-bed/1.0-bath single-family listed at $70k.
Deal economics
- At list price, monthly cash flow is $353 ($4k/yr) — positive.
- The deal already cash-flows at list — no discount required.
- Meets the 1% rule at list price ($1k rent vs $70k).
- Recommended offer: $68k (3.0% below list) — sets the bar for market timing.
- Cap rate 12.3% vs local median 4.3% in Riverside — top-decile yield for the area; either an underpriced asset or a hidden risk that comps aren't pricing in. Stress-test before assuming the spread holds.
Location & tenants
- Location reads 59/100 on livability (#1,150 in TX) — a working-class tenant base; expect higher turnover. Strengths: cost of living A+, housing A+; Watch: crime D-, amenities F, commute F.
- Huntsville ISD (town): math 25% / reading 37% proficiency, ranked #621 of 826 in TX (top 75%) — families likely to look elsewhere, expect single-tenant / working-renter base with shorter leases.
- Zoned schools: Scott Johnson El (math 27% / reading 27%, grade F, #2,791 of 4,322 statewide, top 68%, 591 students, 80% FRL); Mance Park Middle (math 26% / reading 25%, grade F, #1,236 of 1,662 statewide, top 76%, 904 students, 74% FRL); Huntsville H S (math 13% / reading 25%, grade F, #1,431 of 1,632 statewide, top 88%, 1,797 students, 68% FRL) — zoned schools average 74% FRL vs 42% district-wide (32 pts higher); higher-poverty schools than district average — tighter screening recommended.
- Market conditions: Rents rising (+2.9%/yr); 520 active listings in the ZIP; 527 units permitted in Walker County in 2024 (0 in 5+ unit buildings).
Forward outlook
- Local home prices are declining (-3.0%/yr); year-one equity from $484 of loan paydown is wiped out by about $2k of value loss. Plan a longer hold.
- Walker County population projected at +29% by 2050 — long-run rental-demand tailwind backs the buy-and-hold thesis.
- At projected returns (-3.0% appreciation + 2.9% rent growth), your $20k cash investment doubles in ~6 years — after that, you're playing with house money.
Negotiation context
- It's been on market 35 days — a 3% lower offer ($68k) is reasonable based on typical stale-listing flexibility.
- 4 sale attempts since 2y ago with the ask held roughly flat each time — persistent listings suggest the price (not the market) is what's stuck; bring a comps-based counter.
Risks & watch-outs
- Climate carrying-cost: severe wind risk, 96% chance of damaging wind over 30y; moderate wildfire risk; extreme-heat days projected 7→24/yr by 2055 (HVAC capex compounding) — expect insurance premiums to compound above CPI over the hold.
Questions for the listing agent
- It's been on market 35 days. Have you received any prior offers? Is the seller open to a 3% concession, seller financing, or rate buy-down credit?
- Built in 1979 — when were the roof, HVAC, electrical panel, plumbing, and water heater last replaced?
- What does the HOA fee cover, when was the last increase, and are there any pending special assessments or reserve-fund shortfalls?
- Is there a deadline driving the sale (1031 exchange, divorce, estate, relocation)? That informs how much negotiation room exists.
- Schools are F-rated, which usually means shorter tenancies and higher turnover. Who's the typical renter profile here, and what's been the actual vacancy rate?
- Crime grade is D in this area — have there been break-ins, vandalism, or insurance claims at this property in the last 3 years? What carrier currently insures it and at what premium?
- What's the average days-on-market for RENTAL listings here right now (not sales)? A rising rental-DOM trend means longer vacancies and softer asking-rent achievability than the comps imply.
- What's the recent tenant-quality profile in this submarket — average credit score on applications, eviction rate, late-payment / NSF rate, and stable-employment percentage? A property-management company in the area should have these aggregated.
- How much new for-sale + rental construction is in the pipeline within 1–3 miles? Heavy new supply typically softens prices + rents 12–24 months out; constrained supply supports both.
Investment metrics
- 1% rule
- 1.66% ✓
- Cap rate
- 12.35%
- Cash-on-cash
- 21.63%
- DSCR
- 1.96
- GRM
- 5.0
CMA / ARV
- ARV (on-the-fly)
- $138,600
- Comps found
- 4
Show comp detail 4 sales within ~0.75 mi
| Address | Dist | Beds/Ba | Sqft | Sold | Price | $/sf | Match |
|---|---|---|---|---|---|---|---|
| 16 Connor Ln | 0.42mi | 2/1.0 | 1,004 (+12%) | 2mo | $155,000 | $154 | 60 |
| 32 Woelfley Ln | 0.45mi | 2/1.0 | 915 (+2%) | 22mo | $88,500 | $97 | 58 |
| 19 Hickory Bnd | 0.60mi | 2/1.0 | 910 (+1%) | 20mo | $109,000 | $120 | 53 |
| 108 Hilltop Rd | 0.28mi | 1/1.0 (-1) | 812 (-10%) | 20mo | $169,900 | $209 | 49 |
Match score weights: distance 35% · size 25% · config 20% · recency 20%. Top-matched comps best support the ARV.
Projected returns pro-forma
-3.0% appreciation · 2.89% rent growth · sell at horizon
- IRR
- 14.2%
- Equity multiple
- 1.57×
- Total profit
- $11,094
- Equity at exit
- $10,437
- IRR
- 22.9%
- Equity multiple
- 2.96×
- Total profit
- $38,374
- Equity at exit
- $6,052
Cash invested: $19,600 (down + closing). Projections, not guarantees.
Landlord ↔ Tenant lean methodology
- Overall (STATE)
- 87 Strongly Landlord-Friendly
- State Texas
- 87 Strongly Landlord-Friendly · R+5
- County
- — inherits STATE
- City
- — inherits STATE
ZIP-level market 77320
- Home prices YoY
- -33.0%
- Rents YoY
- 2.9%
- Active inventory
- 520
- Price-to-rent
- 5.0×
Monthly cashflow live
- Estimated rent
- $1,159 medium interval (Pro) →
- Mortgage (P&I)
- −$367
- Tax from tax record
- −$133 /mo · $1,594/yr
- Insurance
- −$29
- HOA
- −$33
- Vacancy / Maint / Mgmt
- −$243
- Net cashflow
- $353
Break-even live
Sensitivity live
| Price | -10% $393 | -5% $373 | +0% $353 | +5% $333 | +10% $314 |
|---|---|---|---|---|---|
| Rent | -10% $262 | -5% $307 | +0% $353 | +5% $399 | +10% $445 |
| Rate | -1.0pp $389 | -0.5pp $371 | base $353 | +0.5pp $335 | +1.0pp $317 |
UW: 25.0% down · 7.5% · 30yr · 1.5% tax · 5.0% vac · 8.0% maint · 8.0% mgmt
Financing live
Cash to close
- Down payment
- $17,500
- Closing costs
- $2,100
- Reserves months
- —
- Total cash needed
- —
Loan-product check · same deal, 3 products live
Conventional
25% down · 7.5% · 30yr
- Down + closing
- —
- Monthly P&I
- —
- Monthly cashflow
- —
- DSCR
- —
- Eligible?
- —
Personal DTI + credit; lowest rate.
DSCR
20% down · 8.5% · 30yr
- Down + closing
- —
- Monthly P&I
- —
- Monthly cashflow
- —
- DSCR
- —
- Eligible?
- —
No personal income docs; deal must DSCR.
Hard money
10% down · 12.0% · 12mo
- Down + closing
- —
- Monthly P&I
- —
- Monthly cashflow
- —
- DSCR
- —
- Eligible?
- —
Short-term bridge; refi at stabilization.
HOA detail
- Monthly dues
- $33 · $396/yr
- Likely covers
- trash
Listing history 27 events
-
2026-06-21days on market $69,999 Active 35 DOM
-
2026-06-19days on market $69,999 Active 33 DOM
-
2026-06-18days on market $69,999 Active 32 DOM
-
2026-06-17days on market $69,999 Active 31 DOM
-
2026-06-16days on market $69,999 Active 30 DOM
-
2026-06-15days on market $69,999 Active 29 DOM
-
2026-06-14days on market $69,999 Active 27 DOM
-
2026-06-13days on market $69,999 Active 26 DOM
-
2026-06-10days on market $69,999 Active 24 DOM
-
2026-06-09days on market $69,999 Active 23 DOM
-
2026-06-08days on market $69,999 Active 22 DOM
-
2026-06-07days on market $69,999 Active 21 DOM
-
2026-06-05days on market $69,999 Active 18 DOM
-
2026-06-03days on market $69,999 Active 17 DOM
-
2026-06-02days on market $69,999 Active 16 DOM
-
2026-06-01days on market $69,999 Active 15 DOM
-
2026-05-31days on market $69,999 Active 14 DOM
-
2026-05-30days on market $69,999 Active 13 DOM
-
2026-05-17$69,999 Active
-
2026-03-31historical
-
2025-12-08price $79,999
-
2025-11-03price $89,999
-
2025-09-15$99,999 Active
-
2024-04-04historical
-
2024-03-24status Active
-
2024-03-16status Option Pending
-
2024-01-04$98,000 Active
ⓘ Source: listings_history table (triggers on properties + properties_extension) + one-shot
backfill from property_details.listing_events for pre-trigger history.
Tax reassessment forecast TX · Resets to sale price
- Current annual tax
- $1,594 · $133/mo
- Projected year-2 tax
- $1,594 · $133/mo
- Expected delta
- $0/yr ($0/mo · 0.0%)
ⓘ Screening estimate from a state-policy table — verify with the county assessor before closing.
Climate risk First Street
- Flood 1/10 Low FEMA zone X (unshaded) · 0% chance over 30 yrs
- Wildfire 5/10 Major
- Heat 8/10 Severe 7 d/yr ≥111°F today · 24 d/yr by 30 yrs out
- Wind 8/10 Severe 96% chance of damaging wind over 30 yrs
- Air quality 2/10 Low 0 unhealthy d/yr today · 1 by 30 yrs out
Nearby sold comps map
Loading sold comps map…
Walkable amenities ~0.75 mi
Loading nearby amenities…
Taxation est. · year 1
- Rental income
- $13,904
- − Mortgage interest
- −$3,921
- − Property taxes
- −$1,594
- − Insurance
- −$350
- − Repairs & maintenance
- −$1,112
- − Management
- −$1,112
- − HOA
- −$396
- − Depreciation
- −$2,036
- Taxable income
- $3,382
- Est. tax owed @ 24.0%
- −$812
- After-tax cash flow
- $3,427/yr
For passive investors: Depreciation is non-cash, so a rental often shows a tax loss while cash-flowing — sheltering income. Rental losses are passive: they offset passive income freely, and up to $25,000/yr can offset ordinary (W-2) income if you actively participate and your MAGI is under $100k (phasing out to $0 by $150k); unused losses carry forward. On sale, claimed depreciation is recaptured at up to 25%, and gains may owe capital-gains tax (a 1031 exchange can defer both). Figures are a year-1 estimate at your 24.0% rate — not tax advice; consult a CPA.
Schools (NCES district)
- District
- Huntsville ISD
- NCES district ID
- 4824030
- Math proficiency
- 25% ▼ -6.00%
- Reading proficiency
- 37% ▼ -2.00%
- Median HH income
- $36,597
- Composite
- 25.71/100
- National rank
- #7383
- State rank
- #621 of 826 in TX
Livability — Riverside
- Score
- 59/100
- State rank
- #1150
- US rank
- #20204
Category grades
Schools grade is shown separately in the Schools card above.
Census & demographics
- County
- Walker County · 75,669 people
- City population
- 634
- Metro
- Huntsville, TX
- Population (ZIP)
- 38,152
- Household income
- $55,663
- Rent vs Own
- Severe rent burden
- 1030.0
Population outlook (Walker County) Hauer SSP2
- Today (2025)
- 77,602 people
- By 2030
- 82,007 · +5.7%
- By 2040
- 90,436 · +16.5%
- By 2050
- 100,240 · +29.2%
- By 2075
- 123,667 · +59.4%
- By 2100
- 135,073 · +74.1%
Race, ethnicity, and origin ACS 2023
- Neighborhood character
- Diverse neighborhood (Simpson 0.64)
- Race & ethnicity
- White 50% Hispanic / Latino 26% Black 21% Two or more races 15%
- Hispanic origin (detail)
- Mexican 20%
- Common ancestry
- Lithuanian 2% Italian 2% Slovak 2%
- Foreign-born
- 9% · Canada, Vietnam
- Languages at home
- 79% English-only · Spanish 19%
Political lean MEDSL · Walker
- 2024 margin
- Solid R (+40.0) · D 29.6% · R 69.6%
- 2008→2024 swing
- -17.6pp toward R · 2008: -22.4pp · 2024: -40.0pp
- All cycles
- 2024: R+40.0 2020: R+31.7 2016: R+34.5 2012: R+28.4 2008: R+22.4
Not yet ingested
- Civics
- —
Market trends
- HPI YoY
- ▼ -93.48%
- Current HPI
- 190.199
- Rent YoY
- ▲ 2.89%
- Metro
- Huntsville, TX
- State GDP YoY
- ▲ 3.95%
- F500 in state
- 110
Industry mix (Fortune 500 HQ in TX)
| Industry | F500 HQs | Revenue |
|---|---|---|
| Energy | 16 | $1,198B |
|
||
| Technology | 5 | $198B |
|
||
| Engineering / Construction | 4 | $72B |
|
||
| Energy Services | 3 | $60B |
|
||
| Utilities | 3 | $41B |
|
||
| Healthcare | 2 | $330B |
|
||
Price history
-28.6% since first listed9 events — show timeline
- 2026-05-17 Listed $69,999 HARMLS
- 2026-03-31 Listing Removed — HARMLS
- 2025-12-08 Price Changed $79,999 HARMLS
- 2025-11-03 Price Changed $89,999 HARMLS
- 2025-09-15 Listed $99,999 HARMLS
- 2024-04-04 Listing Removed — HARMLS
- 2024-03-24 Relisted — HARMLS
- 2024-03-16 Pending — HARMLS
- 2024-01-04 Listed $98,000 HARMLS
Property tax history
+4.3%/yrLatest (2025): $1,594 · -4.6% YoY. Source: county tax records.
Cash-flow waterfall
monthlySold comps — $/sqft
last 12 mo · ≤1 miLoading sold comps…