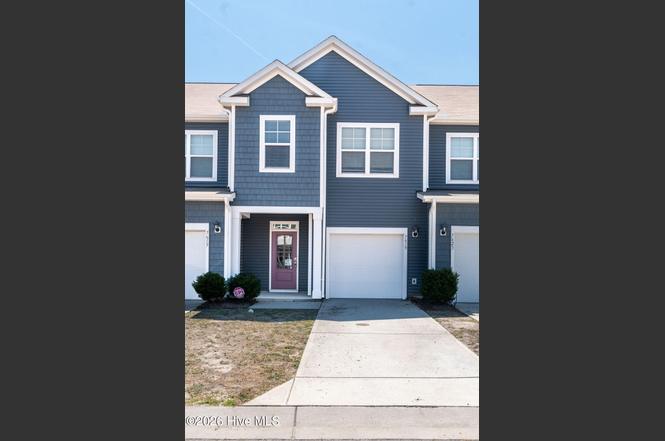
7619 Knightbell Cir · Leland, NC
Flood risk 1/10 · Minimal
- FEMA flood zone
- X (unshaded)
- Chance of flooding over 30 yrs
- 0.0%
- Est. flood insurance / yr
- $507 – $1,088
Fire risk 6/10 · Moderate
- Est. fire insurance / yr
- $906 – $1,684
Heat risk 9/10 · Severe
- Hot days now (above 105°F)
- 7 days/yr
- Hot days in 30 yrs
- 18 days/yr
Wind risk 8/10 · Major
- Chance of severe wind over 30 yrs
- 99.0%
Air-quality risk 1/10 · Minimal
- Unhealthy air days now
- 0 days/yr
- Unhealthy air days in 30 yrs
- 0 days/yr
Risk factors via First Street. Map © Google.
Why this score? — see what drove the D grade
The composite is a weighted blend of 9 inputs, each scored 0–100. Each bar is that input's sub-score; the figure is the points it added to the 100-point composite (weight × sub-score).
- Cash flow +11.5/30.0
- ARV discount +11.2/15.0
- 1% rule +4.0/10.0
- Schools +3.9/10.0
- DSCR +3.4/10.0
- Livability +3.4/5.0
- Rent growth +2.8/5.0
- Condition / age +2.5/5.0
- Appreciation +0.0/10.0
$241,250
🖨 Deal sheet 📄 Offer letter ✓ Due diligence
Listing remarks
Welcome to Ibis Landing! This well-appointed 3-bedroom, 2.5-bath townhome offers a spacious open-concept layout designed for everyday comfort and easy entertaining. The main living area flows seamlessly into the kitchen, featuring quartz countertops, stainless steel appliances, and ample workspace. Upstairs, the bright bedrooms offer generous natural light and comfortable separation from the main living areas. Conveniently located near shopping, dining, and everyday services in Leland, this home is approximately 15 minutes from downtown Wilmington, within easy reach of Wrightsville Beach, Carolina Beach, Kure Beach, Holden Beach, and Oak Island, and about 1.5 hours from Myrtle Beach, SC. Ib
Key facts
- Quartz countertops
- Convenient access
- Open-concept layout
Tags
Property features AI
Finance
- Other: Zoning: Le-R-6; Directions: South on Highway 17, then right onto Knightbell Circle; home on the left
- HOA & community: Homeowners association with annual fee ($3,252 per year / ~$271 monthly); HOA covers grounds and structure maintenance and taxes; Community features include street lights; Subdivision: Ibis Landing
Exterior
- Parking: Attached garage; Garage faces front; Concrete driveway; Off-street parking; 1 garage space (1 total parking space)
- Utilities: Sewer connected; Water connected
- Home design: Townhouse; Two-level / 2 stories; Entry level: 1; Residential property
- Construction: Vinyl siding and frame construction; Slab foundation; Built on two levels
- Exterior features: Patio; Front porch; Partial fencing; Shingle roof; Has a view; Paved road access
Interior
- Kitchen: Refrigerator; Dishwasher; Electric range; Microwave
- Bedrooms: Total rooms: 6
- Flooring: Carpet
- Bathrooms: 2 full bathrooms; 1 half bathroom
- Heating & cooling: Central air conditioning; Electric heating; Forced air; Heat pump
- Interior features: Walk-in closets; High ceilings; Pantry; Window coverings
- Laundry & utility: Laundry closet; Electric water heater
Neighborhood map
What this means for you Summary
Snapshot
- This is a 3-bed/2.5-bath townhouse listed at $241k.
Deal economics
- At list price, monthly cash flow is $-77 ($-929/yr) — negative.
- To cash-flow at today's rent, offer at most $228k (5.7% below list).
- To meet the 1% rule (rent ≥ 1% of price), the offer needs to be $218k (9.8% below list).
- Recommended offer: $218k (9.8% below list) — sets the bar for 1% rule.
- Cap rate 5.9% vs local median 3.2% in Leland — top-decile yield for the area; either an underpriced asset or a hidden risk that comps aren't pricing in. Stress-test before assuming the spread holds.
Location & tenants
- Location reads 68/100 on livability (#177 in NC) — a middle-class / working-renter tenant base. Strengths: crime A+, housing A+, employment A; Watch: health & safety D, amenities F, commute F.
- Brunswick County Schools (rural): math 45% / reading 47% proficiency, ranked #82 of 178 in NC (top 46%) — families likely to look elsewhere, expect single-tenant / working-renter base with shorter leases.
- Zoned schools: Town Creek Elementary (math 50% / reading 53%, grade C-, #392 of 1,410 statewide, top 28%, 654 students, 100% FRL); Leland Middle (math 26% / reading 36%, grade F, #326 of 475 statewide, top 69%, 780 students, 100% FRL); North Brunswick High (math 57% / reading 49%, grade C-, #281 of 535 statewide, top 53%, 1,450 students, 100% FRL) — zoned schools average 100% FRL vs 53% district-wide (46 pts higher); higher-poverty schools than district average — tighter screening recommended.
- Market conditions: Rents rising (+1.2%/yr); 1213 active listings in the ZIP; 12 comparable units currently listed for rent nearby; rentals at typical pace (median 21d on market — plan ~3-4 weeks tenant-placement turnaround); solid renter incomes; 6,112 units permitted in Brunswick County in 2024 (990 in 5+ unit buildings).
- This rent runs 32% of the median local income ($81k/yr) — at the standard rent-burdened threshold; future hikes will face affordability resistance.
Forward outlook
- Local home prices are declining (-3.0%/yr); year-one equity from $2k of loan paydown is wiped out by about $7k of value loss. Plan a longer hold.
- Brunswick County population projected at +36% by 2050 — long-run rental-demand tailwind backs the buy-and-hold thesis.
Negotiation context
- Only 3 days on market — expect competitive offers; lowballing is unlikely to land.
- 3 sale attempts since 3y ago with the ask held roughly flat each time — persistent listings suggest the price (not the market) is what's stuck; bring a comps-based counter.
Risks & watch-outs
- Climate carrying-cost: severe wind risk, 99% chance of damaging wind over 30y; major wildfire risk; extreme-heat days projected 7→18/yr by 2055 (HVAC capex compounding) — expect insurance premiums to compound above CPI over the hold.
Questions for the listing agent
- What do current leases actually rent for vs. the listed asking? Can we see a recent rent roll and the last 12 months of T-12 income?
- What does the HOA fee cover, when was the last increase, and are there any pending special assessments or reserve-fund shortfalls?
- Is there a deadline driving the sale (1031 exchange, divorce, estate, relocation)? That informs how much negotiation room exists.
- The area grade is low — what's the realistic commute time and amenity access for the typical tenant pool here? Any planned neighborhood developments (good or bad) we should know about?
- What's the average days-on-market for RENTAL listings here right now (not sales)? A rising rental-DOM trend means longer vacancies and softer asking-rent achievability than the comps imply.
- What's the recent tenant-quality profile in this submarket — average credit score on applications, eviction rate, late-payment / NSF rate, and stable-employment percentage? A property-management company in the area should have these aggregated.
- How much new for-sale + rental construction is in the pipeline within 1–3 miles? Heavy new supply typically softens prices + rents 12–24 months out; constrained supply supports both.
Investment metrics
- 1% rule
- 0.90% ✗
- Cap rate
- 5.91%
- Cash-on-cash
- -1.38%
- DSCR
- 0.94
- GRM
- 9.2
CMA / ARV
- ARV (on-the-fly)
- $262,944
- Comps found
- 12
Show comp detail 12 sales within ~0.75 mi
| Address | Dist | Beds/Ba | Sqft | Sold | Price | $/sf | Match |
|---|---|---|---|---|---|---|---|
| 5815 Harebell Rd Unit 145 | 0.45mi | 3/2.5 | 1,418 (-10%) | 1mo | $234,990 | $166 | 61 |
| 5795 Harebell Rd Unit 149 | 0.44mi | 3/2.5 | 1,418 (-10%) | 2mo | $229,999 | $162 | 60 |
| 5784 Harebell Rd Unit 211 | 0.45mi | 3/2.5 | 1,418 (-10%) | 2mo | $239,999 | $169 | 60 |
| 5799 Harebell Rd Lot 148 | 0.44mi | 3/2.5 | 1,418 (-10%) | 3mo | $235,990 | $166 | 60 |
| 5800 Harebell Rd #208 | 0.46mi | 3/2.5 | 1,418 (-10%) | 2mo | $235,349 | $166 | 59 |
| 5796 Harebell Rd Unit 209 | 0.46mi | 3/2.5 | 1,418 (-10%) | 3mo | $229,999 | $162 | 59 |
| 7098 Dunford Rd Unit 130 | 0.50mi | 3/2.5 | 1,418 (-10%) | 2mo | $247,990 | $175 | 58 |
| 6362 Cowslip Way Unit 183 | 0.50mi | 3/2.5 | 1,418 (-10%) | 3mo | $235,999 | $166 | 56 |
| 5791 Harebell Rd Unit 150 | 0.43mi | 4/2.5 (+1) | 1,763 (+11%) | 1mo | $264,999 | $150 | 55 |
| 5811 Harebell Rd Unit 146 | 0.45mi | 4/2.5 (+1) | 1,763 (+11%) | 1mo | $274,490 | $156 | 55 |
| 5823 Harebell Rd Unit 143 | 0.46mi | 4/2.5 (+1) | 1,763 (+11%) | 1mo | $273,490 | $155 | 54 |
| 6319 Cowslip Way Unit 196 | 0.46mi | 4/2.5 (+1) | 1,763 (+11%) | 3mo | $264,999 | $150 | 53 |
Match score weights: distance 35% · size 25% · config 20% · recency 20%. Top-matched comps best support the ARV.
Projected returns pro-forma
-3.0% appreciation · 1.24% rent growth · sell at horizon
- IRR
- -20.7%
- Equity multiple
- 0.29×
- Total profit
- $-47,697
- Equity at exit
- $35,971
- IRR
- -18.7%
- Equity multiple
- 0.08×
- Total profit
- $-62,424
- Equity at exit
- $20,859
Cash invested: $67,550 (down + closing). Projections, not guarantees.
Landlord ↔ Tenant lean methodology
- Overall (STATE)
- 85 Strongly Landlord-Friendly
- State North Carolina
- 85 Strongly Landlord-Friendly · R+3
- County
- — inherits STATE
- City
- — inherits STATE
ZIP-level market 28451
- Rents YoY
- 1.2%
- Active inventory
- 1213
- Price-to-rent
- 9.2×
Monthly cashflow live
- Estimated rent
- $2,175 high interval (Pro) →
- Mortgage (P&I)
- −$1,265
- Tax from tax record
- −$159 /mo · $1,912/yr
- Insurance
- −$101
- HOA
- −$271
- Vacancy / Maint / Mgmt
- −$457
- Net cashflow
- $-77
Break-even live
UW: 25.0% down · 7.5% · 30yr · 1.5% tax · 5.0% vac · 8.0% maint · 8.0% mgmt
Financing live
Cash to close
- Down payment
- $60,312
- Closing costs
- $7,238
- Reserves months
- —
- Total cash needed
- —
Loan-product check · same deal, 3 products live
Conventional
25% down · 7.5% · 30yr
- Down + closing
- —
- Monthly P&I
- —
- Monthly cashflow
- —
- DSCR
- —
- Eligible?
- —
Personal DTI + credit; lowest rate.
DSCR
20% down · 8.5% · 30yr
- Down + closing
- —
- Monthly P&I
- —
- Monthly cashflow
- —
- DSCR
- —
- Eligible?
- —
No personal income docs; deal must DSCR.
Hard money
10% down · 12.0% · 12mo
- Down + closing
- —
- Monthly P&I
- —
- Monthly cashflow
- —
- DSCR
- —
- Eligible?
- —
Short-term bridge; refi at stabilization.
Rent comps 12 comps
| Address | Beds | Baths | Sqft | Rent | $/sqft | DOM | Units | Dist |
|---|---|---|---|---|---|---|---|---|
| 7111 Rock Fish Ln Leland, NC | 1.0–3.0 | 1.0–2.0 | 1093 | $1,875 | $1.72 | 13d | 19 | 0.21mi |
| 8708 Red Leaf Run Belville, NC | 1.0–3.0 | 1.0–2.0 | 1063 | $2,127 | $2.00 | 13d | 10 | 0.42mi |
| 5784 Harebell Rd Leland, NC | 3.0 | 2.5 | 1418 | $2,095 | $1.48 | 23d | 1 | 0.45mi |
| 4162 High Glen Dr Unit 4162 , NC | 3.0 | 2.5 | 1418 | $2,000 | $1.41 | 23d | 1 | 0.50mi |
| 3828 Starry Sky Rd Leland, NC | 4.0 | 2.5 | 1772 | $2,540 | $1.43 | 13d | 1 | 0.52mi |
| 9125 Sunrise Creek Dr Leland, NC | 4.0 | 2.5 | 1772 | $2,440 | $1.38 | 23d | 1 | 0.54mi |
| 3907 Starry Sky Rd Leland, NC | 3.0 | 2.0 | 1665 | $2,294 | $1.38 | 23d | 1 | 0.59mi |
| 3100 Ascend Loop Belville, NC | 1.0–3.0 | 1.0–2.0 | 1077 | $2,382 | $2.21 | 13d | 79 | 0.61mi |
| 3915 Starry Sky Rd Leland, NC | 3.0 | 2.0 | 1708 | $2,440 | $1.43 | 21d | 1 | 0.61mi |
| 6146 Liberty Hall Dr Leland, NC | 1.0–2.0 | 1.0–2.5 | 1184 | $4,690 | $3.96 | 13d | 31 | 0.65mi |
| 4118 Hobblebush Dr Leland, NC | 3.0–4.0 | 2.0–2.5 | 1580 | $1,995 | $1.26 | 13d | 14 | 0.71mi |
| 9060 Laurel Bay Ln Unit 1 Leland, NC | 3.0 | 2.5 | 1550 | $1,875 | $1.21 | 23d | 1 | 1.40mi |
HOA detail
- Monthly dues
- $271 · $3,252/yr
Listing history 4 events
-
2026-06-18days on market $241,250 Active 3 DOM
-
2026-06-17days on market $241,250 Active 2 DOM
-
2026-06-15remarks 699-char remark
-
2026-06-15$241,250 Active 1 DOM
ⓘ Source: listings_history table (triggers on properties + properties_extension) + one-shot
backfill from property_details.listing_events for pre-trigger history.
Tax reassessment forecast NC · Resets to sale price
- Current annual tax
- $1,912 · $159/mo
- Projected year-2 tax
- $1,978 · $165/mo
- Expected delta
- +$66/yr (+$6/mo · 3.5%)
ⓘ Screening estimate from a state-policy table — verify with the county assessor before closing.
Climate risk First Street
- Flood 1/10 Low FEMA zone X (unshaded) · 0% chance over 30 yrs
- Wildfire 6/10 Major
- Heat 9/10 Extreme 7 d/yr ≥105°F today · 18 d/yr by 30 yrs out
- Wind 8/10 Severe 99% chance of damaging wind over 30 yrs
- Air quality 1/10 Low 0 unhealthy d/yr today · 0 by 30 yrs out
Nearby sold comps map
Loading sold comps map…
Walkable amenities ~0.75 mi
Loading nearby amenities…
Taxation est. · year 1
- Rental income
- $26,105
- − Mortgage interest
- −$13,514
- − Property taxes
- −$1,912
- − Insurance
- −$1,206
- − Repairs & maintenance
- −$2,088
- − Management
- −$2,088
- − HOA
- −$3,252
- − Depreciation
- −$7,018
- Taxable loss
- −$4,974
- Est. tax savings @ 24.0%
- +$1,194
- After-tax cash flow
- $265/yr
For passive investors: Depreciation is non-cash, so a rental often shows a tax loss while cash-flowing — sheltering income. Rental losses are passive: they offset passive income freely, and up to $25,000/yr can offset ordinary (W-2) income if you actively participate and your MAGI is under $100k (phasing out to $0 by $150k); unused losses carry forward. On sale, claimed depreciation is recaptured at up to 25%, and gains may owe capital-gains tax (a 1031 exchange can defer both). Figures are a year-1 estimate at your 24.0% rate — not tax advice; consult a CPA.
Schools (NCES district)
- District
- Brunswick County Schools
- NCES district ID
- 3700420
- Math proficiency
- 45% ▲ 4.00%
- Reading proficiency
- 47% ▲ 4.00%
- Median HH income
- $47,494
- Composite
- 39.23/100
- National rank
- #4011
- State rank
- #82 of 178 in NC
Livability — Leland
- Score
- 68/100
- State rank
- #177
- US rank
- #9158
Category grades
Schools grade is shown separately in the Schools card above.
Census & demographics
- Census place
- Leland, NC
- County
- Brunswick County · 131,536 people
- City population
- 46,933
- Metro
- Myrtle Beach-Conway-North Myrtle Beach, SC-NC
- Population (ZIP)
- 46,933
- Household income
- $81,481
- Rent vs Own
- Severe rent burden
- 1049.0
Population outlook (Brunswick County) Hauer SSP2
- Today (2025)
- 152,111 people
- By 2030
- 165,705 · +8.9%
- By 2040
- 188,494 · +23.9%
- By 2050
- 206,228 · +35.6%
- By 2075
- 237,876 · +56.4%
- By 2100
- 251,451 · +65.3%
Race, ethnicity, and origin ACS 2023
- Neighborhood character
- Predominantly White (71%)
- Race & ethnicity
- White 71% Black 12% Hispanic / Latino 11% Two or more races 8%
- Hispanic origin (detail)
- Mexican 7% Puerto Rican 1%
- Common ancestry
- Slovak 2% Lithuanian 2% Romanian 2%
- Foreign-born
- 5% · Canada
- Languages at home
- 91% English-only · Spanish 7% Other Indo-European 1%
Political lean MEDSL · Brunswick
- 2024 margin
- Strong R (+24.9) · D 37.2% · R 62.0%
- 2008→2024 swing
- -6.9pp toward R · 2008: -17.9pp · 2024: -24.9pp
- All cycles
- 2024: R+24.9 2020: R+25.0 2016: R+28.7 2012: R+22.2 2008: R+17.9
Not yet ingested
- Civics
- —
Market trends
- HPI YoY
- ▼ -99.99%
- Current HPI
- 148.6217
- Rent YoY
- ▲ 1.24%
- Metro
- Myrtle Beach-Conway-North Myrtle Beach, SC-NC
- State GDP YoY
- ▲ 3.28%
- F500 in state
- 26
Industry mix (Fortune 500 HQ in NC)
| Industry | F500 HQs | Revenue |
|---|---|---|
| Financial Services | 2 | $213B |
|
||
| Retail | 2 | $95B |
|
||
| Industrial Conglomerate | 1 | $38B |
|
||
| Metals / Steel | 1 | $35B |
|
||
| Utilities | 1 | $30B |
|
||
| Industrial Machinery | 1 | $19B |
|
||
Price history
-15.4% since first listed9 events — show timeline
- 2026-06-15 Listed $241,250 Hive MLS
- 2024-04-05 Listing Removed — Hive MLS
- 2024-03-06 Listed $275,000 Hive MLS
- 2024-02-08 Listing Removed — Hive MLS
- 2024-01-23 Price Changed $279,000 Hive MLS
- 2024-01-13 Price Changed $269,500 Hive MLS
- 2023-12-14 Price Changed $275,000 Hive MLS
- 2023-11-04 Price Changed $279,900 Hive MLS
- 2023-10-14 Listed $285,000 Hive MLS
Property tax history
+69.0%/yrLatest (2025): $1,912 · +0.0% YoY. Source: county tax records.
Cash-flow waterfall
monthlySold comps — $/sqft
last 12 mo · ≤1 miLoading sold comps…