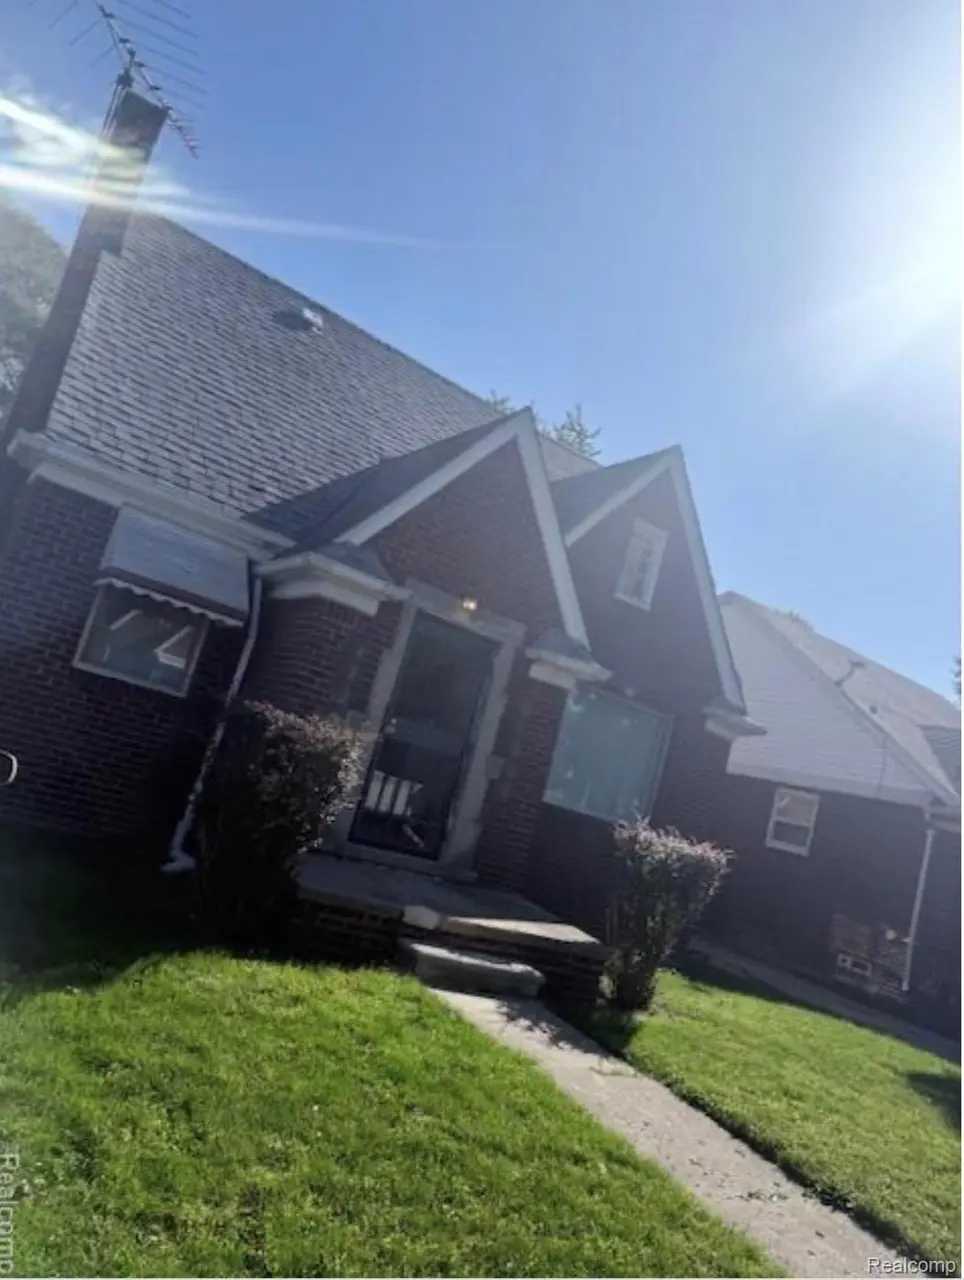
18436 Beland St · Detroit, MI
Flood risk 1/10 · Minimal
- FEMA flood zone
- X (unshaded)
- Chance of flooding over 30 yrs
- 0.0%
- Est. flood insurance / yr
- $473 – $860
Fire risk 1/10 · Minimal
- Est. fire insurance / yr
- $784 – $1,456
Heat risk 3/10 · Minor
- Hot days now (above 96°F)
- 7 days/yr
- Hot days in 30 yrs
- 14 days/yr
Wind risk 2/10 · Minimal
- Chance of severe wind over 30 yrs
- —
Air-quality risk 3/10 · Minor
- Unhealthy air days now
- 2 days/yr
- Unhealthy air days in 30 yrs
- 5 days/yr
Risk factors via First Street. Map © Google.
Why this score? — see what drove the B- grade
The composite is a weighted blend of 9 inputs, each scored 0–100. Each bar is that input's sub-score; the figure is the points it added to the 100-point composite (weight × sub-score).
- Cash flow +30.0/30.0
- 1% rule +10.0/10.0
- DSCR +10.0/10.0
- ARV discount +8.3/15.0
- Rent growth +4.2/5.0
- Livability +3.7/5.0
- Condition / age +2.5/5.0
- Schools +1.3/10.0
- Appreciation +0.0/10.0
$69,999
🖨 Deal sheet 📄 Offer letter ✓ Due diligence
Listing remarks MLS
First time home buyer or Investor Opportunity! This Detroit bungalow is now vacant and move-in ready, offering immediate flexibility for investors or owner-occupants. Inside, you'll find classic features like original hardwood floors, a spacious living area, a traditional dining room layout. Located on a quiet block with convenient access to local schools, shopping, and major freeways. A solid addition to any portfolio—or a great place to call home. Schedule your showing today!
Key facts
- Spacious living area
- Quiet block
- 4,909 sq ft lot
Tags
Neighborhood map
What this means for you Summary
Snapshot
- This is a 3-bed/1.0-bath single-family listed at $70k.
Deal economics
- At list price, monthly cash flow is $602 ($7k/yr) — positive.
- The deal already cash-flows at list — no discount required.
- Meets the 1% rule at list price ($1k rent vs $70k).
- Recommended offer: $62k (12.0% below list) — sets the bar for market timing.
- Cap rate 16.6% vs local median 10.2% in Detroit — top-decile yield for the area; either an underpriced asset or a hidden risk that comps aren't pricing in. Stress-test before assuming the spread holds.
Location & tenants
- Location reads 73/100 on livability (#218 in MI) — a middle-class / working-renter tenant base. Strengths: amenities A+, commute A+, cost of living A+; Watch: schools F, crime F, employment F.
- Detroit Public Schools Community District (urban): math 10% / reading 24% proficiency, ranked #499 of 540 in MI (top 92%) — low school quality limits family demand, transient renter base, plan for 1-2y turnover; 90% free/reduced lunch — lower-income household profile, screen leases tightly.
- Market conditions: Rents rising fast (+6.7%/yr); 226 active listings in the ZIP; 35 comparable units currently listed for rent nearby; rentals at typical pace (median 17d on market — plan ~3-4 weeks tenant-placement turnaround); lower-income renter base — watch delinquency; 2,639 units permitted in Wayne County in 2024 (1,216 in 5+ unit buildings).
- At $1,348/mo this rent would consume 46% of the median local household income ($35k/yr) (locally 2372% of renters already pay >50% of income on rent) — very limited rent-growth headroom before tenants either downsize or default.
Forward outlook
- Local home prices are declining (-3.0%/yr); year-one equity from $484 of loan paydown is wiped out by about $2k of value loss. Plan a longer hold.
- Wayne County population projected at -17% by 2050 — secular population decline; favor cash flow + early exit over multi-decade hold.
- At projected returns (-3.0% appreciation + 6.7% rent growth), your $20k cash investment doubles in ~3 years — after that, you're playing with house money.
Negotiation context
- It's been on market 138 days — a 12% lower offer ($62k) is reasonable based on typical stale-listing flexibility.
- 11 sale attempts since 10y ago with the ask held roughly flat each time — persistent listings suggest the price (not the market) is what's stuck; bring a comps-based counter.
- Current owner paid $10k; list at $70k implies a 596% gain — meaningful room to come down on a strong offer.
Risks & watch-outs
- Watch-outs: built in 1947 — expect roof / HVAC / electrical / plumbing capex.
Questions for the listing agent
- It's been on market 138 days. Have you received any prior offers? Is the seller open to a 12% concession, seller financing, or rate buy-down credit?
- Built in 1947 — when were the roof, HVAC, electrical panel, plumbing, and water heater last replaced?
- Why hasn't it sold? Are there any deal-killer items the seller is aware of (foundation, flood, title, zoning, code violations)?
- Is there a deadline driving the sale (1031 exchange, divorce, estate, relocation)? That informs how much negotiation room exists.
- Schools are F-rated, which usually means shorter tenancies and higher turnover. Who's the typical renter profile here, and what's been the actual vacancy rate?
- Crime grade is F in this area — have there been break-ins, vandalism, or insurance claims at this property in the last 3 years? What carrier currently insures it and at what premium?
- What's the average days-on-market for RENTAL listings here right now (not sales)? A rising rental-DOM trend means longer vacancies and softer asking-rent achievability than the comps imply.
- What's the recent tenant-quality profile in this submarket — average credit score on applications, eviction rate, late-payment / NSF rate, and stable-employment percentage? A property-management company in the area should have these aggregated.
- How much new for-sale + rental construction is in the pipeline within 1–3 miles? Heavy new supply typically softens prices + rents 12–24 months out; constrained supply supports both.
Investment metrics
- 1% rule
- 1.93% ✓
- Cap rate
- 16.62%
- Cash-on-cash
- 36.87%
- DSCR
- 2.64
- GRM
- 4.3
CMA / ARV
- ARV (median comp)
- $71,253
- List price
- $69,999
- Delta
- -1.76%
- Verdict
- FAIR
- Comps
- 20 within 1.0 mi
Show comp detail 12 sales within ~0.75 mi
| Address | Dist | Beds/Ba | Sqft | Sold | Price | $/sf | Match |
|---|---|---|---|---|---|---|---|
| 18104 Runyon St | 0.14mi | 3/1.0 | 1,078 (+1%) | 0mo | $58,000 | $54 | 91 |
| 18696 Blackmoor St | 0.26mi | 3/1.0 | 1,010 (-5%) | 0mo | $77,500 | $77 | 79 |
| 17650 Beland St | 0.34mi | 3/1.5 | 1,094 (+3%) | 2mo | $67,000 | $61 | 76 |
| 17892 Runyon St | 0.23mi | 3/1.5 | 995 (-7%) | 2mo | $56,000 | $56 | 75 |
| 17665 Runyon St | 0.34mi | 3/2.0 | 1,096 (+3%) | 1mo | $50,000 | $46 | 74 |
| 17694 Teppert St | 0.31mi | 3/1.0 | 1,013 (-5%) | 6mo | $120,000 | $118 | 72 |
| 18431 Teppert St | 0.03mi | 4/1.0 (+1) | 1,200 (+13%) | 2mo | $67,500 | $56 | 70 |
| 8245 E Hildale St | 0.56mi | 3/1.0 | 1,028 (-4%) | 3mo | $45,000 | $44 | 65 |
| 18009 Beland St | 0.15mi | 3/2.0 | 1,200 (+13%) | 5mo | $102,000 | $85 | 64 |
| 8175 House St | 0.70mi | 3/1.0 | 1,160 (+9%) | 1mo | $100,000 | $86 | 52 |
| 19161 Hamburg St | 0.73mi | 3/1.0 | 960 (-10%) | 2mo | $116,000 | $121 | 48 |
| 18982 Hamburg St | 0.70mi | 3/1.0 | 952 (-11%) | 3mo | $45,000 | $47 | 48 |
Match score weights: distance 35% · size 25% · config 20% · recency 20%. Top-matched comps best support the ARV.
Projected returns pro-forma
-3.0% appreciation · 6.72% rent growth · sell at horizon
- IRR
- 36.8%
- Equity multiple
- 2.65×
- Total profit
- $32,258
- Equity at exit
- $10,437
- IRR
- 45.3%
- Equity multiple
- 6.14×
- Total profit
- $100,709
- Equity at exit
- $6,052
Cash invested: $19,600 (down + closing). Projections, not guarantees.
Landlord ↔ Tenant lean methodology
- Overall (STATE)
- 62 Landlord-Friendly
- State Michigan
- 62 Landlord-Friendly · EVEN
- County
- — inherits STATE
- City
- — inherits STATE
ZIP-level market 48234
- Home prices YoY
- -11.9%
- Rents YoY
- 6.7%
- Active inventory
- 226
- Price-to-rent
- 4.3×
Monthly cashflow live
- Estimated rent
- $1,348 high interval (Pro) →
- Mortgage (P&I)
- −$367
- Tax from tax record
- −$67 /mo · $802/yr
- Insurance
- −$29
- HOA
- −$0
- Vacancy / Maint / Mgmt
- −$283
- Net cashflow
- $602
Break-even live
UW: 25.0% down · 7.5% · 30yr · 1.5% tax · 5.0% vac · 8.0% maint · 8.0% mgmt
Financing live
Cash to close
- Down payment
- $17,500
- Closing costs
- $2,100
- Reserves months
- —
- Total cash needed
- —
Loan-product check · same deal, 3 products live
Conventional
25% down · 7.5% · 30yr
- Down + closing
- —
- Monthly P&I
- —
- Monthly cashflow
- —
- DSCR
- —
- Eligible?
- —
Personal DTI + credit; lowest rate.
DSCR
20% down · 8.5% · 30yr
- Down + closing
- —
- Monthly P&I
- —
- Monthly cashflow
- —
- DSCR
- —
- Eligible?
- —
No personal income docs; deal must DSCR.
Hard money
10% down · 12.0% · 12mo
- Down + closing
- —
- Monthly P&I
- —
- Monthly cashflow
- —
- DSCR
- —
- Eligible?
- —
Short-term bridge; refi at stabilization.
Rent comps 35 comps
| Address | Beds | Baths | Sqft | Rent | $/sqft | DOM | Units | Dist |
|---|---|---|---|---|---|---|---|---|
| 18431 Teppert St Detroit, MI | 4.0 | 1.0 | 1200 | $1,400 | $1.17 | 1d | 1 | 0.04mi |
| 11513 Greiner St Unit 11521 Greiner Detroit, MI | 2.0 | 1.0 | 942 | $1,050 | $1.11 | 43d | 1 | 0.23mi |
| 17241 Rowe St Detroit, MI | 3.0 | 1.5 | 1316 | $1,450 | $1.10 | 17d | 1 | 0.54mi |
| 17851 Strasburg St Detroit, MI | 3.0 | 1.0 | 1079 | $1,100 | $1.02 | 17d | 1 | 0.57mi |
| 18681 Barlow St Detroit, MI | 3.0 | 1.0 | 1041 | $1,400 | $1.34 | 24d | 1 | 0.69mi |
| 18703 Waltham St Detroit, MI | 2.0 | 1.0 | 1000 | $1,100 | $1.10 | 43d | 1 | 0.75mi |
| 11074 Kennebec St Detroit, MI | 3.0 | 1.0 | 1200 | $1,350 | $1.12 | 43d | 1 | 0.84mi |
| 11700 Engleside St Detroit, MI | 3.0 | 1.0 | 1000 | $1,175 | $1.18 | 43d | 1 | 0.87mi |
| 11785 Nashville St Detroit, MI | 3.0 | 2.0 | 1360 | $1,450 | $1.07 | 3d | 1 | 0.91mi |
| 7533 Quinn St Unit 1 Detroit, MI | 2.0 | 1.0 | 700 | $850 | $1.21 | 43d | 1 | 0.92mi |
| 11760 Nashville St Detroit, MI | 3.0 | 1.0 | 1200 | $1,250 | $1.04 | 17d | 1 | 0.94mi |
| 18624 Fairport St Detroit, MI | 3.0 | 1.0 | 874 | $1,450 | $1.66 | 21d | 1 | 0.95mi |
| 18624 Fairport St Unit NA Detroit, MI | 3.0 | 1.0 | 924 | $1,450 | $1.57 | 24d | 1 | 0.95mi |
| 18119 Joann St Detroit, MI | 2.0 | 1.0 | 800 | $1,100 | $1.38 | 24d | 1 | 0.97mi |
| 19207 Westphalia St Detroit, MI | 4.0 | 1.0 | 1179 | $1,800 | $1.53 | 17d | 1 | 0.97mi |
| 19143 Fairport St Detroit, MI | 3.0 | 1.0 | 1070 | $1,225 | $1.14 | 17d | 1 | 1.00mi |
| 13218 Greiner St Detroit, MI | 3.0 | 1.0 | 1162 | $1,195 | $1.03 | 17d | 1 | 1.04mi |
| 19419 Westphalia St Detroit, MI | 3.0 | 1.0 | 1293 | $1,325 | $1.02 | 17d | 1 | 1.04mi |
| 19170 Joann St Detroit, MI | 4.0 | 1.0 | 1020 | $1,400 | $1.37 | 43d | 1 | 1.09mi |
| 19171 Cliff St Detroit, MI | 3.0 | 1.0 | 1000 | $1,200 | $1.20 | 16d | 1 | 1.09mi |
| 19610 Westphalia St Detroit, MI | 3.0 | 1.0 | 1200 | $1,595 | $1.33 | 17d | 1 | 1.14mi |
| 12112 Christy St Unit 12110 Detroit, MI | 2.0 | 1.0 | 950 | $1,200 | $1.26 | 43d | 1 | 1.16mi |
| 12110 Christy St Detroit, MI | 2.0 | 1.5 | 950 | $1,200 | $1.26 | 17d | 1 | 1.16mi |
| 19220 Alcoy St Detroit, MI | 3.0 | 1.0 | 1023 | $1,350 | $1.32 | 17d | 1 | 1.17mi |
| 7600 Dobel St Detroit, MI | 3.0 | 1.0 | 1234 | $1,400 | $1.13 | 16d | 1 | 1.19mi |
| 20290 Annott St Detroit, MI | 3.0 | 1.0 | 1300 | $1,250 | $0.96 | 17d | 1 | 1.27mi |
| 20091 Barlow St Detroit, MI | 3.0 | 1.0 | 930 | $1,300 | $1.40 | 17d | 1 | 1.27mi |
| 19691 Cliff St #1 Detroit, MI | 2.0 | 1.0 | 850 | $1,050 | $1.24 | 4d | 1 | 1.28mi |
| 12740 August St Detroit, MI | 2.0 | 1.0 | 900 | $1,300 | $1.44 | 4d | 1 | 1.37mi |
| 20296 Waltham St Detroit, MI | 3.0 | 1.5 | 986 | $1,300 | $1.32 | 17d | 1 | 1.43mi |
| 20042 Rogge St Detroit, MI | 4.0 | 2.0 | 1232 | $1,394 | $1.13 | 43d | 1 | 1.43mi |
| 13669 Pfent St Detroit, MI | 3.0 | 2.0 | 1031 | $1,374 | $1.33 | 17d | 1 | 1.43mi |
| 20553 Hamburg St Detroit, MI | 3.0 | 1.0 | 1074 | $1,300 | $1.21 | 3d | 1 | 1.43mi |
| 20027 Alcoy St Detroit, MI | 3.0 | 1.0 | 1000 | $1,349 | $1.35 | 17d | 1 | 1.46mi |
| 11765 Glenfield Ave Unit 1510880P Detroit, MI | 2.0 | 1.0 | 990 | $3,102 | $3.13 | 14d | 1 | 1.48mi |
Listing history 41 events
-
2026-06-18days on market $69,999 Active 138 DOM
-
2026-06-17days on market $69,999 Active 137 DOM
-
2026-06-15days on market $69,999 Active 135 DOM
-
2026-06-13days on market $69,999 Active 133 DOM
-
2026-06-13days on market $69,999 Active 132 DOM
-
2026-06-09days on market $69,999 Active 129 DOM
-
2026-06-08days on market $69,999 Active 128 DOM
-
2026-06-07days on market $69,999 Active 127 DOM
-
2026-06-04days on market $69,999 Active 124 DOM
-
2026-06-03days on market $69,999 Active 123 DOM
-
2026-06-01days on market $69,999 Active 121 DOM
-
2026-05-31days on market $69,999 Active 120 DOM
-
2026-01-31$70,000 Active 488-char remark
Show marketing remark (484 chars)
First time home buyer or Investor Opportunity! This Detroit bungalow is now vacant and move-in ready, offering immediate flexibility for investors or owner-occupants. Inside, you'll find classic features like original hardwood floors, a spacious living area, a traditional dining room layout. Located on a quiet block with convenient access to local schools, shopping, and major freeways. A solid addition to any portfolio - or a great place to call home. Schedule your showing today!
-
2026-01-31$70,000 Active 484-char remark
Show marketing remark (484 chars)
First time home buyer or Investor Opportunity! This Detroit bungalow is now vacant and move-in ready, offering immediate flexibility for investors or owner-occupants. Inside, you'll find classic features like original hardwood floors, a spacious living area, a traditional dining room layout. Located on a quiet block with convenient access to local schools, shopping, and major freeways. A solid addition to any portfolio - or a great place to call home. Schedule your showing today!
-
2026-01-17historical
-
2026-01-17historical
-
2025-11-15price $75,000
-
2025-11-14price $75,000
-
2025-11-08price $90,000
-
2025-11-07price $90,000
-
2025-10-20$75,000 Active
-
2025-10-20$75,000 Active
-
2020-01-24historical
-
2020-01-21historical
-
2019-11-15price $59,000
-
2019-11-14price $59,000
-
2019-10-18status Active
-
2019-10-15historical
-
2019-08-30status Active
-
2019-07-16historical
-
2019-06-18$65,000 Active
-
2019-06-18$65,000 Active
-
2016-03-30soldstatus $10,051 Sold
-
2016-03-30soldstatus $10,051
-
2016-03-11status Pending
-
2016-03-11historical
-
2016-02-29price $9,900
-
2016-02-16status Active
-
2016-02-08status Pending
-
2016-01-26$14,900 Active
-
2016-01-26$9,900
ⓘ Source: listings_history table (triggers on properties + properties_extension) + one-shot
backfill from property_details.listing_events for pre-trigger history.
Tax reassessment forecast MI · Partial reset (capped growth)
- Current annual tax
- $802 · $67/mo
- Projected year-2 tax
- $940 · $78/mo
- Expected delta
- +$138/yr (+$12/mo · 17.2%)
ⓘ Screening estimate from a state-policy table — verify with the county assessor before closing.
Climate risk First Street
- Flood 1/10 Low FEMA zone X (unshaded) · 0% chance over 30 yrs
- Wildfire 1/10 Low
- Heat 3/10 Moderate 7 d/yr ≥96°F today · 14 d/yr by 30 yrs out
- Wind 2/10 Low
- Air quality 3/10 Moderate 2 unhealthy d/yr today · 5 by 30 yrs out
Nearby sold comps map
Loading sold comps map…
Walkable amenities ~0.75 mi
Loading nearby amenities…
Taxation est. · year 1
- Rental income
- $16,182
- − Mortgage interest
- −$3,921
- − Property taxes
- −$802
- − Insurance
- −$350
- − Repairs & maintenance
- −$1,295
- − Management
- −$1,295
- − Depreciation
- −$2,036
- Taxable income
- $6,484
- Est. tax owed @ 24.0%
- −$1,556
- After-tax cash flow
- $5,671/yr
For passive investors: Depreciation is non-cash, so a rental often shows a tax loss while cash-flowing — sheltering income. Rental losses are passive: they offset passive income freely, and up to $25,000/yr can offset ordinary (W-2) income if you actively participate and your MAGI is under $100k (phasing out to $0 by $150k); unused losses carry forward. On sale, claimed depreciation is recaptured at up to 25%, and gains may owe capital-gains tax (a 1031 exchange can defer both). Figures are a year-1 estimate at your 24.0% rate — not tax advice; consult a CPA.
Schools (NCES district)
- District
- Detroit Public Schools Community District
- NCES district ID
- 2601103
- Math proficiency
- 10% ▼ -2.00%
- Reading proficiency
- 24% ▲ 6.00%
- Median HH income
- $25,815
- Composite
- 13.06/100
- National rank
- #9564
- State rank
- #499 of 540 in MI
Livability — Detroit
- Score
- 73/100
- State rank
- #218
- US rank
- #5427
Category grades
Schools grade is shown separately in the Schools card above.
Census & demographics
- Census place
- Detroit, MI
- County
- Wayne County · 1,562,939 people
- City population
- 572,865
- Metro
- Detroit-Warren-Dearborn, MI
- Population (ZIP)
- 32,760
- Household income
- $35,322
- Rent vs Own
- Severe rent burden
- 2372.0
Population outlook (Wayne County) Hauer SSP2
- Today (2025)
- 1,675,273 people
- By 2030
- 1,620,300 · -3.3%
- By 2040
- 1,502,341 · -10.3%
- By 2050
- 1,384,039 · -17.4%
- By 2075
- 1,124,592 · -32.9%
- By 2100
- 881,193 · -47.4%
Race, ethnicity, and origin ACS 2023
- Neighborhood character
- Predominantly Black (94%)
- Race & ethnicity
- Black 94% White 3% Two or more races 1%
- Common ancestry
- Romanian 1%
- Foreign-born
- 2% · Canada, Vietnam, Philippines
- Languages at home
- 97% English-only · French/Haitian/Cajun 1%
Political lean MEDSL · Wayne
- 2024 margin
- Strong D (+29.0) · D 62.7% · R 33.7% · Other 3.6%
- 2008→2024 swing
- -20.5pp toward R · 2008: 49.5pp · 2024: 29.0pp
- All cycles
- 2024: D+29.0 2020: D+38.1 2016: D+37.3 2012: D+46.9 2008: D+49.5
Not yet ingested
- Civics
- —
Market trends
- HPI YoY
- ▼ -44.65%
- Current HPI
- 328.8978
- Rent YoY
- ▲ 6.72%
- Metro
- Detroit-Warren-Dearborn, MI
- State GDP YoY
- ▲ 1.37%
- F500 in state
- 28
Industry mix (Fortune 500 HQ in MI)
| Industry | F500 HQs | Revenue |
|---|---|---|
| Automotive Parts | 3 | $48B |
|
||
| Automotive | 2 | $372B |
|
||
| Chemicals | 1 | $45B |
|
||
| Automotive Retail | 1 | $29B |
|
||
| Healthcare / Medical Devices | 1 | $23B |
|
||
| Automotive Technology | 1 | $20B |
|
||
Price history
+607.1% since first listed29 events — show timeline
- 2026-01-31 Listed $70,000 REALCOMP
- 2026-01-31 Listed $70,000 MiRealSource-MiMLS
- 2026-01-17 Listing Removed — REALCOMP
- 2026-01-17 Listing Removed — MiRealSource-MiMLS
- 2025-11-15 Price Changed $75,000 MiRealSource-MiMLS
- 2025-11-14 Price Changed $75,000 REALCOMP
- 2025-11-08 Price Changed $90,000 MiRealSource-MiMLS
- 2025-11-07 Price Changed $90,000 REALCOMP
- 2025-10-20 Listed $75,000 REALCOMP
- 2025-10-20 Listed $75,000 MiRealSource-MiMLS
- 2020-01-24 Listing Removed — REALCOMP
- 2020-01-21 Listing Removed — MiRealSource-MiMLS
- 2019-11-15 Price Changed $59,000 MiRealSource-MiMLS
- 2019-11-14 Price Changed $59,000 REALCOMP
- 2019-10-18 Relisted — REALCOMP
- 2019-10-15 Listing Removed — REALCOMP
- 2019-08-30 Relisted — REALCOMP
- 2019-07-16 Listing Removed — REALCOMP
- 2019-06-18 Listed $65,000 MiRealSource-MiMLS
- 2019-06-18 Listed $65,000 REALCOMP
- 2016-03-30 Sold (MLS) $10,051 MiRealSource-MiMLS
- 2016-03-30 Sold (MLS) $10,051 REALCOMP
- 2016-03-11 Pending — REALCOMP
- 2016-03-11 Listing Removed — MiRealSource-MiMLS
- 2016-02-29 Price Changed $9,900 REALCOMP
- 2016-02-16 Relisted — REALCOMP
- 2016-02-08 Pending — REALCOMP
- 2016-01-26 Listed $14,900 REALCOMP
- 2016-01-26 Listed $9,900 MiRealSource-MiMLS
Property tax history
-5.6%/yrLatest (2025): $802 · -46.9% YoY. Source: county tax records.
Cash-flow waterfall
monthlySold comps — $/sqft
last 12 mo · ≤1 miLoading sold comps…