 Duplex
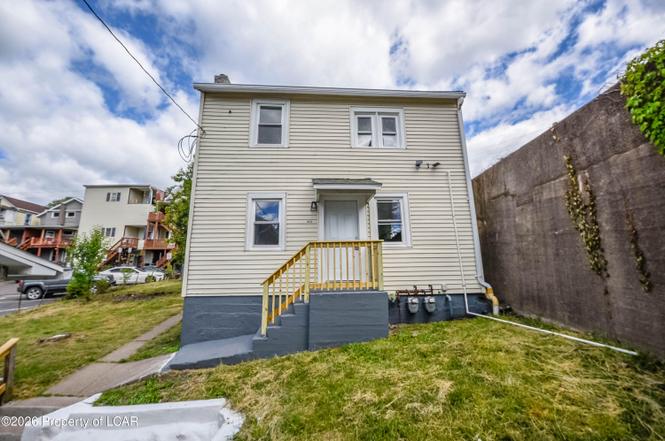
451 Moss St · Plymouth, PA
Flood risk 4/10 · Minor
- FEMA flood zone
- X (unshaded)
- Chance of flooding over 30 yrs
- 0.22%
- Est. flood insurance / yr
- $507 – $1,088
Fire risk 3/10 · Minor
- Est. fire insurance / yr
- $511 – $949
Heat risk 4/10 · Minor
- Hot days now (above 97°F)
- 7 days/yr
- Hot days in 30 yrs
- 16 days/yr
Wind risk 3/10 · Minor
- Chance of severe wind over 30 yrs
- 4.0%
Air-quality risk 2/10 · Minimal
- Unhealthy air days now
- 1 days/yr
- Unhealthy air days in 30 yrs
- 2 days/yr
Risk factors via First Street. Map © Google.
Why this score? — see what drove the B- grade
The composite is a weighted blend of 9 inputs, each scored 0–100. Each bar is that input's sub-score; the figure is the points it added to the 100-point composite (weight × sub-score).
- Cash flow +29.5/30.0
- DSCR +10.0/10.0
- ARV discount +9.9/15.0
- 1% rule +7.8/10.0
- Livability +3.3/5.0
- Rent growth +2.5/5.0
- Schools +2.5/10.0
- Condition / age +2.5/5.0
- Appreciation +0.0/10.0
$199,900
🖨 Deal sheet (PDF) 📄 Offer letter ✓ Due diligence
Multi-family units
County records classify this as Multi-Family (2-4 Unit). Listing-text estimate: 2 units. confirmed
Listing remarks MLS
Investor special in Plymouth priced at $95,000 with serious value add potential! This duplex offers two separate units with existing layout in place and the opportunity to renovate and significantly improve rents. The property needs work, but the structure, footprint, and multi unit configuration create a strong foundation for the right buyer ready to roll up their sleeves. Interior spaces are ready for updates, allowing you to modernize kitchens, baths, flooring, and finishes to maximize long term performance. With separate entrances and defined living areas, the setup is already there for a functional income producing property once improvements are completed. Exterior features include covered entry areas and off street access from the rear. With the right upgrades, this property can be repositioned into a solid cash flowing asset at an attractive basis. Conveniently located near local shops, restaurants, schools, and everyday amenities. Just minutes to Route 11 and Route 92 with easy access to Wilkes Barre, Nanticoke, and the broader Wyoming Valley employment centers. Close to the Susquehanna River and nearby parks for added lifestyle appeal. At this price point, opportunities with this much upside do not last. If you are looking for your next project with real income potential, this one deserves a serious look. Schedule your tour today!
Key facts
- Up and down duplex
- Modern kitchens
- Immediate income
Tags
Property features AI
Finance
- Financial info: Annual tax listed
Exterior
- Parking: Off-street parking
- Utilities: Public water; Public sewer
- Home design: Multi-family residential income property
- Construction: Vinyl siding
- Exterior features: Lot approximately 50 x 180; Zoned for multi-family
Interior
- Heating & cooling: Electric heating available; Natural gas heating available; Baseboard heating; Forced air heating
- Interior features: Basement
Neighborhood map
What this means for you Summary
Snapshot
- This is a 2 × 3-bed/2.0-bath units multifamily listed at $200k.
Deal economics
- At list price, monthly cash flow is $715 ($9k/yr) — positive. Per door: $357/mo.
- The deal already cash-flows at list — no discount required.
- Meets the 1% rule at list price ($3k rent vs $200k).
- Cap rate 10.6% vs local median 8.3% in Plymouth — meaningfully above typical; check what's discounted (condition, days-on-market, listing class) to confirm the premium yield is real.
Location & tenants
- Location reads 66/100 on livability (#1,068 in PA) — a middle-class / working-renter tenant base. Strengths: cost of living A+, health & safety A+, housing B+; Watch: employment D, crime F, amenities F.
- Wyoming Valley West SD (suburban): math 18% / reading 42% proficiency, ranked #445 of 539 in PA (top 83%) — families likely to look elsewhere, expect single-tenant / working-renter base with shorter leases.
- Market conditions: 61 active listings in the ZIP; 349 units permitted in Luzerne County in 2024 (16 in 5+ unit buildings).
Forward outlook
- Local home prices are declining (-3.0%/yr); year-one equity from $1k of loan paydown is wiped out by about $6k of value loss. Plan a longer hold.
- Luzerne County population projected at +4% by 2050 — modest demand growth; plan on rents tracking national, not racing it.
- At projected returns (-3.0% appreciation + 3.0% rent growth), your $56k cash investment doubles in ~8 years — after that, you're playing with house money.
Negotiation context
- Only 2 days on market — expect competitive offers; lowballing is unlikely to land.
- 4 sale attempts with the ask held roughly flat each time — persistent listings suggest the price (not the market) is what's stuck; bring a comps-based counter.
- Current owner paid $86k; list at $200k implies a 132% gain — meaningful room to come down on a strong offer.
Risks & watch-outs
- Watch-outs: built in 1900 — expect roof / HVAC / electrical / plumbing capex.
Questions for the listing agent
- Can we see the unit-by-unit rent roll, current vacancy, and any below-market leases? What's the average tenancy length?
- What capital expenditures (roof, boiler, parking lot, exteriors) have been made in the last 5 years, and what's planned in the next 2?
- Built in 1900 — when were the roof, HVAC, electrical panel, plumbing, and water heater last replaced?
- Is there a deadline driving the sale (1031 exchange, divorce, estate, relocation)? That informs how much negotiation room exists.
- Crime grade is F in this area — have there been break-ins, vandalism, or insurance claims at this property in the last 3 years? What carrier currently insures it and at what premium?
- What's the average days-on-market for RENTAL listings here right now (not sales)? A rising rental-DOM trend means longer vacancies and softer asking-rent achievability than the comps imply.
- What's the recent tenant-quality profile in this submarket — average credit score on applications, eviction rate, late-payment / NSF rate, and stable-employment percentage? A property-management company in the area should have these aggregated.
- How much new apartment / multifamily construction is in the pipeline within 1–3 miles? Heavy new supply (>2% of stock underway) typically softens rents 12–24 months out; light construction supports rent growth.
Investment metrics
- 1% rule
- 1.28% ✓
- Cap rate
- 10.58%
- Cash-on-cash
- 15.32%
- DSCR
- 1.68
- GRM
- 6.5
CMA / ARV
- ARV (on-the-fly)
- $211,140
- Comps found
- 1
Show comp detail 1 sale within ~0.75 mi
| Address | Dist | Beds/Ba | Sqft | Sold | Price | $/sf | Match |
|---|---|---|---|---|---|---|---|
| 557-559 Fellows Ave | 0.75mi | 5/3.0 (-1) | 2,090 (+14%) | 19mo | $240,000 | $115 | 18 |
Match score weights: distance 35% · size 25% · config 20% · recency 20%. Top-matched comps best support the ARV.
Projected returns pro-forma
-3.0% appreciation · 3.0% rent growth · sell at horizon
- IRR
- 6.0%
- Equity multiple
- 1.23×
- Total profit
- $13,124
- Equity at exit
- $29,806
- IRR
- 15.4%
- Equity multiple
- 2.25×
- Total profit
- $70,010
- Equity at exit
- $17,284
Cash invested: $55,972 (down + closing). Projections, not guarantees.
Landlord ↔ Tenant lean methodology
- Overall (STATE)
- 62 Landlord-Friendly
- State Pennsylvania
- 62 Landlord-Friendly · EVEN
- County
- — inherits STATE
- City
- — inherits STATE
ZIP-level market 18651
- Home prices YoY
- -11.5%
- Active inventory
- 61
- Price-to-rent
- 13.0×
Monthly cashflow live
- Estimated rent
- $2,554 high interval (Pro) →
- Mortgage (P&I)
- −$1,048
- Tax from tax record
- −$171 /mo · $2,055/yr
- Insurance
- −$83
- HOA
- −$0
- Vacancy / Maint / Mgmt
- −$536
- Net cashflow
- $715
Break-even live
Sensitivity live
| Price | -10% $828 | -5% $771 | +0% $715 | +5% $658 | +10% $602 |
|---|---|---|---|---|---|
| Rent | -10% $513 | -5% $614 | +0% $715 | +5% $816 | +10% $917 |
| Rate | -1.0pp $815 | -0.5pp $766 | base $715 | +0.5pp $663 | +1.0pp $610 |
2-unit breakdown (identical units grouped — click to expand)
| Units | Beds | Baths | Est. rent |
|---|---|---|---|
| 2× units | 3 | 2 | $2,554 |
| #1 | 3 | 2 | $1,277 |
| #2 | 3 | 2 | $1,277 |
| Total (2 units) | $2,554 | ||
UW: 25.0% down · 7.5% · 30yr · 1.5% tax · 5.0% vac · 8.0% maint · 8.0% mgmt
Financing live
Cash to close
- Down payment
- $49,975
- Closing costs
- $5,997
- Reserves months
- —
- Total cash needed
- —
Loan-product check · same deal, 3 products live
Conventional
25% down · 7.5% · 30yr
- Down + closing
- —
- Monthly P&I
- —
- Monthly cashflow
- —
- DSCR
- —
- Eligible?
- —
Personal DTI + credit; lowest rate.
DSCR
20% down · 8.5% · 30yr
- Down + closing
- —
- Monthly P&I
- —
- Monthly cashflow
- —
- DSCR
- —
- Eligible?
- —
No personal income docs; deal must DSCR.
Hard money
10% down · 12.0% · 12mo
- Down + closing
- —
- Monthly P&I
- —
- Monthly cashflow
- —
- DSCR
- —
- Eligible?
- —
Short-term bridge; refi at stabilization.
Listing history 3 events
-
2026-06-18days on market $199,900 Active 2 DOM
-
2026-06-17remarks 307-char remark
-
2026-06-17$199,900 Active 1 DOM
ⓘ Source: listings_history table (triggers on properties + properties_extension) + one-shot
backfill from property_details.listing_events for pre-trigger history.
Tax reassessment forecast PA · Partial reset (capped growth)
- Current annual tax
- $2,055 · $171/mo
- Projected year-2 tax
- $2,607 · $217/mo
- Expected delta
- +$552/yr (+$46/mo · 26.8%)
ⓘ Screening estimate from a state-policy table — verify with the county assessor before closing.
Climate risk First Street
- Flood 4/10 Moderate FEMA zone X (unshaded) · 22% chance over 30 yrs
- Wildfire 3/10 Moderate
- Heat 4/10 Moderate 7 d/yr ≥97°F today · 16 d/yr by 30 yrs out
- Wind 3/10 Moderate 4% chance of damaging wind over 30 yrs
- Air quality 2/10 Low 1 unhealthy d/yr today · 2 by 30 yrs out
Nearby sold comps map
Loading sold comps map…
Walkable amenities ~0.75 mi
Loading nearby amenities…
Taxation est. · year 1
- Rental income
- $30,648
- − Mortgage interest
- −$11,198
- − Property taxes
- −$2,055
- − Insurance
- −$1,000
- − Repairs & maintenance
- −$2,452
- − Management
- −$2,452
- − Depreciation
- −$5,815
- Taxable income
- $5,677
- Est. tax owed @ 24.0%
- −$1,362
- After-tax cash flow
- $7,215/yr
For passive investors: Depreciation is non-cash, so a rental often shows a tax loss while cash-flowing — sheltering income. Rental losses are passive: they offset passive income freely, and up to $25,000/yr can offset ordinary (W-2) income if you actively participate and your MAGI is under $100k (phasing out to $0 by $150k); unused losses carry forward. On sale, claimed depreciation is recaptured at up to 25%, and gains may owe capital-gains tax (a 1031 exchange can defer both). Figures are a year-1 estimate at your 24.0% rate — not tax advice; consult a CPA.
Schools (NCES district)
- District
- Wyoming Valley West SD
- NCES district ID
- 4225950
- Math proficiency
- 18% ▼ -11.00%
- Reading proficiency
- 42% ▼ -12.00%
- Median HH income
- $42,437
- Composite
- 25.38/100
- National rank
- #7470
- State rank
- #445 of 539 in PA
Livability — Plymouth
- Score
- 66/100
- State rank
- #1068
- US rank
- #12056
Category grades
Schools grade is shown separately in the Schools card above.
Census & demographics
- Census place
- Plymouth, PA
- Population (ZIP)
- 8,672
Population outlook (Luzerne County) Hauer SSP2
- Today (2025)
- 319,505 people
- By 2030
- 319,943 · +0.1%
- By 2040
- 322,643 · +1.0%
- By 2050
- 330,817 · +3.5%
- By 2075
- 379,145 · +18.7%
- By 2100
- 431,908 · +35.2%
Race, ethnicity, and origin ACS 2023
- Neighborhood character
- Predominantly White (82%)
- Race & ethnicity
- White 82% Hispanic / Latino 10% Black 5% Two or more races 4%
- Hispanic origin (detail)
- Mexican 3% Dominican 5%
- Common ancestry
- Romanian 19% Scotch-Irish 2% Iranian 2%
- Foreign-born
- 5% · Canada
- Languages at home
- 91% English-only · Spanish 7% Other Indo-European 1%
Political lean MEDSL · Luzerne
- 2024 margin
- R (+19.2) · D 40.0% · R 59.2%
- 2008→2024 swing
- -27.6pp toward R · 2008: 8.4pp · 2024: -19.2pp
- All cycles
- 2024: R+19.2 2020: R+14.4 2016: R+19.6 2012: D+4.8 2008: D+8.4
Not yet ingested
- Civics
- —
Market trends
- HPI YoY
- ▼ -29.78%
- Current HPI
- 229.6791
- Rent YoY
- —
- Metro
- —
- State GDP YoY
- ▲ 1.68%
- F500 in state
- 34
Industry mix (Fortune 500 HQ in PA)
| Industry | F500 HQs | Revenue |
|---|---|---|
| Healthcare | 2 | $309B |
|
||
| Insurance | 2 | $27B |
|
||
| Telecommunications / Media | 1 | $124B |
|
||
| Industrial Distribution | 1 | $22B |
|
||
| Financial Services | 1 | $20B |
|
||
| Chemicals / Materials | 1 | $18B |
|
||
Price history
+566.3% since first listed10 events — show timeline
- 2026-06-17 Listed $199,900 LCAR
- 2026-05-27 Sold (Public Records) $86,250 Public Records
- 2026-05-12 Sold (MLS) $86,250 LCAR
- 2026-05-12 Sold (MLS) $86,250 PMAR
- 2026-03-19 Pending — LCAR
- 2026-03-19 Pending — PMAR
- 2026-03-12 Listed $95,000 LCAR
- 2026-03-10 Listed $95,000 PMAR
- 2026-02-27 Listed $95,000 PMAR
- 2014-01-17 Sold (Public Records) $30,000 Public Records
Property tax history
+2.2%/yrLatest (2026): $2,055 · +1.8% YoY. Source: county tax records.
Cash-flow waterfall
monthlySold comps — $/sqft
last 12 mo · ≤1 miLoading sold comps…