127 10th St · Sultan, WA
Flood risk 7/10 · Major
- FEMA flood zone
- X (shaded)
- Chance of flooding over 30 yrs
- 0.75%
- Est. flood insurance / yr
- $507 – $1,088
Fire risk 3/10 · Minor
- Est. fire insurance / yr
- $604 – $1,122
Heat risk 2/10 · Minimal
- Hot days now (above 88°F)
- 8 days/yr
- Hot days in 30 yrs
- 17 days/yr
Wind risk 1/10 · Minimal
- Chance of severe wind over 30 yrs
- —
Air-quality risk 7/10 · Major
- Unhealthy air days now
- 10 days/yr
- Unhealthy air days in 30 yrs
- 11 days/yr
Risk factors via First Street. Map © Google.
Why this score? — see what drove the C- grade
The composite is a weighted blend of 9 inputs, each scored 0–100. Each bar is that input's sub-score; the figure is the points it added to the 100-point composite (weight × sub-score).
- ARV discount +15.0/15.0
- Cash flow +14.5/30.0
- Schools +4.5/10.0
- DSCR +4.4/10.0
- 1% rule +3.8/10.0
- Livability +3.7/5.0
- Rent growth +2.5/5.0
- Condition / age +2.5/5.0
- Appreciation +0.0/10.0
$360,900
🖨 Deal sheet (PDF) 📄 Offer letter ✓ Due diligence
Listing remarks
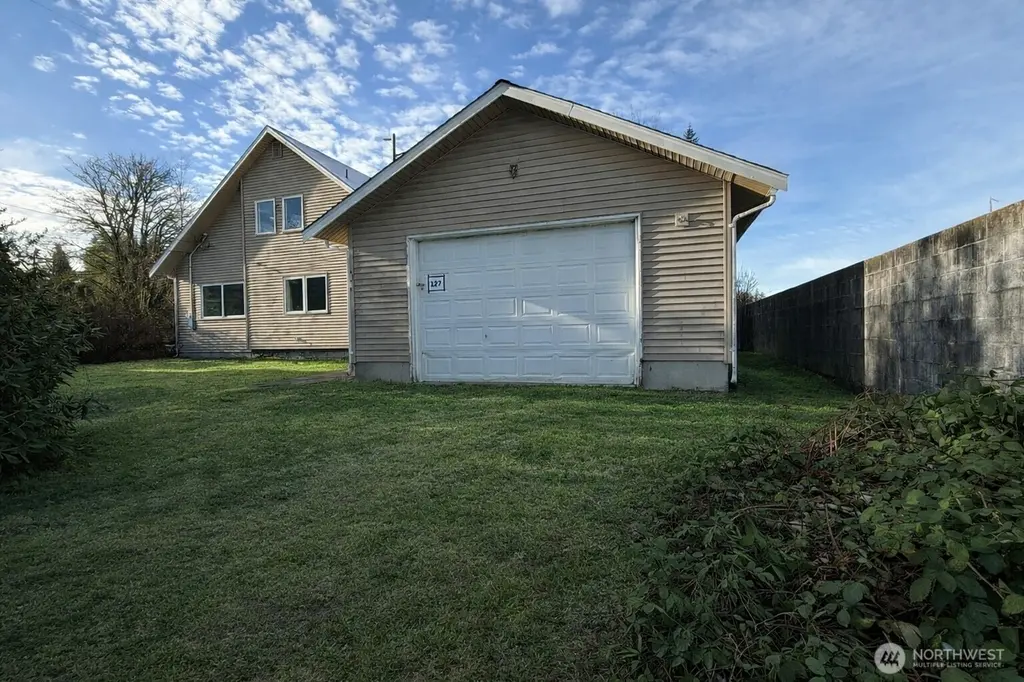
Opportunity in the heart of Sultan! This spacious 2,382 sq ft home sits on a . 22 acre corner lot and offers a rare mix of in-town convenience with a private feel. With 4 bedrooms plus a large bonus room upstairs and vaulted ceilings, there’s plenty of space to reimagine and bring your vision to life. Primary bedroom on the main level features an unfinished en suite bathroom, walk-in closet, and French doors opening to the backyard. Upstairs includes an unfinished full bath. The layout offers great potential with generous living areas, a covered back porch for year-round use, and a large garage with room for vehicles, storage, or hobbies. Unfinished cellar with exterior access is perf
Key facts
- Newer furnace
- Walk-in closet
- French doors
Tags
Property features AI
Finance
- Other: Living area reported as 2,382; MLS square footage source: Snohomish County Assessor; Lot size reported as approximately 0.2285 acres; MLS status: Active; On market date: May 5, 2026; Buyer brokerage compensation: 2.5%
- Financial info: Listing terms include Cash and Rehab Loan (see remarks)
Exterior
- Parking: Detached garage with 2 covered spaces (approx. 400 sq ft)
- Security: Fully fenced; Security gate
- Utilities: Public water (City of Sultan); Sewer connected; Power via PUD; Water heater uses propane
- Home design: Single family residence; Two-story; East-facing; Built on lot
- Construction: Metal/vinyl exterior; Composition roof; Poured concrete foundation; House structure; Built with electric and propane energy sources
- Exterior features: Deck; Fully fenced yard; Gated entry; Fruit trees; Garden space; Corner lot
Interior
- Bedrooms: 4 bedrooms (2 on main level, 2 upper level)
- Flooring: See remarks
- Bathrooms: 2 full bathrooms; 1 half bathroom; 2 bathtubs; 2 showers; Main level has 2 bathrooms (1 full and 1 half); upper level has 1 full bathroom
- Heating & cooling: Forced air heating; Heat pump; Forced air cooling (heat pump)
- Interior features: Dining room; Walk-in closets; Water heater
- Laundry & utility: Propane water heater located in upstairs closet
Neighborhood map
What this means for you Summary
Snapshot
- This is a 4-bed/2.5-bath single-family listed at $361k.
Deal economics
- At list price, monthly cash flow is $11 ($133/yr) — positive.
- The deal already cash-flows at list — no discount required.
- To meet the 1% rule (rent ≥ 1% of price), the offer needs to be $316k (12.5% below list).
- Recommended offer: $316k (12.5% below list) — sets the bar for 1% rule.
- Cap rate 6.6% vs local median 3.0% in Sultan — top-decile yield for the area; either an underpriced asset or a hidden risk that comps aren't pricing in. Stress-test before assuming the spread holds.
Location & tenants
- Location reads 74/100 on livability (#183 in WA, #4,863 nationally) — a middle-class / working-renter tenant base. Strengths: housing A+, crime A, employment A; Watch: cost of living D+, amenities F, health & safety F.
- Sultan School District (town): math 42% / reading 56% proficiency, ranked #143 of 291 in WA (top 49%) — families likely to look elsewhere, expect single-tenant / working-renter base with shorter leases.
- Market conditions: 104 active listings in the ZIP; 6 comparable units currently listed for rent nearby; rentals at typical pace (median 19d on market — plan ~3-4 weeks tenant-placement turnaround); 3,982 units permitted in Snohomish County in 2024 (1,492 in 5+ unit buildings).
Forward outlook
- Local home prices are declining (-3.0%/yr); year-one equity from $2k of loan paydown is wiped out by about $11k of value loss. Plan a longer hold.
- Snohomish County population projected at +30% by 2050 — long-run rental-demand tailwind backs the buy-and-hold thesis.
Negotiation context
- Only 13 days on market — expect competitive offers; lowballing is unlikely to land.
- 2 sale attempts since 20y ago with the ask held roughly flat each time — persistent listings suggest the price (not the market) is what's stuck; bring a comps-based counter.
- Current owner paid $10k; list at $361k implies a 3509% gain — meaningful room to come down on a strong offer.
Risks & watch-outs
- Watch-outs: flood insurance adds $66/mo.
- Climate carrying-cost: major flood risk — expect insurance premiums to compound above CPI over the hold.
Questions for the listing agent
- What's the actual annual flood-insurance premium (NFIP or private), and is the property in a SFHA with mandatory coverage?
- Is there a deadline driving the sale (1031 exchange, divorce, estate, relocation)? That informs how much negotiation room exists.
- Schools are B-rated — typically a magnet for longer-tenancy family renters. What's the average tenant stay here, and is there a school-zone premium baked into asking?
- What's the average days-on-market for RENTAL listings here right now (not sales)? A rising rental-DOM trend means longer vacancies and softer asking-rent achievability than the comps imply.
- What's the recent tenant-quality profile in this submarket — average credit score on applications, eviction rate, late-payment / NSF rate, and stable-employment percentage? A property-management company in the area should have these aggregated.
- How much new for-sale + rental construction is in the pipeline within 1–3 miles? Heavy new supply typically softens prices + rents 12–24 months out; constrained supply supports both.
Investment metrics
- 1% rule
- 0.88% ✗
- Cap rate
- 6.55%
- Cash-on-cash
- 0.92%
- DSCR
- 1.04
- GRM
- 9.5
CMA / ARV
- ARV (median comp)
- $607,936
- List price
- $360,900
- Delta
- -40.64%
- Verdict
- UNDERPRICED
- Comps
- 20 within 1.0 mi
Show comp detail 12 sales within ~0.75 mi
| Address | Dist | Beds/Ba | Sqft | Sold | Price | $/sf | Match |
|---|---|---|---|---|---|---|---|
| 711 10th St | 0.54mi | 4/2.5 | 2,469 (+4%) | 2mo | $633,000 | $256 | 67 |
| 406 8th St | 0.35mi | 4/2.5 | 2,178 (-9%) | 6mo | $625,000 | $287 | 64 |
| 726 10th St | 0.58mi | 4/2.5 | 2,469 (+4%) | 10mo | $605,000 | $245 | 58 |
| 714 Murphy Way | 0.46mi | 4/2.5 | 2,166 (-9%) | 10mo | $568,000 | $262 | 55 |
| 730 10th St | 0.60mi | 4/2.5 | 2,624 (+10%) | 6mo | $655,000 | $250 | 50 |
| 511 Creekside Rd | 0.58mi | 4/2.0 | 2,270 (-5%) | 17mo | $495,000 | $218 | 49 |
| 815 Loves Hill Dr | 0.62mi | 3/2.5 (-1) | 2,222 (-7%) | 10mo | $570,000 | $257 | 47 |
| 870 Salmon Run N | 0.67mi | 5/3.0 (+1) | 2,419 (+2%) | 15mo | $595,000 | $246 | 47 |
| 306 3rd St | 0.62mi | 3/2.5 (-1) | 2,620 (+10%) | 6mo | $519,000 | $198 | 44 |
| 717 10th St | 0.56mi | 3/2.5 (-1) | 2,122 (-11%) | 11mo | $582,000 | $274 | 42 |
| 803 Loves Hill Dr | 0.61mi | 3/2.5 (-1) | 2,122 (-11%) | 10mo | $575,000 | $271 | 40 |
| 714 Junction Ln | 0.64mi | 3/2.5 (-1) | 2,090 (-12%) | 11mo | $545,000 | $261 | 36 |
Match score weights: distance 35% · size 25% · config 20% · recency 20%. Top-matched comps best support the ARV.
Projected returns pro-forma
-3.0% appreciation · 3.0% rent growth · sell at horizon
- IRR
- -16.1%
- Equity multiple
- 0.43×
- Total profit
- $-57,733
- Equity at exit
- $53,811
- IRR
- -7.7%
- Equity multiple
- 0.51×
- Total profit
- $-49,192
- Equity at exit
- $31,204
Cash invested: $101,052 (down + closing). Projections, not guarantees.
Landlord ↔ Tenant lean methodology
- Overall (STATE)
- 28 Tenant-Leaning
- State Washington
- 28 Tenant-Leaning · D+8
- County
- — inherits STATE
- City
- — inherits STATE
ZIP-level market 98294
- Home prices YoY
- -26.4%
- Active inventory
- 104
- Price-to-rent
- 9.5×
Monthly cashflow live
- Estimated rent
- $3,160 high interval (Pro) →
- Mortgage (P&I)
- −$1,893
- Tax from tax record
- −$376 /mo · $4,507/yr
- Insurance
- −$150
- Flood insurance flood zone
- −$66 /mo · $798/yr
- HOA
- −$0
- Vacancy / Maint / Mgmt
- −$664
- Net cashflow
- $11
Break-even live
Sensitivity live
| Price | -10% $215 | -5% $113 | +0% $11 | +5% $-91 | +10% $-193 |
|---|---|---|---|---|---|
| Rent | -10% $-239 | -5% $-114 | +0% $11 | +5% $136 | +10% $261 |
| Rate | -1.0pp $193 | -0.5pp $103 | base $11 | +0.5pp $-82 | +1.0pp $-178 |
UW: 25.0% down · 7.5% · 30yr · 1.5% tax · 5.0% vac · 8.0% maint · 8.0% mgmt
Financing live
Cash to close
- Down payment
- $90,225
- Closing costs
- $10,827
- Reserves months
- —
- Total cash needed
- —
Loan-product check · same deal, 3 products live
Conventional
25% down · 7.5% · 30yr
- Down + closing
- —
- Monthly P&I
- —
- Monthly cashflow
- —
- DSCR
- —
- Eligible?
- —
Personal DTI + credit; lowest rate.
DSCR
20% down · 8.5% · 30yr
- Down + closing
- —
- Monthly P&I
- —
- Monthly cashflow
- —
- DSCR
- —
- Eligible?
- —
No personal income docs; deal must DSCR.
Hard money
10% down · 12.0% · 12mo
- Down + closing
- —
- Monthly P&I
- —
- Monthly cashflow
- —
- DSCR
- —
- Eligible?
- —
Short-term bridge; refi at stabilization.
Rent comps 6 comps
| Address | Beds | Baths | Sqft | Rent | $/sqft | DOM | Units | Dist |
|---|---|---|---|---|---|---|---|---|
| 13343 325th Ave SE Sultan, WA | 3.0 | 3.0 | 1880 | $2,995 | $1.59 | 0d | 1 | 1.10mi |
| 32501 133rd Pl SE Sultan, WA | 5.0 | 3.0 | 2630 | $2,899 | $1.10 | 0d | 1 | 1.16mi |
| 1521 10th Pl #157 Sultan, WA | 4.0 | 2.5 | 2501 | $3,500 | $1.40 | 22d | 1 | 1.21mi |
| 1521 10th Pl Sultan, WA | 4.0 | 2.5 | 2501 | $3,500 | $1.40 | 18d | 1 | 1.21mi |
| 1005 17th Ave Sultan, WA | 4.0 | 2.5 | 2438 | $3,000 | $1.23 | 15d | 1 | 1.24mi |
| 1715 Gohr Rd Sultan, WA | 4.0 | 3.0 | 1847 | $3,000 | $1.62 | 44d | 1 | 1.40mi |
Listing history 5 events
-
2026-05-18status Pending
-
2026-05-05$360,900 Active
-
2006-12-21soldstatus $10,000
-
2006-12-18historical
-
2006-10-16$16,900
ⓘ Source: listings_history table (triggers on properties + properties_extension) + one-shot
backfill from property_details.listing_events for pre-trigger history.
Tax reassessment forecast WA · Resets to sale price
- Current annual tax
- $4,507 · $376/mo
- Projected year-2 tax
- $4,507 · $376/mo
- Expected delta
- $0/yr ($0/mo · 0.0%)
ⓘ Screening estimate from a state-policy table — verify with the county assessor before closing.
Climate risk First Street
- Flood 7/10 Severe FEMA zone X (shaded) · 75% chance over 30 yrs
- Wildfire 3/10 Moderate
- Heat 2/10 Low 8 d/yr ≥88°F today · 17 d/yr by 30 yrs out
- Wind 1/10 Low
- Air quality 7/10 Severe 10 unhealthy d/yr today · 11 by 30 yrs out
Nearby sold comps map
Loading sold comps map…
Walkable amenities ~0.75 mi
Loading nearby amenities…
Taxation est. · year 1
- Rental income
- $37,916
- − Mortgage interest
- −$20,216
- − Property taxes
- −$4,507
- − Insurance
- −$2,602
- − Repairs & maintenance
- −$3,033
- − Management
- −$3,033
- − Depreciation
- −$10,499
- Taxable loss
- −$5,975
- Est. tax savings @ 24.0%
- +$1,434
- After-tax cash flow
- $1,567/yr
For passive investors: Depreciation is non-cash, so a rental often shows a tax loss while cash-flowing — sheltering income. Rental losses are passive: they offset passive income freely, and up to $25,000/yr can offset ordinary (W-2) income if you actively participate and your MAGI is under $100k (phasing out to $0 by $150k); unused losses carry forward. On sale, claimed depreciation is recaptured at up to 25%, and gains may owe capital-gains tax (a 1031 exchange can defer both). Figures are a year-1 estimate at your 24.0% rate — not tax advice; consult a CPA.
Schools (NCES district)
- District
- Sultan School District
- NCES district ID
- 5308550
- Math proficiency
- 42% ▬ 0.00%
- Reading proficiency
- 56% ▲ 3.00%
- Median HH income
- $63,955
- Composite
- 45.32/100
- National rank
- #5739
- State rank
- #143 of 291 in WA
Livability — Sultan
- Score
- 74/100
- State rank
- #183
- US rank
- #4863
Category grades
Schools grade is shown separately in the Schools card above.
Census & demographics
- Census place
- Sultan, WA
- Population (ZIP)
- 7,838
Population outlook (Snohomish County) Hauer SSP2
- Today (2025)
- 899,800 people
- By 2030
- 960,975 · +6.8%
- By 2040
- 1,074,447 · +19.4%
- By 2050
- 1,171,954 · +30.2%
- By 2075
- 1,384,849 · +53.9%
- By 2100
- 1,497,296 · +66.4%
Race, ethnicity, and origin ACS 2023
- Neighborhood character
- Predominantly White (67%)
- Race & ethnicity
- White 67% Hispanic / Latino 17% Two or more races 14% Asian 8% Native American 3% Black 1%
- Hispanic origin (detail)
- Mexican 10%
- Common ancestry
- Portuguese 7% Slovak 6% Italian 2%
- Foreign-born
- 21% · Canada, Vietnam
- Languages at home
- 79% English-only · Spanish 15% Other Asian/Pacific 4% Vietnamese 1%
Political lean MEDSL · Snohomish
- 2024 margin
- D (+19.0) · D 57.8% · R 38.9% · Other 3.3%
- 2008→2024 swing
- +0.1pp no change · 2008: 18.9pp · 2024: 19.0pp
- All cycles
- 2024: D+19.0 2020: D+20.6 2016: D+16.6 2012: D+16.2 2008: D+18.9
Not yet ingested
- Civics
- —
Market trends
- HPI YoY
- ▼ -99.36%
- Current HPI
- 277.4099
- Rent YoY
- —
- Metro
- —
- State GDP YoY
- ▲ 4.65%
- F500 in state
- 22
Industry mix (Fortune 500 HQ in WA)
| Industry | F500 HQs | Revenue |
|---|---|---|
| Retail | 2 | $269B |
|
||
| Technology / Retail | 1 | $638B |
|
||
| Technology | 1 | $245B |
|
||
| Telecommunications | 1 | $38B |
|
||
| Food / Beverage | 1 | $36B |
|
||
| Automotive / Trucks | 1 | $34B |
|
||
Price history
+2035.5% since first listed5 events — show timeline
- 2026-05-18 Pending — NWMLS as Distributed by MLS Grid
- 2026-05-05 Listed $360,900 NWMLS as Distributed by MLS Grid
- 2006-12-21 Sold (MLS) $10,000 NWMLS as Distributed by MLS Grid
- 2006-12-18 Delisted — NWMLS as Distributed by MLS Grid
- 2006-10-16 Listed $16,900 NWMLS as Distributed by MLS Grid
Property tax history
+1.9%/yrLatest (2026): $4,507 · -2.8% YoY. Source: county tax records.
Cash-flow waterfall
monthlySold comps — $/sqft
last 12 mo · ≤1 miLoading sold comps…