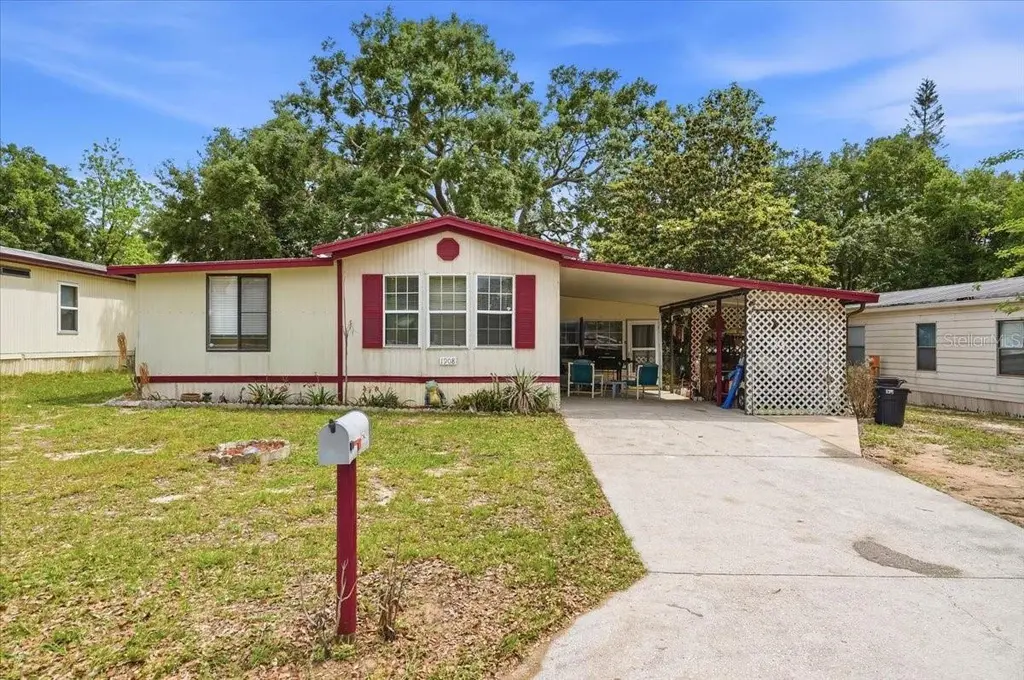
1908 Regina Dr · Lake Alfred, FL
Flood risk 1/10 · Minimal
- FEMA flood zone
- X (unshaded)
- Chance of flooding over 30 yrs
- 0.0%
- Est. flood insurance / yr
- $507 – $1,088
Fire risk 5/10 · Moderate
- Est. fire insurance / yr
- $947 – $1,759
Heat risk 8/10 · Major
- Hot days now (above 107°F)
- 7 days/yr
- Hot days in 30 yrs
- 23 days/yr
Wind risk 9/10 · Severe
- Chance of severe wind over 30 yrs
- 99.0%
Air-quality risk 2/10 · Minimal
- Unhealthy air days now
- 0 days/yr
- Unhealthy air days in 30 yrs
- 1 days/yr
Risk factors via First Street. Map © Google.
Why this score? — see what drove the B- grade
The composite is a weighted blend of 9 inputs, each scored 0–100. Each bar is that input's sub-score; the figure is the points it added to the 100-point composite (weight × sub-score).
- Cash flow +30.0/30.0
- DSCR +10.0/10.0
- 1% rule +9.2/10.0
- ARV discount +7.5/15.0
- Livability +3.6/5.0
- Schools +3.5/10.0
- Rent growth +2.5/5.0
- Condition / age +2.5/5.0
- Appreciation +0.0/10.0
$105,000
🖨 Deal sheet 📄 Offer letter ✓ Due diligence
Listing remarks
No lot rent! You can own the land and the home to build equity. Welcome to Lake Mariana Acres, located in Central Florida and is close to Orlando or Tampa. This well-maintained 2 bedroom, 1 bathroom home has a large bonus room, huge screened porch and utility room. You’ll be close to shopping, dining, entertainment, and outdoor recreation, with Florida’s beautiful beaches and natural springs just a short drive away. This lake community allows pets, golf carts and offers a variety of amenities for residents to enjoy. Access to the clubhouse is available for community events and private use. Enjoy a beautiful scenic dock, lake access, boat ramp, shuffleboard, and cornhole. Schedul
Key facts
- Huge screened porch
- Bonus room
- Close to dining
Tags
Property features AI
Finance
- Other: Homestead exempt; Total living area approximately 672 square feet
- Financial info: Unfurnished
- HOA & community: Lake Marianna HOA — $75 annually ($6.25/month); Pets allowed
Exterior
- Parking: Carport (1 space)
- Utilities: Public water; Public sewer; Cable available; Electricity connected
- Home design: Manufactured home (single wide); One level; North-facing
- Construction: Metal roof; Other construction materials; Crawlspace foundation; Built on a 0.14-acre lot
- Exterior features: Other exterior features; Asphalt road access
Interior
- Kitchen: Range; Refrigerator
- Bedrooms: 2 bedrooms
- Flooring: Carpet; Linoleum
- Bathrooms: 1 full bathroom
- Heating & cooling: Electric heating; Other cooling
- Interior features: Other interior features
- Laundry & utility: Laundry room
Neighborhood map
What this means for you Summary
Snapshot
- This is a 2-bed/1.0-bath manufactured listed at $105k.
Deal economics
- At list price, monthly cash flow is $437 ($5k/yr) — positive.
- The deal already cash-flows at list — no discount required.
- Meets the 1% rule at list price ($1k rent vs $105k).
- Recommended offer: $102k (3.0% below list) — sets the bar for market timing.
Location & tenants
- Location reads 72/100 on livability (#363 in FL) — a middle-class / working-renter tenant base. Strengths: crime A+, cost of living A+, housing A+; Watch: employment D, amenities F, commute F.
- Polk (suburban): math 39% / reading 43% proficiency, ranked #62 of 73 in FL (top 85%) — families likely to look elsewhere, expect single-tenant / working-renter base with shorter leases.
- Zoned schools: Auburndale Senior High School (math 25% / reading 31%, grade F, #464 of 667 statewide, top 70%, 1,716 students, 53% FRL).
- Zoned-school proficiency averages 28% at this address vs 41% district-wide (-13 pts) — the specific schools serving this property underperform the Polk average; the district grade overstates school quality for this exact location.
- Market conditions: 279 active listings in the ZIP; 1 comparable units currently listed for rent nearby; 10,384 units permitted in Polk County in 2024 (1,716 in 5+ unit buildings).
Forward outlook
- Local home prices are declining (-3.0%/yr); year-one equity from $726 of loan paydown is wiped out by about $3k of value loss. Plan a longer hold.
- Polk County population projected at +33% by 2050 — long-run rental-demand tailwind backs the buy-and-hold thesis.
- At projected returns (-3.0% appreciation + 3.0% rent growth), your $29k cash investment doubles in ~7 years — after that, you're playing with house money.
Negotiation context
- It's been on market 56 days — a 3% lower offer ($102k) is reasonable based on typical stale-listing flexibility.
- Current owner paid $40k; list at $105k implies a 162% gain — meaningful room to come down on a strong offer.
Risks & watch-outs
- Climate carrying-cost: severe wind risk, 99% chance of damaging wind over 30y; moderate wildfire risk; extreme-heat days projected 7→23/yr by 2055 (HVAC capex compounding) — expect insurance premiums to compound above CPI over the hold.
Questions for the listing agent
- It's been on market 56 days. Have you received any prior offers? Is the seller open to a 3% concession, seller financing, or rate buy-down credit?
- What does the HOA fee cover, when was the last increase, and are there any pending special assessments or reserve-fund shortfalls?
- Is there a deadline driving the sale (1031 exchange, divorce, estate, relocation)? That informs how much negotiation room exists.
- What's the average days-on-market for RENTAL listings here right now (not sales)? A rising rental-DOM trend means longer vacancies and softer asking-rent achievability than the comps imply.
- What's the recent tenant-quality profile in this submarket — average credit score on applications, eviction rate, late-payment / NSF rate, and stable-employment percentage? A property-management company in the area should have these aggregated.
- How much new for-sale + rental construction is in the pipeline within 1–3 miles? Heavy new supply typically softens prices + rents 12–24 months out; constrained supply supports both.
Investment metrics
- 1% rule
- 1.42% ✓
- Cap rate
- 11.28%
- Cash-on-cash
- 17.82%
- DSCR
- 1.79
- GRM
- 5.9
CMA / ARV
No comps found within radius.
Projected returns pro-forma
-3.0% appreciation · 3.0% rent growth · sell at horizon
- IRR
- 9.3%
- Equity multiple
- 1.37×
- Total profit
- $10,821
- Equity at exit
- $15,656
- IRR
- 18.5%
- Equity multiple
- 2.54×
- Total profit
- $45,355
- Equity at exit
- $9,078
Cash invested: $29,400 (down + closing). Projections, not guarantees.
Landlord ↔ Tenant lean methodology
- Overall (STATE)
- 87 Strongly Landlord-Friendly
- State Florida
- 87 Strongly Landlord-Friendly · R+3
- County
- — inherits STATE
- City
- — inherits STATE
ZIP-level market 33850
- Home prices YoY
- -8.5%
- Active inventory
- 279
- Price-to-rent
- 5.9×
Monthly cashflow live
- Estimated rent
- $1,492 medium interval (Pro) →
- Mortgage (P&I)
- −$551
- Tax from tax record
- −$142 /mo · $1,700/yr
- Insurance
- −$44
- HOA
- −$6
- Vacancy / Maint / Mgmt
- −$313
- Net cashflow
- $437
Break-even live
UW: 25.0% down · 7.5% · 30yr · 1.5% tax · 5.0% vac · 8.0% maint · 8.0% mgmt
Financing live
Cash to close
- Down payment
- $26,250
- Closing costs
- $3,150
- Reserves months
- —
- Total cash needed
- —
Loan-product check · same deal, 3 products live
Conventional
25% down · 7.5% · 30yr
- Down + closing
- —
- Monthly P&I
- —
- Monthly cashflow
- —
- DSCR
- —
- Eligible?
- —
Personal DTI + credit; lowest rate.
DSCR
20% down · 8.5% · 30yr
- Down + closing
- —
- Monthly P&I
- —
- Monthly cashflow
- —
- DSCR
- —
- Eligible?
- —
No personal income docs; deal must DSCR.
Hard money
10% down · 12.0% · 12mo
- Down + closing
- —
- Monthly P&I
- —
- Monthly cashflow
- —
- DSCR
- —
- Eligible?
- —
Short-term bridge; refi at stabilization.
Rent comps 1 comps
| Address | Beds | Baths | Sqft | Rent | $/sqft | DOM | Units | Dist |
|---|---|---|---|---|---|---|---|---|
| 150 S Nekoma Ave Lake Alfred, FL | 2.0 | 1.0 | 750 | $1,375 | $1.83 | 23d | 1 | 1.48mi |
HOA detail
- Monthly dues
- $6 · $72/yr
Listing history 19 events
-
2026-06-18days on market $105,000 Active 56 DOM
-
2026-06-17days on market $105,000 Active 55 DOM
-
2026-06-16days on market $105,000 Active 54 DOM
-
2026-06-15days on market $105,000 Active 53 DOM
-
2026-06-13days on market $105,000 Active 51 DOM
-
2026-06-10days on market $105,000 Active 48 DOM
-
2026-06-09days on market $105,000 Active 47 DOM
-
2026-06-08days on market $105,000 Active 46 DOM
-
2026-06-07days on market $105,000 Active 45 DOM
-
2026-06-05days on market $105,000 Active 42 DOM
-
2026-06-03days on market $105,000 Active 41 DOM
-
2026-06-03days on market $105,000 Active 40 DOM
-
2026-06-01days on market $105,000 Active 39 DOM
-
2026-05-31days on market $105,000 Active 38 DOM
-
2026-05-04price $105,000
-
2026-04-23$120,000 Active
-
2021-01-15soldstatus $40,000
-
1999-02-05soldstatus $25,000
-
1988-06-01soldstatus $10,000
ⓘ Source: listings_history table (triggers on properties + properties_extension) + one-shot
backfill from property_details.listing_events for pre-trigger history.
Tax reassessment forecast FL · Resets to sale price
- Current annual tax
- $1,700 · $142/mo
- Projected year-2 tax
- $1,700 · $142/mo
- Expected delta
- $0/yr ($0/mo · 0.0%)
ⓘ Screening estimate from a state-policy table — verify with the county assessor before closing.
Climate risk First Street
- Flood 1/10 Low FEMA zone X (unshaded) · 0% chance over 30 yrs
- Wildfire 5/10 Major
- Heat 8/10 Severe 7 d/yr ≥107°F today · 23 d/yr by 30 yrs out
- Wind 9/10 Extreme 99% chance of damaging wind over 30 yrs
- Air quality 2/10 Low 0 unhealthy d/yr today · 1 by 30 yrs out
Nearby sold comps map
Loading sold comps map…
Walkable amenities ~0.75 mi
Loading nearby amenities…
Taxation est. · year 1
- Rental income
- $17,902
- − Mortgage interest
- −$5,882
- − Property taxes
- −$1,700
- − Insurance
- −$525
- − Repairs & maintenance
- −$1,432
- − Management
- −$1,432
- − HOA
- −$72
- − Depreciation
- −$3,055
- Taxable income
- $3,805
- Est. tax owed @ 24.0%
- −$913
- After-tax cash flow
- $4,325/yr
For passive investors: Depreciation is non-cash, so a rental often shows a tax loss while cash-flowing — sheltering income. Rental losses are passive: they offset passive income freely, and up to $25,000/yr can offset ordinary (W-2) income if you actively participate and your MAGI is under $100k (phasing out to $0 by $150k); unused losses carry forward. On sale, claimed depreciation is recaptured at up to 25%, and gains may owe capital-gains tax (a 1031 exchange can defer both). Figures are a year-1 estimate at your 24.0% rate — not tax advice; consult a CPA.
Schools (NCES district)
- District
- Polk
- NCES district ID
- 1201590
- Math proficiency
- 39% ▼ -11.00%
- Reading proficiency
- 43% ▼ -4.00%
- Median HH income
- $43,979
- Composite
- 34.74/100
- National rank
- #5132
- State rank
- #62 of 73 in FL
Livability — Lake Alfred
- Score
- 72/100
- State rank
- #363
- US rank
- #6406
Category grades
Schools grade is shown separately in the Schools card above.
Census & demographics
- County
- Polk County · 740,051 people
- City population
- 9,757
- Metro
- Lakeland-Winter Haven, FL
- Population (ZIP)
- 9,757
- Household income
- $61,622
- Rent vs Own
- Severe rent burden
- 431.0
Population outlook (Polk County) Hauer SSP2
- Today (2025)
- 752,975 people
- By 2030
- 804,621 · +6.9%
- By 2040
- 906,117 · +20.3%
- By 2050
- 1,000,476 · +32.9%
- By 2075
- 1,197,520 · +59.0%
- By 2100
- 1,271,518 · +68.9%
Race, ethnicity, and origin ACS 2023
- Neighborhood character
- Diverse neighborhood (Simpson 0.63)
- Race & ethnicity
- White 54% Hispanic / Latino 24% Black 11% Asian 9% Two or more races 8%
- Hispanic origin (detail)
- Mexican 3% Puerto Rican 15% Dominican 2%
- Common ancestry
- Lithuanian 2% Italian 2% Romanian 1%
- Foreign-born
- 15% · Canada, China
- Languages at home
- 72% English-only · Spanish 21% Other Asian/Pacific 2% Other Indo-European 2%
Political lean MEDSL · Polk
- 2024 margin
- Strong R (+20.7) · D 39.2% · R 59.9%
- 2008→2024 swing
- -14.6pp toward R · 2008: -6.1pp · 2024: -20.7pp
- All cycles
- 2024: R+20.7 2020: R+14.4 2016: R+14.1 2012: R+6.8 2008: R+6.1
Not yet ingested
- Civics
- —
Market trends
- HPI YoY
- ▼ -32.91%
- Current HPI
- 353.941
- Rent YoY
- —
- Metro
- Lakeland-Winter Haven, FL
- State GDP YoY
- ▲ 3.28%
- F500 in state
- 36
Industry mix (Fortune 500 HQ in FL)
| Industry | F500 HQs | Revenue |
|---|---|---|
| Industrial Technology | 2 | $29B |
|
||
| Insurance | 2 | $17B |
|
||
| Retail | 1 | $60B |
|
||
| Technology Distribution | 1 | $58B |
|
||
| Homebuilding | 1 | $35B |
|
||
| Technology Manufacturing | 1 | $35B |
|
||
Price history
+950.0% since first listed5 events — show timeline
- 2026-05-04 Price Changed $105,000 Stellar MLS as Distributed by MLS Grid
- 2026-04-23 Listed $120,000 Stellar MLS as Distributed by MLS Grid
- 2021-01-15 Sold (Public Records) $40,000 Public Records
- 1999-02-05 Sold (Public Records) $25,000 Public Records
- 1988-06-01 Sold (Public Records) $10,000 Public Records
Property tax history
+79.9%/yrLatest (2025): $1,700 · +7.6% YoY. Source: county tax records.
Cash-flow waterfall
monthlySold comps — $/sqft
last 12 mo · ≤1 miLoading sold comps…