109-111 Green St · Herkimer, NY
Flood risk No data
- FEMA flood zone
- —
- Chance of flooding over 30 yrs
- —
- Est. flood insurance / yr
- —
Fire risk No data
- Est. fire insurance / yr
- —
Heat risk No data
- Hot days now (above threshold)
- —
- Hot days in 30 yrs
- —
Wind risk No data
- Chance of severe wind over 30 yrs
- —
Air-quality risk No data
- Unhealthy air days now
- —
- Unhealthy air days in 30 yrs
- —
Risk factors via First Street. Map © Google.
Why this score? — see what drove the B grade
The composite is a weighted blend of 9 inputs, each scored 0–100. Each bar is that input's sub-score; the figure is the points it added to the 100-point composite (weight × sub-score).
- Cash flow +26.7/30.0
- Appreciation +10.0/10.0
- DSCR +9.2/10.0
- ARV discount +7.5/15.0
- 1% rule +7.2/10.0
- Schools +3.9/10.0
- Livability +3.6/5.0
- Rent growth +2.5/5.0
- Condition / age +2.2/5.0
$124,500
🖨 Deal sheet (PDF) 📄 Offer letter ✓ Due diligence
Listing remarks MLS
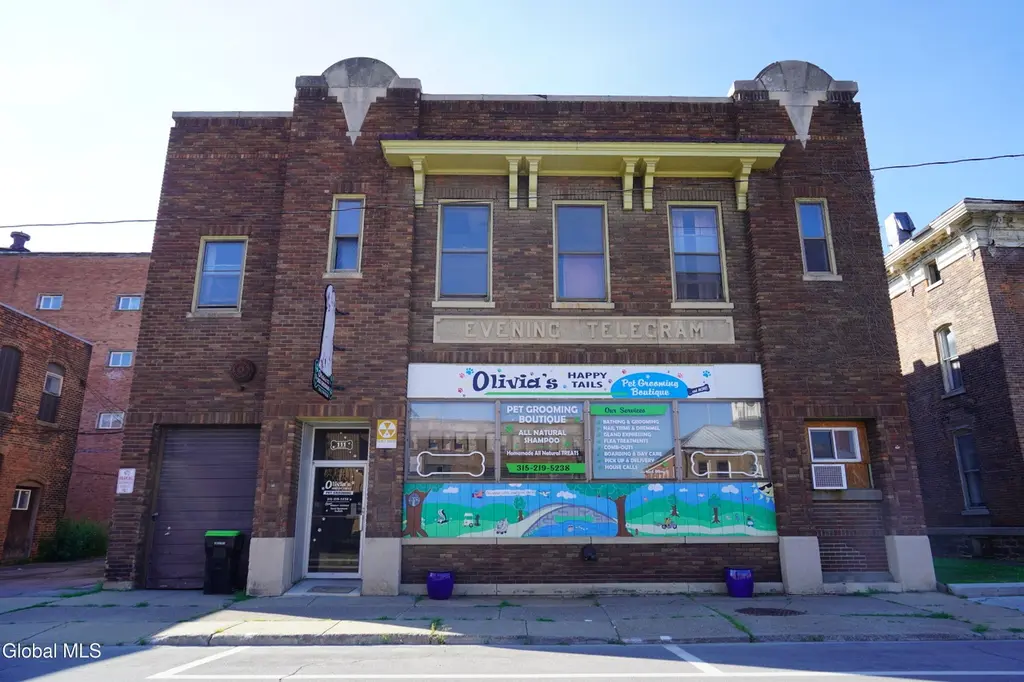
Located in downtown Herkimer, this mixed-use property spans 9,250 sq ft with flexible spaces across two levels. Ground-floor storefront offers excellent street presence, presenting abundant possibilities for a variety of uses; upper floor provides versatile space with easy access. Connected to municipal water and sewer. Conveniently located close to local amenities. 109-111 Green St Herkimer are both being sold.
Key facts
- 5,227 sq ft lot
- 6 parking spots
- Built 1919
Neighborhood map
What this means for you Summary
Snapshot
- This is a 4-bed/3.0-bath single-family listed at $124k. Condition is rated fair.
Deal economics
- At list price, monthly cash flow is $339 ($4k/yr) — positive.
- The deal already cash-flows at list — no discount required.
- Meets the 1% rule at list price ($2k rent vs $124k).
- Recommended offer: $110k (12.0% below list) — sets the bar for market timing.
- Cap rate 9.6% vs local median 5.5% in Herkimer — top-decile yield for the area; either an underpriced asset or a hidden risk that comps aren't pricing in. Stress-test before assuming the spread holds.
Location & tenants
- Location reads 71/100 on livability (#392 in NY) — a middle-class / working-renter tenant base. Strengths: cost of living A+, housing A+, health & safety A+; Watch: amenities D+, crime D, employment D.
- Herkimer Central School District (town): math 46% / reading 47% proficiency, ranked #455 of 590 in NY (top 77%) — families likely to look elsewhere, expect single-tenant / working-renter base with shorter leases.
- Zoned schools: Herkimer Elementary School (math 51% / reading 48%, grade D, #1,085 of 2,108 statewide, top 56%, 517 students, 71% FRL); Herkimer High School (math 44% / reading 48%, grade D-, #1,023 of 1,100 statewide, top 93%, 579 students, 61% FRL) — zoned schools average 66% FRL vs 46% district-wide (21 pts higher); higher-poverty schools than district average — tighter screening recommended.
- Market conditions: 57 active listings in the ZIP; 54 units permitted in Herkimer County in 2024 (0 in 5+ unit buildings).
Forward outlook
- In year one you build about $13k of equity ($861 loan paydown + $12k appreciation (10.0% local appreciation)).
- Herkimer County population projected at -24% by 2050 — secular population decline; favor cash flow + early exit over multi-decade hold.
- At projected returns (10.0% appreciation + 3.0% rent growth), your $35k cash investment doubles in ~2 years — after that, you're playing with house money.
- By year 3, paydown + projected appreciation supports a ~$34k cash-out refi (75% LTV) — recoverable capital for the next deal without selling this one.
Negotiation context
- It's been on market 336 days — a 12% lower offer ($110k) is reasonable based on typical stale-listing flexibility.
- 4 sale attempts since 2y ago; this cycle's ask has dropped $76k (38%) from the opening price — seller is motivated, your offer sets the floor, not the list.
Risks & watch-outs
- Watch-outs: built in 1919 — expect roof / HVAC / electrical / plumbing capex.
Questions for the listing agent
- It's been on market 336 days. Have you received any prior offers? Is the seller open to a 12% concession, seller financing, or rate buy-down credit?
- Have any recent inspections been done? Can we get a copy of the seller's disclosures and any deferred-maintenance estimates?
- Built in 1919 — when were the roof, HVAC, electrical panel, plumbing, and water heater last replaced?
- Why hasn't it sold? Are there any deal-killer items the seller is aware of (foundation, flood, title, zoning, code violations)?
- Is there a deadline driving the sale (1031 exchange, divorce, estate, relocation)? That informs how much negotiation room exists.
- Schools are D-rated, which usually means shorter tenancies and higher turnover. Who's the typical renter profile here, and what's been the actual vacancy rate?
- Crime grade is D in this area — have there been break-ins, vandalism, or insurance claims at this property in the last 3 years? What carrier currently insures it and at what premium?
- What's the average days-on-market for RENTAL listings here right now (not sales)? A rising rental-DOM trend means longer vacancies and softer asking-rent achievability than the comps imply.
- What's the recent tenant-quality profile in this submarket — average credit score on applications, eviction rate, late-payment / NSF rate, and stable-employment percentage? A property-management company in the area should have these aggregated.
- How much new for-sale + rental construction is in the pipeline within 1–3 miles? Heavy new supply typically softens prices + rents 12–24 months out; constrained supply supports both.
Investment metrics
- 1% rule
- 1.22% ✓
- Cap rate
- 9.56%
- Cash-on-cash
- 11.66%
- DSCR
- 1.52
- GRM
- 6.8
CMA / ARV
No comps found within radius.
Projected returns pro-forma
10.0% appreciation · 3.0% rent growth · sell at horizon
- IRR
- 32.8%
- Equity multiple
- 3.56×
- Total profit
- $89,405
- Equity at exit
- $112,159
- IRR
- 28.3%
- Equity multiple
- 8.07×
- Total profit
- $246,360
- Equity at exit
- $241,876
Cash invested: $34,860 (down + closing). Projections, not guarantees.
Landlord ↔ Tenant lean methodology
- Overall (STATE)
- 15 Strongly Tenant-Friendly
- State New York
- 15 Strongly Tenant-Friendly · D+10
- County
- — inherits STATE
- City
- — inherits STATE
ZIP-level market 13350
- Home prices YoY
- 8.9%
- Active inventory
- 57
- Price-to-rent
- 6.8×
Monthly cashflow live
- Estimated rent
- $1,518 medium interval (Pro) →
- Mortgage (P&I)
- −$653
- Tax est. 1.5%
- −$156 /mo · $1,868/yr
- Insurance
- −$52
- HOA
- −$0
- Vacancy / Maint / Mgmt
- −$319
- Net cashflow
- $339
Break-even live
Sensitivity live
| Price | -10% $425 | -5% $382 | +0% $339 | +5% $296 | +10% $253 |
|---|---|---|---|---|---|
| Rent | -10% $219 | -5% $279 | +0% $339 | +5% $399 | +10% $459 |
| Rate | -1.0pp $401 | -0.5pp $370 | base $339 | +0.5pp $306 | +1.0pp $274 |
UW: 25.0% down · 7.5% · 30yr · 1.5% tax · 5.0% vac · 8.0% maint · 8.0% mgmt
Financing live
Cash to close
- Down payment
- $31,125
- Closing costs
- $3,735
- Reserves months
- —
- Total cash needed
- —
Loan-product check · same deal, 3 products live
Conventional
25% down · 7.5% · 30yr
- Down + closing
- —
- Monthly P&I
- —
- Monthly cashflow
- —
- DSCR
- —
- Eligible?
- —
Personal DTI + credit; lowest rate.
DSCR
20% down · 8.5% · 30yr
- Down + closing
- —
- Monthly P&I
- —
- Monthly cashflow
- —
- DSCR
- —
- Eligible?
- —
No personal income docs; deal must DSCR.
Hard money
10% down · 12.0% · 12mo
- Down + closing
- —
- Monthly P&I
- —
- Monthly cashflow
- —
- DSCR
- —
- Eligible?
- —
Short-term bridge; refi at stabilization.
Listing history 27 events
-
2026-06-21days on market $124,500 Active 336 DOM
-
2026-06-21days on market $124,500 Active 335 DOM
-
2026-06-18days on market $124,500 Active 333 DOM
-
2026-06-17days on market $124,500 Active 332 DOM
-
2026-06-16days on market $124,500 Active 331 DOM
-
2026-06-15days on market $124,500 Active 330 DOM
-
2026-06-13days on market $124,500 Active 328 DOM
-
2026-06-12days on market $124,500 Active 327 DOM
-
2026-06-09days on market $124,500 Active 324 DOM
-
2026-06-08days on market $124,500 Active 323 DOM
-
2026-06-07days on market $124,500 Active 322 DOM
-
2026-06-07days on market $124,500 Active 321 DOM
-
2026-06-04days on market $124,500 Active 318 DOM
-
2026-06-02days on market $124,500 Active 317 DOM
-
2026-06-01days on market $124,500 Active 316 DOM
-
2026-05-31days on market $124,500 Active 315 DOM
-
2025-10-28price $124,500 415-char remark
Show marketing remark (415 chars)
Located in downtown Herkimer, this mixed-use property spans 9,250 sq ft with flexible spaces across two levels. Ground-floor storefront offers excellent street presence, presenting abundant possibilities for a variety of uses; upper floor provides versatile space with easy access. Connected to municipal water and sewer. Conveniently located close to local amenities. 109-111 Green St Herkimer are both being sold.
-
2025-09-09price $167,900 415-char remark
Show marketing remark (415 chars)
Located in downtown Herkimer, this mixed-use property spans 9,250 sq ft with flexible spaces across two levels. Ground-floor storefront offers excellent street presence, presenting abundant possibilities for a variety of uses; upper floor provides versatile space with easy access. Connected to municipal water and sewer. Conveniently located close to local amenities. 109-111 Green St Herkimer are both being sold.
-
2025-07-20$200,000 Active 415-char remark
Show marketing remark (415 chars)
Located in downtown Herkimer, this mixed-use property spans 9,250 sq ft with flexible spaces across two levels. Ground-floor storefront offers excellent street presence, presenting abundant possibilities for a variety of uses; upper floor provides versatile space with easy access. Connected to municipal water and sewer. Conveniently located close to local amenities. 109-111 Green St Herkimer are both being sold.
-
2025-06-30historical
-
2025-01-29price $277,777
-
2025-01-28$325,000 Active
-
2025-01-27historical
-
2024-11-25price $325,000
-
2024-10-24$600,000 Active
-
2024-10-18historical
-
2024-07-18$600,000 Active
ⓘ Source: listings_history table (triggers on properties + properties_extension) + one-shot
backfill from property_details.listing_events for pre-trigger history.
Nearby sold comps map
Loading sold comps map…
Walkable amenities ~0.75 mi
Loading nearby amenities…
Taxation est. · year 1
- Rental income
- $18,215
- − Mortgage interest
- −$6,974
- − Property taxes
- −$1,868
- − Insurance
- −$622
- − Repairs & maintenance
- −$1,457
- − Management
- −$1,457
- − Depreciation
- −$3,622
- Taxable income
- $2,215
- Est. tax owed @ 24.0%
- −$532
- After-tax cash flow
- $3,534/yr
For passive investors: Depreciation is non-cash, so a rental often shows a tax loss while cash-flowing — sheltering income. Rental losses are passive: they offset passive income freely, and up to $25,000/yr can offset ordinary (W-2) income if you actively participate and your MAGI is under $100k (phasing out to $0 by $150k); unused losses carry forward. On sale, claimed depreciation is recaptured at up to 25%, and gains may owe capital-gains tax (a 1031 exchange can defer both). Figures are a year-1 estimate at your 24.0% rate — not tax advice; consult a CPA.
Condition & rehab AI · 12 photos
A mixed-use property in fair condition with moderate rehabilitation needs. Exterior and interior paint, landscaping, and HVAC upgrades would significantly enhance its value.
Repairs flagged
- Major exterior paint — Significant discoloration and wear
- Major interior paint — Significant wear and tear
- Major landscaping — Overgrown vegetation
Value-add opportunities
- Resale exterior paint job — Enhances curb appeal and property value
- Rental HVAC system upgrade — Improves tenant comfort and reduces maintenance costs
- Both landscaping — Enhances curb appeal and property value
Renovation cost estimate screening
| Repair item | Severity | Est. cost |
|---|---|---|
| exterior paint · Significant discoloration and wear | Major | $15,000–50,000 |
| interior paint · Significant wear and tear | Major | $15,000–50,000 |
| landscaping · Overgrown vegetation | Major | $15,000–50,000 |
| Total estimated repair cost · 3 items | $45,000–150,000 |
Value-add ROI direction
- Resale exterior paint job — Enhances curb appeal and property value ↑
- Rental HVAC system upgrade — Improves tenant comfort and reduces maintenance costs ↑
- Both landscaping — Enhances curb appeal and property value ↑
ⓘ Cost ranges are severity-bucket heuristics (US national rule-of-thumb). Get contractor quotes + a written scope before underwriting a rehab budget.
Schools (NCES district)
- District
- Herkimer Central School District
- NCES district ID
- 3614220
- Math proficiency
- 46% ▲ 6.00%
- Reading proficiency
- 47% ▲ 9.00%
- Median HH income
- $39,447
- Composite
- 38.87/100
- National rank
- #4100
- State rank
- #455 of 590 in NY
Livability — Herkimer
- Score
- 71/100
- State rank
- #392
- US rank
- #6787
Category grades
Schools grade is shown separately in the Schools card above.
Census & demographics
- Census place
- Herkimer, NY
- Population (ZIP)
- 9,641
Population outlook (Herkimer County) Hauer SSP2
- Today (2025)
- 59,340 people
- By 2030
- 56,838 · -4.2%
- By 2040
- 51,098 · -13.9%
- By 2050
- 45,080 · -24.0%
- By 2075
- 32,648 · -45.0%
- By 2100
- 22,266 · -62.5%
Race, ethnicity, and origin ACS 2023
- Neighborhood character
- Predominantly White (90%)
- Race & ethnicity
- White 90% Two or more races 5% Black 2% Asian 2% Hispanic / Latino 1%
- Common ancestry
- Romanian 9% Lithuanian 4% Italian 3%
- Foreign-born
- 4% · Canada, China
- Languages at home
- 92% English-only · French/Haitian/Cajun 2% Other Asian/Pacific 1% Spanish 1%
Political lean MEDSL · Herkimer
- 2024 margin
- Solid R (+36.4) · D 31.8% · R 68.2%
- 2008→2024 swing
- -27.1pp toward R · 2008: -9.3pp · 2024: -36.4pp
- All cycles
- 2024: R+36.4 2020: R+30.5 2016: R+34.5 2012: R+8.4 2008: R+9.3
Not yet ingested
- Civics
- —
Market trends
- HPI YoY
- ▲ 26.43%
- Current HPI
- 324.4601
- Rent YoY
- —
- Metro
- —
- State GDP YoY
- ▲ 2.60%
- F500 in state
- 92
Industry mix (Fortune 500 HQ in NY)
| Industry | F500 HQs | Revenue |
|---|---|---|
| Financial Services | 10 | $950B |
|
||
| Consumer Goods | 9 | $162B |
|
||
| Insurance | 4 | $225B |
|
||
| Telecommunications | 2 | $144B |
|
||
| Pharmaceuticals | 2 | $112B |
|
||
| Media / Entertainment | 2 | $69B |
|
||
Price history
-79.2% since first listed11 events — show timeline
- 2025-10-28 Price Changed $124,500 Global MLS
- 2025-09-09 Price Changed $167,900 Global MLS
- 2025-07-20 Listed $200,000 Global MLS
- 2025-06-30 Listing Removed — Global MLS
- 2025-01-29 Price Changed $277,777 Global MLS
- 2025-01-28 Listed $325,000 Global MLS
- 2025-01-27 Listing Removed — Global MLS
- 2024-11-25 Price Changed $325,000 Global MLS
- 2024-10-24 Listed $600,000 Global MLS
- 2024-10-18 Listing Removed — Global MLS
- 2024-07-18 Listed $600,000 Global MLS
Cash-flow waterfall
monthlySold comps — $/sqft
last 12 mo · ≤1 miLoading sold comps…