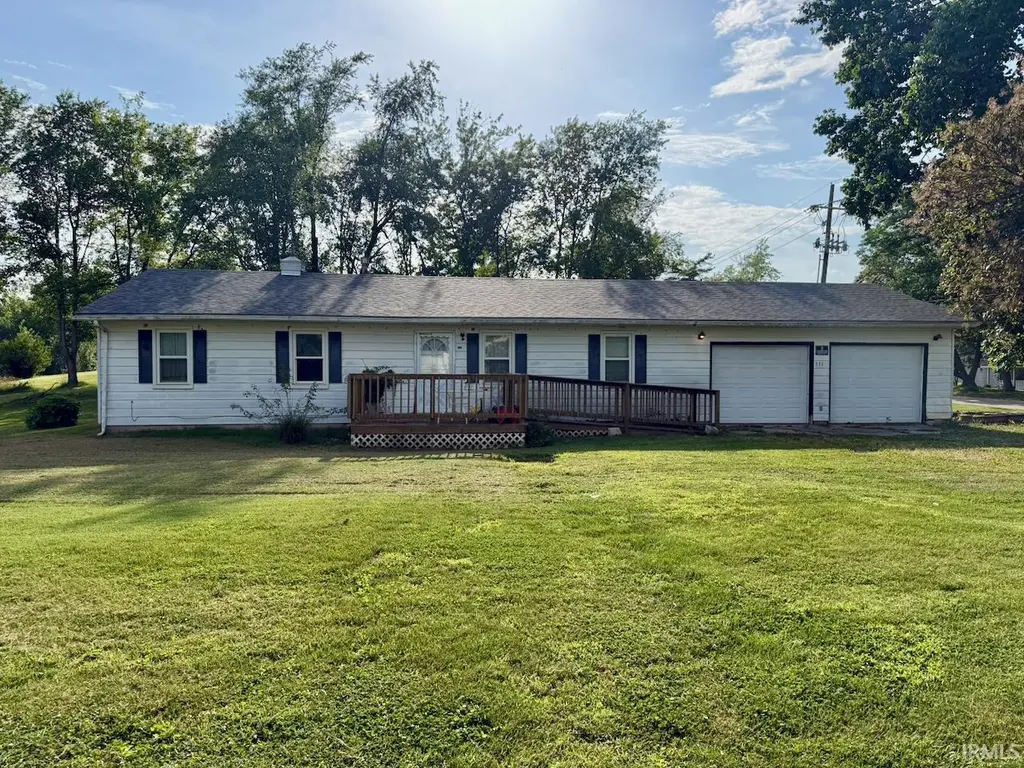
511 Maple Grove Rd · Boonville, IN
Flood risk 1/10 · Minimal
- FEMA flood zone
- X (unshaded)
- Chance of flooding over 30 yrs
- 0.0%
- Est. flood insurance / yr
- $507 – $1,088
Fire risk 1/10 · Minimal
- Est. fire insurance / yr
- $717 – $1,331
Heat risk 5/10 · Moderate
- Hot days now (above 106°F)
- 7 days/yr
- Hot days in 30 yrs
- 19 days/yr
Wind risk 2/10 · Minimal
- Chance of severe wind over 30 yrs
- 3.0%
Air-quality risk 2/10 · Minimal
- Unhealthy air days now
- 2 days/yr
- Unhealthy air days in 30 yrs
- 2 days/yr
Risk factors via First Street. Map © Google.
Why this score? — see what drove the B grade
The composite is a weighted blend of 9 inputs, each scored 0–100. Each bar is that input's sub-score; the figure is the points it added to the 100-point composite (weight × sub-score).
- Cash flow +28.3/30.0
- ARV discount +15.0/15.0
- DSCR +10.0/10.0
- 1% rule +6.6/10.0
- Schools +4.9/10.0
- Livability +3.3/5.0
- Rent growth +2.5/5.0
- Condition / age +2.5/5.0
- Appreciation +0.0/10.0
$119,900
🖨 Deal sheet 📄 Offer letter ✓ Due diligence
Listing remarks
Located on the edge of town, this 3 bedroom/1.5 bathroom ranch style home sits on a . 98 acre corner lot with 2.5 car attached garage. Great opportunity to make it your own. Home is being sold "as-is. " All personal property inside is staying with the home. Home has a lot of potential for the home value to grow.
Key facts
- 0.98 acre lot
- 2 garage spots
- Built 1973
Property features AI
Exterior
- Parking: Attached garage; Approximately 2.5 garage spaces; Off-street parking; Gravel parking surface
- Utilities: Public water; Septic tank sewer
- Home design: Single-family residence; Site-built home; One-story
- Construction: Vinyl siding
- Exterior features: Corner, level lot; Asphalt shingle roof
Interior
- Kitchen: Electric range; Refrigerator
- Bedrooms: 6 total rooms
- Flooring: Carpet; Vinyl
- Bathrooms: 1 full bathroom; 1 half bathroom; 2 bathrooms on main level
- Heating & cooling: Natural gas heating; Forced air heating; Central air conditioning
- Interior features: Refrigerator; Electric range; Gas water heater; Water heater; Crawl space basement
- Laundry & utility: Main-level laundry
Neighborhood map
What this means for you Summary
Snapshot
- This is a 3-bed/1.5-bath single-family listed at $120k.
Deal economics
- At list price, monthly cash flow is $383 ($5k/yr) — positive.
- The deal already cash-flows at list — no discount required.
- Meets the 1% rule at list price ($1k rent vs $120k).
- Cap rate 10.1% vs local median 3.5% in Boonville — top-decile yield for the area; either an underpriced asset or a hidden risk that comps aren't pricing in. Stress-test before assuming the spread holds.
Location & tenants
- Location reads 66/100 on livability (#278 in IN) — a middle-class / working-renter tenant base. Strengths: cost of living A+, housing A+; Watch: crime D+, amenities F, commute F.
- Warrick County School Corporation (suburban): math 54% / reading 59% proficiency, ranked #24 of 301 in IN (top 8%) — acceptable for families but not a draw, mixed tenant base, ~2y average lease.
- Zoned schools: Oakdale Elementary School (math 54% / reading 56%, grade C, #192 of 994 statewide, top 20%, 458 students, 56% FRL); Boonville Middle School (math 37% / reading 47%, grade D-, #102 of 330 statewide, top 32%, 700 students, 51% FRL); Boonville High School (math 32% / reading 60%, grade D-, #163 of 369 statewide, top 44%, 881 students, 44% FRL) — zoned schools average 50% FRL vs 24% district-wide (26 pts higher); higher-poverty schools than district average — tighter screening recommended.
- Market conditions: 158 active listings in the ZIP; 249 units permitted in Warrick County in 2024 (0 in 5+ unit buildings).
Forward outlook
- Local home prices are declining (-3.0%/yr); year-one equity from $829 of loan paydown is wiped out by about $4k of value loss. Plan a longer hold.
- Warrick County population projected at +9% by 2050 — modest demand growth; plan on rents tracking national, not racing it.
- At projected returns (-3.0% appreciation + 3.0% rent growth), your $34k cash investment doubles in ~9 years — after that, you're playing with house money.
Negotiation context
- Only 4 days on market — expect competitive offers; lowballing is unlikely to land.
Risks & watch-outs
- Climate carrying-cost: extreme-heat days projected 7→19/yr by 2055 (HVAC capex compounding) — expect insurance premiums to compound above CPI over the hold.
Questions for the listing agent
- Built in 1973 — when were the roof, HVAC, electrical panel, plumbing, and water heater last replaced?
- Is there a deadline driving the sale (1031 exchange, divorce, estate, relocation)? That informs how much negotiation room exists.
- Crime grade is D in this area — have there been break-ins, vandalism, or insurance claims at this property in the last 3 years? What carrier currently insures it and at what premium?
- What's the average days-on-market for RENTAL listings here right now (not sales)? A rising rental-DOM trend means longer vacancies and softer asking-rent achievability than the comps imply.
- What's the recent tenant-quality profile in this submarket — average credit score on applications, eviction rate, late-payment / NSF rate, and stable-employment percentage? A property-management company in the area should have these aggregated.
- How much new for-sale + rental construction is in the pipeline within 1–3 miles? Heavy new supply typically softens prices + rents 12–24 months out; constrained supply supports both.
Investment metrics
- 1% rule
- 1.16% ✓
- Cap rate
- 10.12%
- Cash-on-cash
- 13.68%
- DSCR
- 1.61
- GRM
- 7.2
CMA / ARV
- ARV (on-the-fly)
- $234,900
- Comps found
- 10
Show comp detail 10 sales within ~0.75 mi
| Address | Dist | Beds/Ba | Sqft | Sold | Price | $/sf | Match |
|---|---|---|---|---|---|---|---|
| 1123 Maxville Dr | 0.61mi | 3/1.5 | 1,400 (+4%) | 11mo | $185,000 | $132 | 56 |
| 716 Kiper Ave | 0.68mi | 3/2.0 | 1,302 (-4%) | 6mo | $174,500 | $134 | 55 |
| 1312 Stratford Dr | 0.44mi | 4/2.0 (+1) | 1,438 (+6%) | 10mo | $240,000 | $167 | 53 |
| 1000 Chariton Dr | 0.56mi | 3/2.0 | 1,366 (+1%) | 22mo | $229,000 | $168 | 51 |
| 1401 Mcelroy St | 0.28mi | 4/1.0 (+1) | 1,176 (-13%) | 9mo | $205,000 | $174 | 50 |
| 588 W State Rd 62 | 0.57mi | 3/2.0 | 1,520 (+13%) | 12mo | $299,900 | $197 | 41 |
| 1111 Chariton Dr | 0.55mi | 3/2.0 | 1,176 (-13%) | 12mo | $222,000 | $189 | 40 |
| 1113 Chariton Dr | 0.54mi | 3/2.0 | 1,176 (-13%) | 13mo | $213,000 | $181 | 40 |
| 1255 Maple Grove Rd | 0.73mi | 3/2.0 | 1,538 (+14%) | 8mo | $333,450 | $217 | 34 |
| 909 E Millis Ave | 0.75mi | 3/2.0 | 1,152 (-15%) | 12mo | $146,000 | $127 | 29 |
Match score weights: distance 35% · size 25% · config 20% · recency 20%. Top-matched comps best support the ARV.
Projected returns pro-forma
-3.0% appreciation · 3.0% rent growth · sell at horizon
- IRR
- 3.8%
- Equity multiple
- 1.15×
- Total profit
- $4,898
- Equity at exit
- $17,877
- IRR
- 13.3%
- Equity multiple
- 2.06×
- Total profit
- $35,458
- Equity at exit
- $10,367
Cash invested: $33,572 (down + closing). Projections, not guarantees.
Landlord ↔ Tenant lean methodology
- Overall (STATE)
- 90 Strongly Landlord-Friendly
- State Indiana
- 90 Strongly Landlord-Friendly · R+11
- County
- — inherits STATE
- City
- — inherits STATE
ZIP-level market 47601
- Active inventory
- 158
- Price-to-rent
- 7.2×
Monthly cashflow live
- Estimated rent
- $1,391 medium interval (Pro) →
- Mortgage (P&I)
- −$629
- Tax from tax record
- −$38 /mo · $453/yr
- Insurance
- −$50
- HOA
- −$0
- Vacancy / Maint / Mgmt
- −$292
- Net cashflow
- $383
Break-even live
UW: 25.0% down · 7.5% · 30yr · 1.5% tax · 5.0% vac · 8.0% maint · 8.0% mgmt
Financing live
Cash to close
- Down payment
- $29,975
- Closing costs
- $3,597
- Reserves months
- —
- Total cash needed
- —
Loan-product check · same deal, 3 products live
Conventional
25% down · 7.5% · 30yr
- Down + closing
- —
- Monthly P&I
- —
- Monthly cashflow
- —
- DSCR
- —
- Eligible?
- —
Personal DTI + credit; lowest rate.
DSCR
20% down · 8.5% · 30yr
- Down + closing
- —
- Monthly P&I
- —
- Monthly cashflow
- —
- DSCR
- —
- Eligible?
- —
No personal income docs; deal must DSCR.
Hard money
10% down · 12.0% · 12mo
- Down + closing
- —
- Monthly P&I
- —
- Monthly cashflow
- —
- DSCR
- —
- Eligible?
- —
Short-term bridge; refi at stabilization.
Listing history 5 events
-
2026-06-17status $119,900 Pending 4 DOM
-
2026-06-16days on market $119,900 Active 4 DOM
-
2026-06-15days on market $119,900 Active 3 DOM
-
2026-06-13remarks 313-char remark
-
2026-06-13$119,900 Active 1 DOM
ⓘ Source: listings_history table (triggers on properties + properties_extension) + one-shot
backfill from property_details.listing_events for pre-trigger history.
Tax reassessment forecast IN · Partial reset (capped growth)
- Current annual tax
- $453 · $38/mo
- Projected year-2 tax
- $736 · $61/mo
- Expected delta
- +$283/yr (+$24/mo · 62.4%)
ⓘ Screening estimate from a state-policy table — verify with the county assessor before closing.
Climate risk First Street
- Flood 1/10 Low FEMA zone X (unshaded) · 0% chance over 30 yrs
- Wildfire 1/10 Low
- Heat 5/10 Major 7 d/yr ≥106°F today · 19 d/yr by 30 yrs out
- Wind 2/10 Low 3% chance of damaging wind over 30 yrs
- Air quality 2/10 Low 2 unhealthy d/yr today · 2 by 30 yrs out
Nearby sold comps map
Loading sold comps map…
Walkable amenities ~0.75 mi
Loading nearby amenities…
Taxation est. · year 1
- Rental income
- $16,697
- − Mortgage interest
- −$6,716
- − Property taxes
- −$453
- − Insurance
- −$600
- − Repairs & maintenance
- −$1,336
- − Management
- −$1,336
- − Depreciation
- −$3,488
- Taxable income
- $2,768
- Est. tax owed @ 24.0%
- −$664
- After-tax cash flow
- $3,928/yr
For passive investors: Depreciation is non-cash, so a rental often shows a tax loss while cash-flowing — sheltering income. Rental losses are passive: they offset passive income freely, and up to $25,000/yr can offset ordinary (W-2) income if you actively participate and your MAGI is under $100k (phasing out to $0 by $150k); unused losses carry forward. On sale, claimed depreciation is recaptured at up to 25%, and gains may owe capital-gains tax (a 1031 exchange can defer both). Figures are a year-1 estimate at your 24.0% rate — not tax advice; consult a CPA.
Schools (NCES district)
- District
- Warrick County School Corporation
- NCES district ID
- 1812390
- Math proficiency
- 54% ▼ -8.00%
- Reading proficiency
- 59% ▼ -6.00%
- Median HH income
- $62,801
- Composite
- 49.38/100
- National rank
- #2014
- State rank
- #24 of 301 in IN
Livability — Boonville
- Score
- 66/100
- State rank
- #278
- US rank
- #11520
Category grades
Schools grade is shown separately in the Schools card above.
Census & demographics
- Population (ZIP)
- 13,119
Population outlook (Warrick County) Hauer SSP2
- Today (2025)
- 66,569 people
- By 2030
- 68,404 · +2.8%
- By 2040
- 71,131 · +6.9%
- By 2050
- 72,743 · +9.3%
- By 2075
- 76,088 · +14.3%
- By 2100
- 72,261 · +8.6%
Race, ethnicity, and origin ACS 2023
- Neighborhood character
- Predominantly White (95%)
- Race & ethnicity
- White 95% Two or more races 3% Hispanic / Latino 2%
- Common ancestry
- Slovak 2% Italian 1% Lithuanian 1%
- Foreign-born
- 0% · Canada
- Languages at home
- 99% English-only · Spanish 1%
Political lean MEDSL · Warrick
- 2024 margin
- Solid R (+30.2) · D 34.1% · R 64.3% · Other 1.5%
- 2008→2024 swing
- -17.4pp toward R · 2008: -12.8pp · 2024: -30.2pp
- All cycles
- 2024: R+30.2 2020: R+27.8 2016: R+33.9 2012: R+26.6 2008: R+12.8
Not yet ingested
- Civics
- —
Market trends
- HPI YoY
- ▼ -119.46%
- Current HPI
- 207.7817
- Rent YoY
- —
- Metro
- —
- State GDP YoY
- ▲ 2.90%
- F500 in state
- 18
Industry mix (Fortune 500 HQ in IN)
| Industry | F500 HQs | Revenue |
|---|---|---|
| Industrial Machinery | 2 | $37B |
|
||
| Healthcare | 1 | $177B |
|
||
| Pharmaceuticals | 1 | $45B |
|
||
| Metals / Steel | 1 | $18B |
|
||
| Agriculture | 1 | $17B |
|
||
| Packaging | 1 | $12B |
|
||
Price history
1 event — show timeline
- 2026-06-11 Listed $119,900 IRMLS
Property tax history
+12.9%/yrLatest (2024): $453 · -15.5% YoY. Source: county tax records.
Cash-flow waterfall
monthlySold comps — $/sqft
last 12 mo · ≤1 miLoading sold comps…