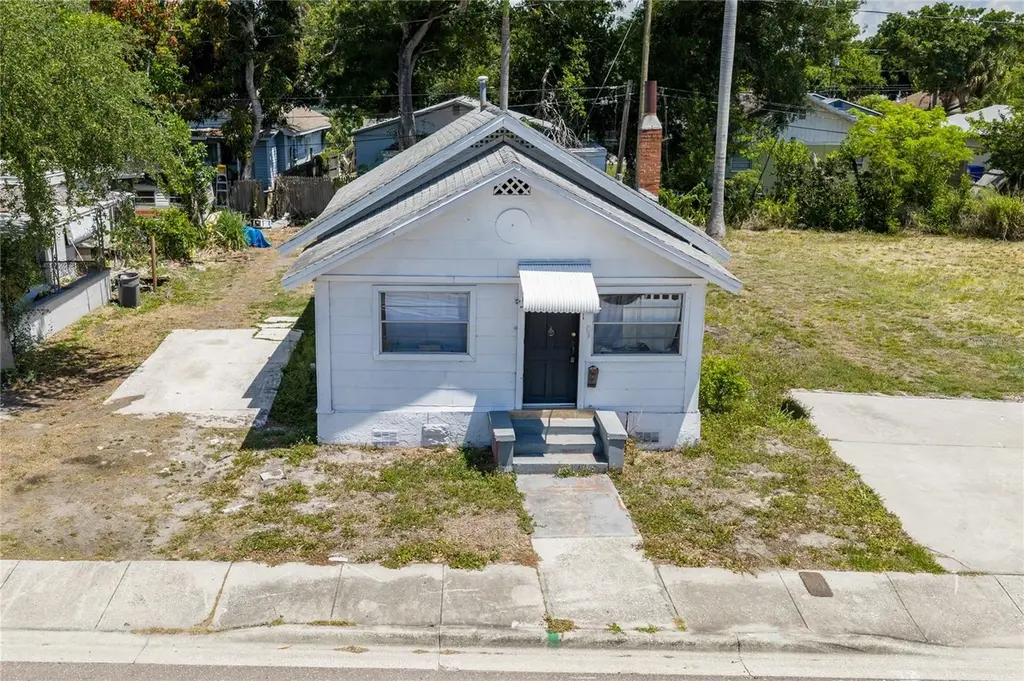
2001 15th Ave S · St. Petersburg, FL
Flood risk 1/10 · Minimal
- FEMA flood zone
- X (unshaded)
- Chance of flooding over 30 yrs
- 0.0%
- Est. flood insurance / yr
- $507 – $1,088
Fire risk 1/10 · Minimal
- Est. fire insurance / yr
- $947 – $1,759
Heat risk 10/10 · Severe
- Hot days now (above 106°F)
- 7 days/yr
- Hot days in 30 yrs
- 27 days/yr
Wind risk 10/10 · Severe
- Chance of severe wind over 30 yrs
- 99.0%
Air-quality risk 4/10 · Minor
- Unhealthy air days now
- 4 days/yr
- Unhealthy air days in 30 yrs
- 4 days/yr
Risk factors via First Street. Map © Google.
Why this score? — see what drove the C- grade
The composite is a weighted blend of 9 inputs, each scored 0–100. Each bar is that input's sub-score; the figure is the points it added to the 100-point composite (weight × sub-score).
- Cash flow +15.9/30.0
- ARV discount +14.3/15.0
- DSCR +4.9/10.0
- Schools +4.3/10.0
- 1% rule +4.0/10.0
- Livability +2.5/5.0
- Condition / age +2.5/5.0
- Rent growth +2.3/5.0
- Appreciation +0.0/10.0
$200,000
🖨 Deal sheet (PDF) 📄 Offer letter ✓ Due diligence
Listing remarks
Located in one of St. Petersburg’s rapidly evolving neighborhoods, this property presents an excellent opportunity for investors, builders, or buyers looking to create something new. Just minutes from Tropicana Field, Central Ave, downtown St. Pete, dining, entertainment, and waterfront attractions, the location offers incredible upside potential. Surrounded by new construction and beautifully renovated homes, this oversized opportunity sits in the path of continued growth and redevelopment. Existing home is being sold as-is.
Key facts
- New construction
- 4,896 sq ft lot
- Built 1926
Tags
Property features AI
Finance
- Other: Lot about 0.11 acres (50 x 98, asphalt road); Unfurnished; No lease restrictions; Living area source: Appraiser
- HOA & community: No HOA/association indicated
Exterior
- Utilities: Public water; Public sewer; Public utilities
- Home design: Single family residence; Residential property; One story; Faces northwest; Entry level: One
- Construction: Frame construction; Shingle roof; Concrete perimeter foundation; Built area approximately 839 square feet
- Exterior features: Sidewalk
Interior
- Bedrooms: 2 bedrooms
- Flooring: Wood flooring
- Bathrooms: 1 full bathroom
- Heating & cooling: Other heating; Other cooling
- Interior features: Other interior features
- Laundry & utility: Laundry: Other
Neighborhood map
What this means for you Summary
Snapshot
- This is a 2-bed/1.0-bath single-family listed at $200k.
Deal economics
- At list price, monthly cash flow is $97 ($1k/yr) — positive.
- The deal already cash-flows at list — no discount required.
- To meet the 1% rule (rent ≥ 1% of price), the offer needs to be $180k (10.1% below list).
- Recommended offer: $180k (10.1% below list) — sets the bar for 1% rule.
- Cap rate 6.9% vs local median 2.6% in St. Petersburg — top-decile yield for the area; either an underpriced asset or a hidden risk that comps aren't pricing in. Stress-test before assuming the spread holds.
Location & tenants
- Location reads: area grade C — affects rentability + tenant quality, not the cash-flow math above.
- Pinellas (suburban): math 51% / reading 51% proficiency, ranked #31 of 73 in FL (top 42%) — acceptable for families but not a draw, mixed tenant base, ~2y average lease.
- Zoned schools: Melrose Elementary School (math 37% / reading 27%, grade F, #1,797 of 2,144 statewide, top 86%, 322 students, 93% FRL); John Hopkins Middle School (math 25% / reading 27%, grade F, #506 of 571 statewide, top 89%, 723 students, 66% FRL); Gibbs High School (math 26% / reading 41%, grade F, #400 of 667 statewide, top 61%, 1,160 students, 64% FRL) — zoned schools average 75% FRL vs 48% district-wide (27 pts higher); higher-poverty schools than district average — tighter screening recommended.
- Zoned-school proficiency averages 30% at this address vs 51% district-wide (-20 pts) — the specific schools serving this property underperform the Pinellas average; the district grade overstates school quality for this exact location.
- Market conditions: Rents soft (-0.8%/yr); 204 active listings in the ZIP; 40 comparable units currently listed for rent nearby; rentals at typical pace (median 17d on market — plan ~3-4 weeks tenant-placement turnaround); 2,676 units permitted in Pinellas County in 2024 (1,422 in 5+ unit buildings).
- This rent runs 36% of the median local income ($60k/yr) — at the standard rent-burdened threshold; future hikes will face affordability resistance.
Forward outlook
- Local home prices are declining (-3.0%/yr); year-one equity from $1k of loan paydown is wiped out by about $6k of value loss. Plan a longer hold.
- Pinellas County population projected at +14% by 2050 — modest demand growth; plan on rents tracking national, not racing it.
Negotiation context
- It's been on market 31 days — a 3% lower offer ($194k) is reasonable based on typical stale-listing flexibility.
- 2 sale attempts since 2y ago with the ask held roughly flat each time — persistent listings suggest the price (not the market) is what's stuck; bring a comps-based counter.
Risks & watch-outs
- Watch-outs: built in 1926 — expect roof / HVAC / electrical / plumbing capex.
- Climate carrying-cost: severe wind risk, 99% chance of damaging wind over 30y; extreme-heat days projected 7→27/yr by 2055 (HVAC capex compounding) — expect insurance premiums to compound above CPI over the hold.
Questions for the listing agent
- It's been on market 31 days. Have you received any prior offers? Is the seller open to a 10% concession, seller financing, or rate buy-down credit?
- Built in 1926 — when were the roof, HVAC, electrical panel, plumbing, and water heater last replaced?
- Is there a deadline driving the sale (1031 exchange, divorce, estate, relocation)? That informs how much negotiation room exists.
- What's the average days-on-market for RENTAL listings here right now (not sales)? A rising rental-DOM trend means longer vacancies and softer asking-rent achievability than the comps imply.
- What's the recent tenant-quality profile in this submarket — average credit score on applications, eviction rate, late-payment / NSF rate, and stable-employment percentage? A property-management company in the area should have these aggregated.
- How much new for-sale + rental construction is in the pipeline within 1–3 miles? Heavy new supply typically softens prices + rents 12–24 months out; constrained supply supports both.
Investment metrics
- 1% rule
- 0.90% ✗
- Cap rate
- 6.87%
- Cash-on-cash
- 2.07%
- DSCR
- 1.09
- GRM
- 9.3
CMA / ARV
- ARV (on-the-fly)
- $235,759
- Comps found
- 12
Show comp detail 12 sales within ~0.75 mi
| Address | Dist | Beds/Ba | Sqft | Sold | Price | $/sf | Match |
|---|---|---|---|---|---|---|---|
| 1608 Preston St S | 0.25mi | 2/1.0 | 833 (-1%) | 3mo | $242,000 | $291 | 85 |
| 1318 Preston St S | 0.26mi | 2/1.0 | 776 (-8%) | 3mo | $175,000 | $226 | 73 |
| 2331 16th Ave S | 0.29mi | 3/1.0 (+1) | 872 (+4%) | 6mo | $245,000 | $281 | 70 |
| 1708 Preston St S | 0.29mi | 3/1.0 (+1) | 795 (-5%) | 9mo | $140,000 | $176 | 65 |
| 2401 17th Ave S | 0.34mi | 3/1.0 (+1) | 912 (+9%) | 1mo | $90,000 | $99 | 64 |
| 2027 13th Ave S | 0.16mi | 3/1.0 (+1) | 958 (+14%) | 6mo | $210,000 | $219 | 59 |
| 2584 14th Ave S | 0.54mi | 2/1.0 | 914 (+9%) | 3mo | $285,000 | $312 | 58 |
| 1231 12th Ave S | 0.56mi | 2/1.0 | 784 (-7%) | 7mo | $279,500 | $357 | 57 |
| 801 18th St S | 0.44mi | 3/1.0 (+1) | 920 (+10%) | 6mo | $195,000 | $212 | 54 |
| 2226 Union St S | 0.56mi | 2/1.0 | 959 (+14%) | 4mo | $98,000 | $102 | 47 |
| 2510 Queen St S | 0.72mi | 3/2.0 (+1) | 775 (-8%) | 10mo | $247,000 | $319 | 36 |
| 2333 22nd St S | 0.66mi | 2/2.5 | 947 (+13%) | 12mo | $320,000 | $338 | 32 |
Match score weights: distance 35% · size 25% · config 20% · recency 20%. Top-matched comps best support the ARV.
Projected returns pro-forma
-3.0% appreciation · 0.0% rent growth · sell at horizon
- IRR
- -16.3%
- Equity multiple
- 0.44×
- Total profit
- $-31,526
- Equity at exit
- $29,821
- IRR
- -14.3%
- Equity multiple
- 0.29×
- Total profit
- $-39,917
- Equity at exit
- $17,292
Cash invested: $56,000 (down + closing). Projections, not guarantees.
Landlord ↔ Tenant lean methodology
- Overall (STATE)
- 87 Strongly Landlord-Friendly
- State Florida
- 87 Strongly Landlord-Friendly · R+3
- County
- — inherits STATE
- City
- — inherits STATE
ZIP-level market 33712
- Rents YoY
- -0.8%
- Active inventory
- 204
- Price-to-rent
- 9.3×
Monthly cashflow live
- Estimated rent
- $1,798 high interval (Pro) →
- Mortgage (P&I)
- −$1,049
- Tax from tax record
- −$191 /mo · $2,296/yr
- Insurance
- −$83
- HOA
- −$0
- Vacancy / Maint / Mgmt
- −$378
- Net cashflow
- $97
Break-even live
Sensitivity live
| Price | -10% $210 | -5% $153 | +0% $97 | +5% $40 | +10% $-16 |
|---|---|---|---|---|---|
| Rent | -10% $-45 | -5% $26 | +0% $97 | +5% $168 | +10% $239 |
| Rate | -1.0pp $197 | -0.5pp $148 | base $97 | +0.5pp $45 | +1.0pp $-8 |
UW: 25.0% down · 7.5% · 30yr · 1.5% tax · 5.0% vac · 8.0% maint · 8.0% mgmt
Financing live
Cash to close
- Down payment
- $50,000
- Closing costs
- $6,000
- Reserves months
- —
- Total cash needed
- —
Loan-product check · same deal, 3 products live
Conventional
25% down · 7.5% · 30yr
- Down + closing
- —
- Monthly P&I
- —
- Monthly cashflow
- —
- DSCR
- —
- Eligible?
- —
Personal DTI + credit; lowest rate.
DSCR
20% down · 8.5% · 30yr
- Down + closing
- —
- Monthly P&I
- —
- Monthly cashflow
- —
- DSCR
- —
- Eligible?
- —
No personal income docs; deal must DSCR.
Hard money
10% down · 12.0% · 12mo
- Down + closing
- —
- Monthly P&I
- —
- Monthly cashflow
- —
- DSCR
- —
- Eligible?
- —
Short-term bridge; refi at stabilization.
Rent comps 40 comps
| Address | Beds | Baths | Sqft | Rent | $/sqft | DOM | Units | Dist |
|---|---|---|---|---|---|---|---|---|
| 2028 14th Ave S Unit A St. Petersburg, FL | 2.0 | 2.0 | 1000 | $1,920 | $1.92 | 26d | 1 | 0.02mi |
| 2020 14th Ave S Unit A St. Petersburg, FL | 2.0 | 2.0 | 1000 | $1,920 | $1.92 | 9d | 1 | 0.02mi |
| 1920 14th Ave S Saint Petersburg, FL | 3.0 | 2.0 | 1073 | $1,865 | $1.74 | 26d | 1 | 0.04mi |
| 1771 15th Ave S Unit 1/2 St. Petersburg, FL | 2.0 | 1.0 | 624 | $1,195 | $1.92 | 9d | 1 | 0.14mi |
| 1771 15th Ave S Saint Petersburg, FL | 2.0 | 1.0 | 800 | $1,195 | $1.49 | 5d | 1 | 0.14mi |
| 1204 21st St S St. Petersburg, FL | 1.0 | 1.0 | 584 | $1,325 | $2.27 | 16d | 1 | 0.19mi |
| 2030 12th Ave S St. Petersburg, FL | 1.0 | 1.0 | 622 | $1,325 | $2.13 | 14d | 1 | 0.19mi |
| 2231 15th Ave S Saint Petersburg, FL | 2.0 | 1.0 | 768 | $1,900 | $2.47 | 6d | 1 | 0.23mi |
| 2000 Queensboro Ave S Unit A St. Petersburg, FL | 2.0 | 1.0 | 616 | $1,450 | $2.35 | 26d | 1 | 0.23mi |
| 1036 19th St S Saint Petersburg, FL | 2.0 | 1.0 | 575 | $1,500 | $2.61 | 26d | 1 | 0.27mi |
| 1760 Queen St S Saint Petersburg, FL | 3.0 | 1.0 | 1004 | $2,000 | $1.99 | 6d | 1 | 0.27mi |
| 1650 Prescott St S Saint Petersburg, FL | 3.0 | 1.0 | 960 | $2,100 | $2.19 | 6d | 1 | 0.31mi |
| 1427 15th St S Saint Petersburg, FL | 3.0 | 1.0 | 1030 | $2,095 | $2.03 | 6d | 1 | 0.35mi |
| 1900 17th St S Saint Petersburg, FL | 2.0 | 2.0 | 1027 | $3,260 | $3.17 | 0d | 1 | 0.40mi |
| 1828 20th Ave S Saint Petersburg, FL | 3.0 | 1.0 | 1015 | $1,650 | $1.63 | 26d | 1 | 0.42mi |
| 2010 22nd St S Saint Petersburg, FL | 3.0 | 1.0 | 1036 | $1,695 | $1.64 | 6d | 1 | 0.43mi |
| 1701 14th St S Unit A St. Petersburg, FL | 2.0 | 1.0 | 1100 | $1,950 | $1.77 | 26d | 1 | 0.47mi |
| 1715 14th St S St. Petersburg, FL | 2.0 | 1.0 | 1000 | $1,850 | $1.85 | 26d | 1 | 0.47mi |
| 2547 14th Ave S Saint Petersburg, FL | 2.0 | 1.0 | 726 | $2,400 | $3.31 | 0d | 1 | 0.49mi |
| 1320 18th Ave S Saint Petersburg, FL | 2.0 | 1.0 | 750 | $1,550 | $2.07 | 19d | 1 | 0.53mi |
| 1529 12th St S Unit A St. Petersburg, FL | 2.0 | 1.5 | 700 | $1,550 | $2.21 | 26d | 1 | 0.53mi |
| 1930 Walton St S Saint Petersburg, FL | 3.0 | 1.0 | 814 | $2,000 | $2.46 | 6d | 1 | 0.54mi |
| 1428 12th St S Saint Petersburg, FL | 2.0 | 1.0 | 575 | $1,400 | $2.43 | 23d | 1 | 0.56mi |
| 2601 18th Ave S Unit B St. Petersburg, FL | 1.0 | 1.0 | 600 | $1,100 | $1.83 | 25d | 1 | 0.62mi |
| 2425 22nd Ave S Saint Petersburg, FL | 1.0 | 1.0 | 698 | $1,525 | $2.18 | 26d | 1 | 0.63mi |
| 1827 Auburn St S Saint Petersburg, FL | 3.0 | 1.0 | 1056 | $1,855 | $1.76 | 6d | 1 | 0.68mi |
| 979 11th Ave S St. Petersburg, FL | 2.0 | 2.0 | 721 | $2,350 | $3.26 | 14d | 1 | 0.74mi |
| 1361 29th St S Saint Petersburg, FL | 3.0 | 1.0 | 819 | $2,400 | $2.93 | 26d | 1 | 0.76mi |
| 560 26th St S Saint Petersburg, FL | 3.0 | 1.0 | 979 | $2,407 | $2.46 | 26d | 1 | 0.81mi |
| 2621 18th St S Saint Petersburg, FL | 3.0 | 1.0 | 1114 | $2,200 | $1.97 | 26d | 1 | 0.81mi |
| 1931 10th St S St. Petersburg, FL | 2.0 | 1.0 | 625 | $1,675 | $2.68 | 16d | 1 | 0.81mi |
| 944 18th Ave S Unit A St. Petersburg, FL | 3.0 | 1.0 | 1013 | $2,100 | $2.07 | 19d | 1 | 0.81mi |
| 985 8th Ave S Unit S St. Petersburg, FL | 3.0 | 1.0 | 1061 | $2,575 | $2.43 | 0d | 1 | 0.84mi |
| 985 8th Ave S Unit N St. Petersburg, FL | 1.0 | 1.0 | 560 | $1,500 | $2.68 | 26d | 1 | 0.84mi |
| 2710 22nd Ave S Saint Petersburg, FL | 3.0 | 1.0 | 1083 | $2,450 | $2.26 | 6d | 1 | 0.85mi |
| 888 14th Ave S St Petersburg, FL | 2.0 | 1.0 | 1084 | $1,825 | $1.68 | 6d | 1 | 0.86mi |
| 1724 3rd Ave S Unit 2 St. Petersburg, FL | 2.0 | 2.0 | 1084 | $3,343 | $3.08 | 26d | 1 | 0.87mi |
| 986 22nd Ave S #3 St. Petersburg, FL | 2.0 | 2.0 | 850 | $1,350 | $1.59 | 15d | 1 | 0.87mi |
| 2222 10th St S Unit B St. Petersburg, FL | 2.0 | 1.0 | 600 | $1,800 | $3.00 | 26d | 1 | 0.88mi |
| 1919 Doctor Martin Luther King Junior St S Unit 1/2 St. Petersburg, FL | 3.0 | 1.0 | 892 | $2,200 | $2.47 | 3d | 1 | 0.89mi |
Listing history 17 events
-
2026-06-22days on market $200,000 Active 31 DOM
-
2026-06-18days on market $200,000 Active 28 DOM
-
2026-06-17days on market $200,000 Active 27 DOM
-
2026-06-16days on market $200,000 Active 26 DOM
-
2026-06-15days on market $200,000 Active 25 DOM
-
2026-06-13days on market $200,000 Active 23 DOM
-
2026-06-09days on market $200,000 Active 19 DOM
-
2026-06-08days on market $200,000 Active 18 DOM
-
2026-06-07days on market $200,000 Active 17 DOM
-
2026-06-04days on market $200,000 Active 14 DOM
-
2026-06-03days on market $200,000 Active 13 DOM
-
2026-06-02days on market $200,000 Active 12 DOM
-
2026-06-01days on market $200,000 Active 11 DOM
-
2026-05-31days on market $200,000 Active 10 DOM
-
2026-05-21$200,000 Active
-
2026-03-30historical
-
2024-09-23$450,000 Active
ⓘ Source: listings_history table (triggers on properties + properties_extension) + one-shot
backfill from property_details.listing_events for pre-trigger history.
Tax reassessment forecast FL · Resets to sale price
- Current annual tax
- $2,296 · $191/mo
- Projected year-2 tax
- $2,296 · $191/mo
- Expected delta
- $0/yr ($0/mo · 0.0%)
ⓘ Screening estimate from a state-policy table — verify with the county assessor before closing.
Climate risk First Street
- Flood 1/10 Low FEMA zone X (unshaded) · 0% chance over 30 yrs
- Wildfire 1/10 Low
- Heat 10/10 Extreme 7 d/yr ≥106°F today · 27 d/yr by 30 yrs out
- Wind 10/10 Extreme 99% chance of damaging wind over 30 yrs
- Air quality 4/10 Moderate 4 unhealthy d/yr today · 4 by 30 yrs out
Nearby sold comps map
Loading sold comps map…
Walkable amenities ~0.75 mi
Loading nearby amenities…
Taxation est. · year 1
- Rental income
- $21,573
- − Mortgage interest
- −$11,203
- − Property taxes
- −$2,296
- − Insurance
- −$1,000
- − Repairs & maintenance
- −$1,726
- − Management
- −$1,726
- − Depreciation
- −$5,818
- Taxable loss
- −$2,196
- Est. tax savings @ 24.0%
- +$527
- After-tax cash flow
- $1,688/yr
For passive investors: Depreciation is non-cash, so a rental often shows a tax loss while cash-flowing — sheltering income. Rental losses are passive: they offset passive income freely, and up to $25,000/yr can offset ordinary (W-2) income if you actively participate and your MAGI is under $100k (phasing out to $0 by $150k); unused losses carry forward. On sale, claimed depreciation is recaptured at up to 25%, and gains may owe capital-gains tax (a 1031 exchange can defer both). Figures are a year-1 estimate at your 24.0% rate — not tax advice; consult a CPA.
Schools (NCES district)
- District
- Pinellas
- NCES district ID
- 1201560
- Math proficiency
- 51% ▼ -5.00%
- Reading proficiency
- 51% ▼ -3.00%
- Median HH income
- $46,270
- Composite
- 43.27/100
- National rank
- #3046
- State rank
- #31 of 73 in FL
Livability — St. Petersburg
No livability data for this city. (Only ~50 U.S. cities are tracked.)
Census & demographics
- Census place
- St. Petersburg, FL
- County
- Pinellas County · 939,478 people
- City population
- 249,151
- Metro
- Tampa-St. Petersburg-Clearwater, FL
- Population (ZIP)
- 27,142
- Household income
- $60,450
- Rent vs Own
- Severe rent burden
- 1928.0
Population outlook (Pinellas County) Hauer SSP2
- Today (2025)
- 1,027,532 people
- By 2030
- 1,063,586 · +3.5%
- By 2040
- 1,125,020 · +9.5%
- By 2050
- 1,168,637 · +13.7%
- By 2075
- 1,265,188 · +23.1%
- By 2100
- 1,260,357 · +22.7%
Race, ethnicity, and origin ACS 2023
- Neighborhood character
- Predominantly Black (68%)
- Race & ethnicity
- Black 68% White 23% Two or more races 6% Hispanic / Latino 4%
- Common ancestry
- Lithuanian 1% Slovak 1% Estonian 1%
- Foreign-born
- 7% · Canada, Jamaica
- Languages at home
- 92% English-only · French/Haitian/Cajun 3% Spanish 3% Other Indo-European 1%
Political lean MEDSL · Pinellas
- 2024 margin
- Lean R (+5.2) · D 46.9% · R 52.1%
- 2008→2024 swing
- -13.5pp toward R · 2008: 8.3pp · 2024: -5.2pp
- All cycles
- 2024: R+5.2 2020: D+0.2 2016: R+1.1 2012: D+5.6 2008: D+8.3
Not yet ingested
- Civics
- —
Market trends
- HPI YoY
- ▼ -275.45%
- Current HPI
- 412.7251
- Rent YoY
- ▼ -0.77%
- Metro
- Tampa-St. Petersburg-Clearwater, FL
- State GDP YoY
- ▲ 3.28%
- F500 in state
- 36
Industry mix (Fortune 500 HQ in FL)
| Industry | F500 HQs | Revenue |
|---|---|---|
| Industrial Technology | 2 | $29B |
|
||
| Insurance | 2 | $17B |
|
||
| Retail | 1 | $60B |
|
||
| Technology Distribution | 1 | $58B |
|
||
| Homebuilding | 1 | $35B |
|
||
| Technology Manufacturing | 1 | $35B |
|
||
Price history
-55.6% since first listed3 events — show timeline
- 2026-05-21 Listed $200,000 Stellar MLS as Distributed by MLS Grid
- 2026-03-30 Listing Removed — Stellar MLS as Distributed by MLS Grid
- 2024-09-23 Listed $450,000 Stellar MLS as Distributed by MLS Grid
Property tax history
+21.8%/yrLatest (2025): $2,296 · +5.9% YoY. Source: county tax records.
Cash-flow waterfall
monthlySold comps — $/sqft
last 12 mo · ≤1 miLoading sold comps…