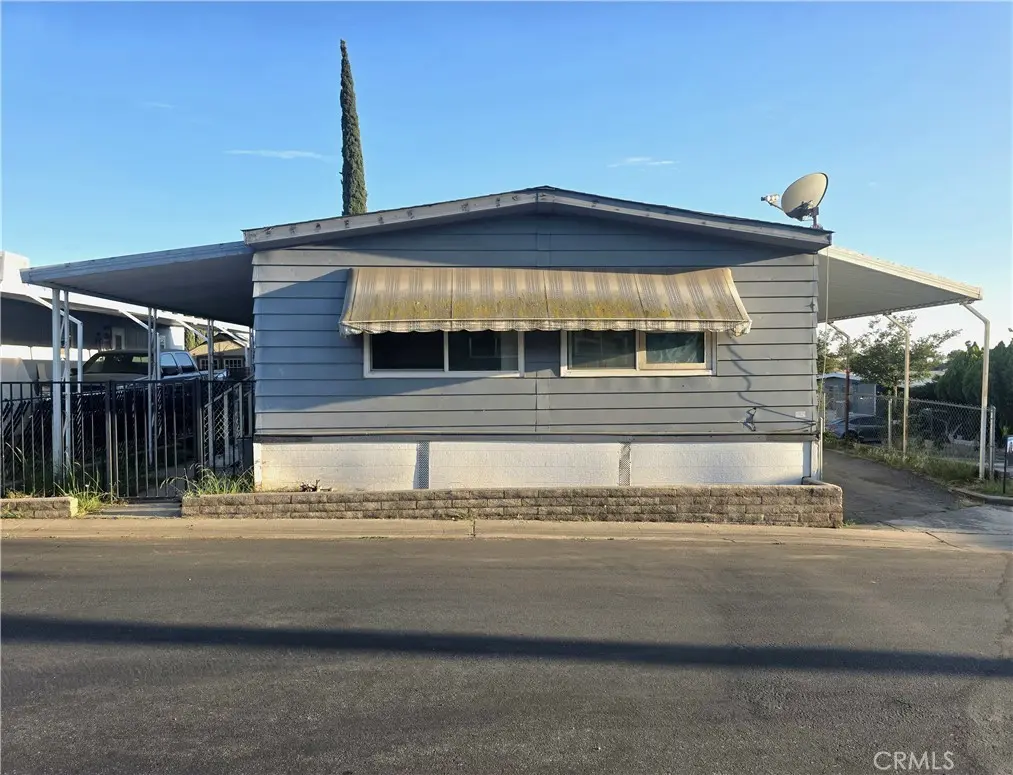
34111 Wildwood Canyon Rd #51 · Yucaipa, CA
Flood risk 1/10 · Minimal
- FEMA flood zone
- X (unshaded)
- Chance of flooding over 30 yrs
- 0.0%
- Est. flood insurance / yr
- $507 – $1,088
Fire risk 9/10 · Severe
- Est. fire insurance / yr
- $659 – $1,223
Heat risk 6/10 · Moderate
- Hot days now (above 100°F)
- 7 days/yr
- Hot days in 30 yrs
- 20 days/yr
Wind risk 1/10 · Minimal
- Chance of severe wind over 30 yrs
- —
Air-quality risk 10/10 · Severe
- Unhealthy air days now
- 30 days/yr
- Unhealthy air days in 30 yrs
- 37 days/yr
Risk factors via First Street. Map © Google.
Why this score? — see what drove the B+ grade
The composite is a weighted blend of 9 inputs, each scored 0–100. Each bar is that input's sub-score; the figure is the points it added to the 100-point composite (weight × sub-score).
- Cash flow +30.0/30.0
- ARV discount +15.0/15.0
- 1% rule +10.0/10.0
- DSCR +10.0/10.0
- Schools +3.8/10.0
- Livability +3.3/5.0
- Condition / age +2.5/5.0
- Rent growth +2.2/5.0
- Appreciation +0.0/10.0
$109,999
🖨 Deal sheet 📄 Offer letter ✓ Due diligence
Listing remarks
Opportunity awaits in Wildwood Canyon Mobile Home Estates! This spacious 4-bedroom, 2-bathroom mobile home offers approximately 1,344 square feet of living space and tons of potential for the right buyer. Featuring a functional floor plan with generous room sizes, this fixer-upper is perfect for investors, flippers, or buyers looking to customize a home to their own style. Located in the desirable Wildwood Canyon Mobile Home Estates community, this property provides a great chance to build equity and create your dream home at an affordable price. With a little vision and TLC, this home can truly shine. located in a quiet all ages community. Don’t miss this value-packed opportunity wit
Key facts
- Generous room sizes
- Garage
- Community pool
Tags
Property features AI
Finance
- Financial info: Land lease covers gas, electric, water and sewer; Land lease amount: $455 monthly (seller provided)
- HOA & community: Land lease in park (monthly); Manager approval required; Pets allowed; Park: Wildwood Canyon Mobile Home Estates; Community features: biking, suburban setting, park
Exterior
- Parking: One covered carport space (attached); One garage space; Two total parking spaces
- Utilities: Public sewer; District/public water; Natural gas available; Electricity available; Water connected
- Home design: Single-story mobile home; Faces north; Entry at front porch and carport
- Construction: Metal roof; Pillar/post/pier foundation; Mobile home (24 by 56); Property listed as fixer condition; Single-story (1 total story)
- Exterior features: Covered porch and patio; Patio; Community pool; One shed; No fencing; Has a view; Lot approx. 0-1 unit per acre
Interior
- Kitchen: Microwave; Gas oven; Water heater unit
- Bedrooms: All bedrooms on ground level
- Flooring: Vinyl flooring; Carpet
- Bathrooms: One full bath; One 3/4 bath with soaking tub and walk-in shower
- Heating & cooling: Central cooling; Central furnace heating
- Interior features: Pantry; Front porch and carport entry
- Laundry & utility: Inside laundry with washer and dryer included
Neighborhood map
What this means for you Summary
Snapshot
- This is a 2-bed/2.0-bath manufactured listed at $110k.
Deal economics
- At list price, monthly cash flow is $1k ($12k/yr) — positive.
- The deal already cash-flows at list — no discount required.
- Meets the 1% rule at list price ($2k rent vs $110k).
- Cap rate 17.6% vs local median 2.7% in Yucaipa — top-decile yield for the area; either an underpriced asset or a hidden risk that comps aren't pricing in. Stress-test before assuming the spread holds.
Location & tenants
- Location reads 66/100 on livability (#334 in CA) — a middle-class / working-renter tenant base. Strengths: housing A+, employment B+; Watch: schools D, health & safety D, amenities F.
- Yucaipa-Calimesa Joint Unified (suburban): math 32% / reading 55% proficiency, ranked #195 of 517 in CA (top 38%) — families likely to look elsewhere, expect single-tenant / working-renter base with shorter leases.
- Market conditions: Rents soft (-1.3%/yr); 205 active listings in the ZIP; 9 comparable units currently listed for rent nearby; rentals at typical pace (median 25d on market — plan ~3-4 weeks tenant-placement turnaround); 44% of comp listings sitting > 30 days — soft ceiling on asking rent; solid renter incomes; 5,458 units permitted in San Bernardino County in 2024 (1,500 in 5+ unit buildings).
Forward outlook
- Local home prices are declining (-3.0%/yr); year-one equity from $760 of loan paydown is wiped out by about $3k of value loss. Plan a longer hold.
- San Bernardino County population projected at +15% by 2050 — modest demand growth; plan on rents tracking national, not racing it.
- At projected returns (-3.0% appreciation + 0.0% rent growth), your $31k cash investment doubles in ~4 years — after that, you're playing with house money.
Negotiation context
- Only 6 days on market — expect competitive offers; lowballing is unlikely to land.
- 5 sale attempts since 20y ago with the ask held roughly flat each time — persistent listings suggest the price (not the market) is what's stuck; bring a comps-based counter.
- Current owner paid $60k; list at $110k implies a 83% gain — meaningful room to come down on a strong offer.
Risks & watch-outs
- Climate carrying-cost: severe wildfire risk; extreme-heat days projected 7→20/yr by 2055 (HVAC capex compounding) — expect insurance premiums to compound above CPI over the hold.
Questions for the listing agent
- Built in 1976 — when were the roof, HVAC, electrical panel, plumbing, and water heater last replaced?
- Is there a deadline driving the sale (1031 exchange, divorce, estate, relocation)? That informs how much negotiation room exists.
- Schools are D-rated, which usually means shorter tenancies and higher turnover. Who's the typical renter profile here, and what's been the actual vacancy rate?
- What's the average days-on-market for RENTAL listings here right now (not sales)? A rising rental-DOM trend means longer vacancies and softer asking-rent achievability than the comps imply.
- What's the recent tenant-quality profile in this submarket — average credit score on applications, eviction rate, late-payment / NSF rate, and stable-employment percentage? A property-management company in the area should have these aggregated.
- How much new for-sale + rental construction is in the pipeline within 1–3 miles? Heavy new supply typically softens prices + rents 12–24 months out; constrained supply supports both.
Investment metrics
- 1% rule
- 2.06% ✓
- Cap rate
- 17.57%
- Cash-on-cash
- 40.29%
- DSCR
- 2.79
- GRM
- 4.0
CMA / ARV
- ARV (on-the-fly)
- $133,056
- Comps found
- 10
Show comp detail 10 sales within ~0.75 mi
| Address | Dist | Beds/Ba | Sqft | Sold | Price | $/sf | Match |
|---|---|---|---|---|---|---|---|
| 12995 6th St #31 | 0.20mi | 2/2.0 | 1,344 (0%) | 4mo | $129,000 | $96 | 87 |
| 34111 Wildwood Cyn Rd #58 | 0.00mi | 2/2.0 | 1,248 (-7%) | 3mo | $135,000 | $108 | 86 |
| 34111 Wildwood Canyon Rd #84 | 0.00mi | 3/2.0 (+1) | 1,440 (+7%) | 4mo | $190,000 | $132 | 80 |
| 34111 Wildwood Canyon Rd | 0.02mi | 2/2.0 | 1,296 (-4%) | 20mo | $157,000 | $121 | 76 |
| 12813 7th St #24 | 0.51mi | 3/2.0 (+1) | 1,350 (+0%) | 15mo | $175,000 | $130 | 58 |
| 33600 Calimesa #55 | 0.66mi | 2/2.0 | 1,248 (-7%) | 2mo | $78,000 | $63 | 56 |
| 33600 Calimesa Blvd #112 | 0.66mi | 2/2.0 | 1,344 (0%) | 19mo | $105,000 | $78 | 53 |
| 34480 County Line Rd #10 | 0.71mi | 2/2.0 | 1,344 (0%) | 22mo | $131,500 | $98 | 49 |
| 33600 Calimesa Blvd #111 | 0.60mi | 2/2.0 | 1,151 (-14%) | 2mo | $75,000 | $65 | 47 |
| 33600 Calimesa Blvd #46 | 0.66mi | 3/2.0 (+1) | 1,440 (+7%) | 14mo | $142,000 | $99 | 41 |
Match score weights: distance 35% · size 25% · config 20% · recency 20%. Top-matched comps best support the ARV.
Projected returns pro-forma
-3.0% appreciation · 0.0% rent growth · sell at horizon
- IRR
- 33.3%
- Equity multiple
- 2.34×
- Total profit
- $41,418
- Equity at exit
- $16,401
- IRR
- 38.6%
- Equity multiple
- 4.09×
- Total profit
- $95,293
- Equity at exit
- $9,511
Cash invested: $30,800 (down + closing). Projections, not guarantees.
Landlord ↔ Tenant lean methodology
- Overall (STATE)
- 18 Strongly Tenant-Friendly
- State California
- 18 Strongly Tenant-Friendly · D+13
- County
- — inherits STATE
- City
- — inherits STATE
ZIP-level market 92399
- Rents YoY
- -1.3%
- Active inventory
- 205
- Price-to-rent
- 4.0×
Monthly cashflow live
- Estimated rent
- $2,271 high interval (Pro) →
- Mortgage (P&I)
- −$577
- Tax est. 1.5%
- −$137 /mo · $1,650/yr
- Insurance
- −$46
- HOA
- −$0
- Vacancy / Maint / Mgmt
- −$477
- Net cashflow
- $1,034
Break-even live
UW: 25.0% down · 7.5% · 30yr · 1.5% tax · 5.0% vac · 8.0% maint · 8.0% mgmt
Financing live
Cash to close
- Down payment
- $27,500
- Closing costs
- $3,300
- Reserves months
- —
- Total cash needed
- —
Loan-product check · same deal, 3 products live
Conventional
25% down · 7.5% · 30yr
- Down + closing
- —
- Monthly P&I
- —
- Monthly cashflow
- —
- DSCR
- —
- Eligible?
- —
Personal DTI + credit; lowest rate.
DSCR
20% down · 8.5% · 30yr
- Down + closing
- —
- Monthly P&I
- —
- Monthly cashflow
- —
- DSCR
- —
- Eligible?
- —
No personal income docs; deal must DSCR.
Hard money
10% down · 12.0% · 12mo
- Down + closing
- —
- Monthly P&I
- —
- Monthly cashflow
- —
- DSCR
- —
- Eligible?
- —
Short-term bridge; refi at stabilization.
Rent comps 9 comps
| Address | Beds | Baths | Sqft | Rent | $/sqft | DOM | Units | Dist |
|---|---|---|---|---|---|---|---|---|
| 13645 5th St #75 Yucaipa, CA | 2.0 | 2.0 | 890 | $1,700 | $1.91 | 43d | 1 | 0.59mi |
| 642 West Avenue L Unit L Calimesa, CA | 3.0 | 1.0 | 1368 | $2,200 | $1.61 | 16d | 1 | 1.01mi |
| 12837 2nd St Yucaipa, CA | 3.0–4.0 | 2.5–3.0 | 1688 | $3,450 | $2.04 | 1d | 31 | 1.13mi |
| 213 W County Line Rd #5 Calimesa, CA | 2.0 | 2.0 | 950 | $1,750 | $1.84 | 11d | 1 | 1.14mi |
| 12646 10th St Yucaipa, CA | 2.0 | 2.0 | 1413 | $3,900 | $2.76 | 24d | 1 | 1.26mi |
| 12301 3rd St Yucaipa, CA | 1.0 | 1.0 | 992 | $2,150 | $2.17 | 1d | 1 | 1.35mi |
| 33685 Washington Dr Yucaipa, CA | 3.0 | 3.0 | 1868 | $3,000 | $1.61 | 43d | 1 | 1.38mi |
| 34384 Yucaipa Blvd Unit 102 Yucaipa, CA | 1.0 | 1.0 | 920 | $1,900 | $2.07 | 43d | 1 | 1.47mi |
| 34384 Yucaipa Blvd Yucaipa, CA | 1.0 | 1.0 | 920 | $2,100 | $2.28 | 43d | 2 | 1.50mi |
Listing history 6 events
-
2026-06-18days on market $109,999 Active 6 DOM
-
2026-06-17days on market $109,999 Active 5 DOM
-
2026-06-16days on market $109,999 Active 4 DOM
-
2026-06-15days on market $109,999 Active 3 DOM
-
2026-06-13remarks 693-char remark
-
2026-06-13$109,999 Active 1 DOM
ⓘ Source: listings_history table (triggers on properties + properties_extension) + one-shot
backfill from property_details.listing_events for pre-trigger history.
Climate risk First Street
- Flood 1/10 Low FEMA zone X (unshaded) · 0% chance over 30 yrs
- Wildfire 9/10 Extreme
- Heat 6/10 Major 7 d/yr ≥100°F today · 20 d/yr by 30 yrs out
- Wind 1/10 Low
- Air quality 10/10 Extreme 30 unhealthy d/yr today · 37 by 30 yrs out
Nearby sold comps map
Loading sold comps map…
Walkable amenities ~0.75 mi
Loading nearby amenities…
Taxation est. · year 1
- Rental income
- $27,255
- − Mortgage interest
- −$6,162
- − Property taxes
- −$1,650
- − Insurance
- −$550
- − Repairs & maintenance
- −$2,180
- − Management
- −$2,180
- − Depreciation
- −$3,200
- Taxable income
- $11,333
- Est. tax owed @ 24.0%
- −$2,720
- After-tax cash flow
- $9,690/yr
For passive investors: Depreciation is non-cash, so a rental often shows a tax loss while cash-flowing — sheltering income. Rental losses are passive: they offset passive income freely, and up to $25,000/yr can offset ordinary (W-2) income if you actively participate and your MAGI is under $100k (phasing out to $0 by $150k); unused losses carry forward. On sale, claimed depreciation is recaptured at up to 25%, and gains may owe capital-gains tax (a 1031 exchange can defer both). Figures are a year-1 estimate at your 24.0% rate — not tax advice; consult a CPA.
Schools (NCES district)
- District
- Yucaipa-Calimesa Joint Unified
- NCES district ID
- 0643560
- Math proficiency
- 32% ▼ -4.00%
- Reading proficiency
- 55% ▲ 6.00%
- Median HH income
- $58,243
- Composite
- 38.09/100
- National rank
- #4277
- State rank
- #195 of 517 in CA
Livability — Yucaipa
- Score
- 66/100
- State rank
- #334
- US rank
- #11542
Category grades
Schools grade is shown separately in the Schools card above.
Census & demographics
- Census place
- Yucaipa, CA
- County
- San Bernardino County · 2,030,291 people
- City population
- 55,366
- Metro
- Riverside-San Bernardino-Ontario, CA
- Population (ZIP)
- 55,366
- Household income
- $92,440
- Rent vs Own
- Severe rent burden
- 1110.0
Population outlook (San Bernardino County) Hauer SSP2
- Today (2025)
- 2,300,329 people
- By 2030
- 2,378,907 · +3.4%
- By 2040
- 2,523,137 · +9.7%
- By 2050
- 2,642,388 · +14.9%
- By 2075
- 2,880,769 · +25.2%
- By 2100
- 2,909,436 · +26.5%
Race, ethnicity, and origin ACS 2023
- Neighborhood character
- Diverse neighborhood (Simpson 0.57)
- Race & ethnicity
- White 55% Hispanic / Latino 36% Two or more races 15% Asian 3% Black 2%
- Hispanic origin (detail)
- Mexican 31%
- Common ancestry
- Italian 4% Iranian 2% Lithuanian 2%
- Foreign-born
- 10% · Canada
- Languages at home
- 77% English-only · Spanish 19% Other Indo-European 1% Other Asian/Pacific 1%
Political lean MEDSL · San Bernardino
- 2024 margin
- Toss-up / Even · D 47.5% · R 49.7% · Other 2.8%
- 2008→2024 swing
- -8.5pp toward R · 2008: 6.3pp · 2024: -2.1pp
- All cycles
- 2024: R+2.1 2020: D+10.7 2016: D+9.8 2012: D+5.4 2008: D+6.3
Not yet ingested
- Civics
- —
Market trends
- HPI YoY
- ▼ -632.71%
- Current HPI
- 353.4762
- Rent YoY
- ▼ -1.27%
- Metro
- Riverside-San Bernardino-Ontario, CA
- State GDP YoY
- ▲ 3.21%
- F500 in state
- 116
Industry mix (Fortune 500 HQ in CA)
| Industry | F500 HQs | Revenue |
|---|---|---|
| Technology | 27 | $1,492B |
|
||
| Financial Services | 3 | $174B |
|
||
| Retail | 3 | $44B |
|
||
| Insurance | 3 | $26B |
|
||
| Media / Entertainment | 2 | $115B |
|
||
| Pharmaceuticals / Biotech | 2 | $62B |
|
||
Price history
+57.4% since first listed11 events — show timeline
- 2026-06-12 Listed $109,999 CRMLS
- 2010-03-16 Delisted — CRMLS
- 2010-01-04 Relisted — CRMLS
- 2009-12-12 Pending — CRMLS
- 2009-09-10 Price Changed $34,999 CRMLS
- 2009-09-10 Listed $349,999 CRMLS
- 2009-08-26 Listing Removed — CRMLS
- 2009-06-27 Price Changed $49,900 CRMLS
- 2009-04-30 Listed $57,900 CRMLS
- 2006-07-13 Sold (MLS) $60,000 CRMLS
- 2006-05-04 Listed $69,900 CRMLS
Property tax history
-2.4%/yrLatest (2025): $94 · +1.2% YoY. Source: county tax records.
Cash-flow waterfall
monthlySold comps — $/sqft
last 12 mo · ≤1 miLoading sold comps…