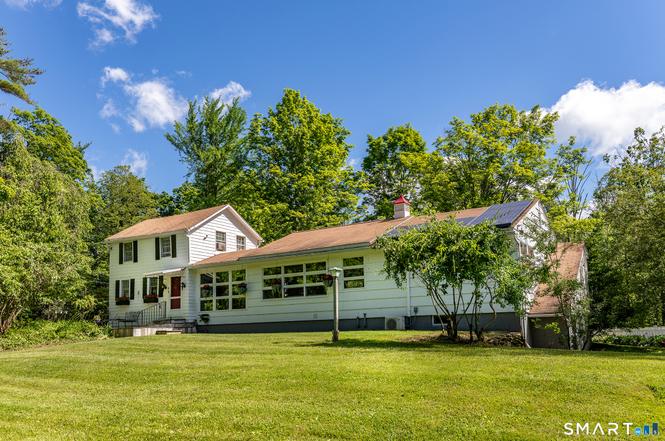
311 Taconic Rd · Canaan, CT
Flood risk No data
- FEMA flood zone
- —
- Chance of flooding over 30 yrs
- %
- Est. flood insurance / yr
- —
Fire risk No data
- Est. fire insurance / yr
- —
Heat risk No data
- Hot days now (above °F)
- days/yr
- Hot days in 30 yrs
- days/yr
Wind risk No data
- Chance of severe wind over 30 yrs
- %
Air-quality risk No data
- Unhealthy air days now
- days/yr
- Unhealthy air days in 30 yrs
- days/yr
Risk factors via First Street. Map © Google.
Why this score? — see what drove the C+ grade
The composite is a weighted blend of 9 inputs, each scored 0–100. Each bar is that input's sub-score; the figure is the points it added to the 100-point composite (weight × sub-score).
- Cash flow +15.0/30.0
- ARV discount +15.0/15.0
- Appreciation +6.3/10.0
- Schools +6.2/10.0
- 1% rule +5.0/10.0
- DSCR +5.0/10.0
- Livability +3.1/5.0
- Rent growth +2.5/5.0
- Condition / age +2.5/5.0
$595,000
🖨 Deal sheet 📄 Offer letter ✓ Due diligence
Listing remarks
This antique home, originally built in the 1700s, has been thoughtfully expanded into a home where antique bones meet mid-century ambition. The original structure anchors the property with a country kitchen open to a casual dining area, with wide board floors, a hand-hewn beam overhead, and blue-and-white tile that gives the space real personality. The kitchen flows into a living room with fireplace; up a level, a bedroom (currently used as a closet) and a full bath. The mid-century addition shifts the mood entirely: a dramatic great room with vaulted ceiling, exposed redwood paneling and beams, stone fireplace, and a sense of scale you don't expect until you're standing in it. A sunroom an
Key facts
- 6.2 acre lot
- 2 garage spots
- Pool
Neighborhood map
What this means for you Summary
Snapshot
- This is a 3-bed/2.5-bath single-family listed at $595k.
Deal economics
- At list price, monthly cash flow is $16k ($188k/yr) — positive.
- The deal already cash-flows at list — no discount required.
- Meets the 1% rule at list price ($25k rent vs $595k).
- Cap rate 37.8% vs local median 1.7% in Canaan — top-decile yield for the area; either an underpriced asset or a hidden risk that comps aren't pricing in. Stress-test before assuming the spread holds.
Location & tenants
- Location reads 62/100 on livability (#133 in CT) — a middle-class / working-renter tenant base. Strengths: crime A+, cost of living A; Watch: schools C-, amenities F, commute F.
- Salisbury School District (rural): math 60% / reading 80% proficiency, ranked #55 of 192 in CT (top 29%) — strong family-tenant draw, lease renewals of 3-5y typical; only 9% free/reduced lunch — higher-income household profile.
- Market conditions: 18 active listings in the ZIP; 1 comparable units currently listed for rent nearby; 154 units permitted in Northwest Hills Planning Region in 2024 (6 in 5+ unit buildings).
Forward outlook
- In year one you build about $19k of equity ($4k loan paydown + $15k appreciation (2.5% local appreciation)).
- At projected returns (2.5% appreciation + 3.0% rent growth), your $167k cash investment doubles in ~1 year — after that, you're playing with house money.
- By year 3, paydown + projected appreciation supports a ~$48k cash-out refi (75% LTV) — recoverable capital for the next deal without selling this one.
Negotiation context
- Only 1 days on market — expect competitive offers; lowballing is unlikely to land.
Risks & watch-outs
- Watch-outs: built in 1735 — expect roof / HVAC / electrical / plumbing capex.
Questions for the listing agent
- Built in 1735 — when were the roof, HVAC, electrical panel, plumbing, and water heater last replaced?
- Is there a deadline driving the sale (1031 exchange, divorce, estate, relocation)? That informs how much negotiation room exists.
- What's the average days-on-market for RENTAL listings here right now (not sales)? A rising rental-DOM trend means longer vacancies and softer asking-rent achievability than the comps imply.
- What's the recent tenant-quality profile in this submarket — average credit score on applications, eviction rate, late-payment / NSF rate, and stable-employment percentage? A property-management company in the area should have these aggregated.
- How much new for-sale + rental construction is in the pipeline within 1–3 miles? Heavy new supply typically softens prices + rents 12–24 months out; constrained supply supports both.
Investment metrics
- 1% rule
- 4.20% ✓
- Cap rate
- 37.83%
- Cash-on-cash
- 112.64%
- DSCR
- 6.01
- GRM
- 2.0
CMA / ARV
- ARV (on-the-fly)
- $911,110
- Comps found
- 2
Show comp detail 2 sales within ~0.75 mi
| Address | Dist | Beds/Ba | Sqft | Sold | Price | $/sf | Match |
|---|---|---|---|---|---|---|---|
| 88 Preston Ln | 0.66mi | 3/2.0 | 1,756 (-2%) | 20mo | $845,000 | $481 | 47 |
| 442 Twin Lakes Rd | 0.65mi | 2/2.5 (-1) | 1,916 (+7%) | 15mo | $975,000 | $509 | 41 |
Match score weights: distance 35% · size 25% · config 20% · recency 20%. Top-matched comps best support the ARV.
Projected returns pro-forma
2.52% appreciation · 3.0% rent growth · sell at horizon
- IRR
- —
- Equity multiple
- 7.32×
- Total profit
- $1,052,930
- Equity at exit
- $251,450
- IRR
- —
- Equity multiple
- 15.24×
- Total profit
- $2,372,267
- Equity at exit
- $375,443
Cash invested: $166,600 (down + closing). Projections, not guarantees.
Landlord ↔ Tenant lean methodology
- Overall (STATE)
- 27 Tenant-Leaning
- State Connecticut
- 27 Tenant-Leaning · D+7
- County
- — inherits STATE
- City
- — inherits STATE
ZIP-level market 06068
- Home prices YoY
- 0.7%
- Active inventory
- 18
- Price-to-rent
- 2.0×
Monthly cashflow live
- Estimated rent
- $25,000 medium interval (Pro) →
- Mortgage (P&I)
- −$3,120
- Tax est. 1.5%
- −$744 /mo · $8,925/yr
- Insurance
- −$248
- HOA
- −$0
- Vacancy / Maint / Mgmt
- −$5,250
- Net cashflow
- $15,638
Break-even live
UW: 25.0% down · 7.5% · 30yr · 1.5% tax · 5.0% vac · 8.0% maint · 8.0% mgmt
Financing live
Cash to close
- Down payment
- $148,750
- Closing costs
- $17,850
- Reserves months
- —
- Total cash needed
- —
Loan-product check · same deal, 3 products live
Conventional
25% down · 7.5% · 30yr
- Down + closing
- —
- Monthly P&I
- —
- Monthly cashflow
- —
- DSCR
- —
- Eligible?
- —
Personal DTI + credit; lowest rate.
DSCR
20% down · 8.5% · 30yr
- Down + closing
- —
- Monthly P&I
- —
- Monthly cashflow
- —
- DSCR
- —
- Eligible?
- —
No personal income docs; deal must DSCR.
Hard money
10% down · 12.0% · 12mo
- Down + closing
- —
- Monthly P&I
- —
- Monthly cashflow
- —
- DSCR
- —
- Eligible?
- —
Short-term bridge; refi at stabilization.
Rent comps 1 comps
| Address | Beds | Baths | Sqft | Rent | $/sqft | DOM | Units | Dist |
|---|---|---|---|---|---|---|---|---|
| 261 Taconic Rd Salisbury, CT | 4.0 | 3.0 | 2499 | $25,000 | $10.00 | 43d | 1 | 0.45mi |
Listing history 2 events
-
2026-06-19remarks 699-char remark
-
2026-06-19$595,000 Active 1 DOM
ⓘ Source: listings_history table (triggers on properties + properties_extension) + one-shot
backfill from property_details.listing_events for pre-trigger history.
Nearby sold comps map
Loading sold comps map…
Walkable amenities ~0.75 mi
Loading nearby amenities…
Taxation est. · year 1
- Rental income
- $300,000
- − Mortgage interest
- −$33,329
- − Property taxes
- −$8,925
- − Insurance
- −$2,975
- − Repairs & maintenance
- −$24,000
- − Management
- −$24,000
- − Depreciation
- −$17,309
- Taxable income
- $189,462
- Est. tax owed @ 24.0%
- −$45,471
- After-tax cash flow
- $142,186/yr
For passive investors: Depreciation is non-cash, so a rental often shows a tax loss while cash-flowing — sheltering income. Rental losses are passive: they offset passive income freely, and up to $25,000/yr can offset ordinary (W-2) income if you actively participate and your MAGI is under $100k (phasing out to $0 by $150k); unused losses carry forward. On sale, claimed depreciation is recaptured at up to 25%, and gains may owe capital-gains tax (a 1031 exchange can defer both). Figures are a year-1 estimate at your 24.0% rate — not tax advice; consult a CPA.
Schools (NCES district)
- District
- Salisbury School District
- NCES district ID
- 0903930
- Math proficiency
- 60% ▼ -5.00%
- Reading proficiency
- 80% ▲ 5.00%
- Median HH income
- $69,634
- Composite
- 62.4/100
- National rank
- #1420
- State rank
- #55 of 192 in CT
Livability — Canaan
- Score
- 62/100
- State rank
- #133
- US rank
- #16567
Category grades
Schools grade is shown separately in the Schools card above.
Census & demographics
- Population (ZIP)
- 2,034
Population outlook (Northwest Hills County) Hauer SSP2
- By 2040
- 118,998
Race, ethnicity, and origin ACS 2023
- Neighborhood character
- Predominantly White (86%)
- Race & ethnicity
- White 86% Two or more races 9% Hispanic / Latino 4%
- Common ancestry
- Slovak 8% Estonian 4% Portuguese 2%
- Foreign-born
- 7% · Canada, China
- Languages at home
- 90% English-only · Other Indo-European 6% Spanish 2% French/Haitian/Cajun 1%
Political lean MEDSL · Northwest Hills
- 2024 margin
- Toss-up / Even · D 48.6% · R 49.9% · Other 1.6%
- All cycles
- 2024: R+1.3
Not yet ingested
- Civics
- —
Market trends
- HPI YoY
- ▲ 2.52%
- Current HPI
- 359.4432
- Rent YoY
- —
- Metro
- —
- State GDP YoY
- ▲ 1.06%
- F500 in state
- 38
Industry mix (Fortune 500 HQ in CT)
| Industry | F500 HQs | Revenue |
|---|---|---|
| Industrial Machinery | 4 | $38B |
|
||
| Insurance | 3 | $71B |
|
||
| Financial Services | 2 | $25B |
|
||
| Transportation / Logistics | 2 | $18B |
|
||
| Healthcare | 1 | $247B |
|
||
| Telecommunications | 1 | $55B |
|
||
Cash-flow waterfall
monthlySold comps — $/sqft
last 12 mo · ≤1 miLoading sold comps…