7904 SW 8th St · North Lauderdale, FL
Flood risk 1/10 · Minimal
- FEMA flood zone
- X (shaded)
- Chance of flooding over 30 yrs
- 0.0%
- Est. flood insurance / yr
- $507 – $1,088
Fire risk 1/10 · Minimal
- Est. fire insurance / yr
- $947 – $1,759
Heat risk 10/10 · Severe
- Hot days now (above 105°F)
- 7 days/yr
- Hot days in 30 yrs
- 28 days/yr
Wind risk 10/10 · Severe
- Chance of severe wind over 30 yrs
- 99.0%
Air-quality risk 3/10 · Minor
- Unhealthy air days now
- 3 days/yr
- Unhealthy air days in 30 yrs
- 3 days/yr
Risk factors via First Street. Map © Google.
Why this score? — see what drove the D- grade
The composite is a weighted blend of 9 inputs, each scored 0–100. Each bar is that input's sub-score; the figure is the points it added to the 100-point composite (weight × sub-score).
- Cash flow +13.2/30.0
- Schools +4.1/10.0
- DSCR +4.0/10.0
- Livability +3.8/5.0
- ARV discount +3.7/15.0
- 1% rule +3.3/10.0
- Condition / age +2.5/5.0
- Rent growth +2.3/5.0
- Appreciation +0.0/10.0
$359,900
🖨 Deal sheet 📄 Offer letter ✓ Due diligence
Listing remarks
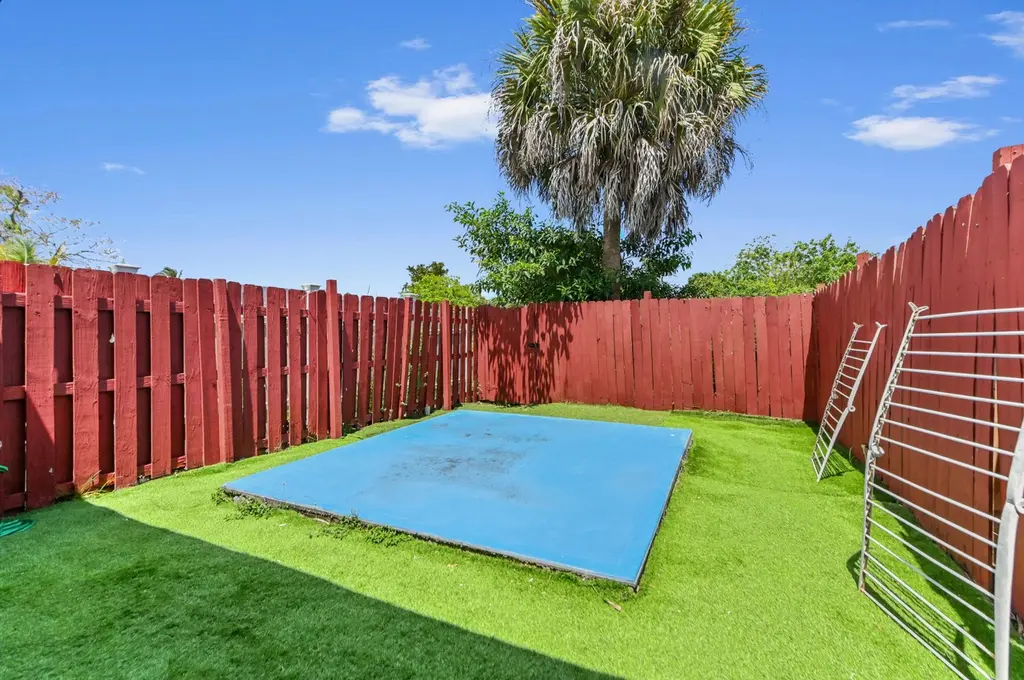
Welcome to The Hamptons! This charming 2-story home offers 3 bedrooms, 2.1 bathrooms, and 1,620 sq ft of comfortable living space with no HOA. The main level features spacious living and dining areas, creating an inviting layout for everyday living and entertaining. The kitchen is equipped with stainless steel appliances and ample cabinetry for storage. Upstairs, two bedrooms share a convenient Jack and Jill bathroom with separate vanities, providing both privacy and functionality. Step outside to a fenced backyard with canal views, a covered patio, paved areas, and a side gate entrance to the yard, perfect for relaxing or entertaining outdoors. Recent upgrades include a 2025 roof, A/C, was
Key facts
- Side gate entrance
- Covered patio
- Canal views
Tags
Property features AI
Finance
- Other: Waterfront: Yes (no waterfront features)
- Financial info: $4,013.80 annual tax (2025)
Exterior
- Parking: Two open parking spaces (strip/slab) for guests
- Security: Fire alarm; Smoke detectors
- Utilities: Public water; Public sewer; Electricity connected (three phase); Sewer available; Water available
- Home design: Townhouse; Two-story; Entry level 1; Faces west; Resale property; Green/energy-efficient appliances, HVAC and lighting
- Construction: Stucco and CBS construction; Composition/shingle roof
- Exterior features: Covered and open patio; Patio; Backyard fencing (fenced)
Interior
- Kitchen: Disposal; Dishwasher; Electric range; Microwave; Refrigerator; Freezer
- Bedrooms: No main-level bedrooms
- Flooring: Laminate; Tile
- Bathrooms: Two full bathrooms and one half bathroom
- Heating & cooling: Central heating (heat pump); Central air; Ductless cooling; Ceiling fans; Heat pump
- Interior features: Entrance foyer; Closet cabinetry; Satellite dish; Unfurnished
- Laundry & utility: Laundry closet inside on the main level
Neighborhood map
What this means for you Summary
Snapshot
- This is a 3-bed/2.0-bath townhouse listed at $360k.
Deal economics
- At list price, monthly cash flow is $-8 ($-94/yr) — negative.
- To cash-flow at today's rent, offer at most $359k (0.4% below list).
- To meet the 1% rule (rent ≥ 1% of price), the offer needs to be $299k (16.9% below list).
- Recommended offer: $299k (16.9% below list) — sets the bar for 1% rule.
- Cap rate 6.3% vs local median 4.3% in North Lauderdale — top-decile yield for the area; either an underpriced asset or a hidden risk that comps aren't pricing in. Stress-test before assuming the spread holds.
Location & tenants
- Location reads 76/100 on livability (#230 in FL, #3,635 nationally) — a middle-class / working-renter tenant base. Strengths: housing A+, health & safety A+, cost of living A; Watch: commute C-, employment D, amenities F.
- Broward (suburban): math 42% / reading 53% proficiency, ranked #46 of 73 in FL (top 63%) — families likely to look elsewhere, expect single-tenant / working-renter base with shorter leases.
- Zoned schools: North Lauderdale Elementary School (math 24% / reading 30%, grade F, #1,969 of 2,144 statewide, top 94%, 646 students, 82% FRL); Silver Lakes Middle School (math 21% / reading 30%, grade F, #512 of 571 statewide, top 90%, 782 students, 77% FRL); Coconut Creek High School (math 13% / reading 26%, grade F, #562 of 667 statewide, top 85%, 1,892 students, 72% FRL) — zoned schools average 77% FRL vs 51% district-wide (26 pts higher); higher-poverty schools than district average — tighter screening recommended.
- Zoned-school proficiency averages 24% at this address vs 48% district-wide (-24 pts) — the specific schools serving this property underperform the Broward average; the district grade overstates school quality for this exact location.
- Market conditions: Rents soft (-0.7%/yr); 298 active listings in the ZIP; 40 comparable units currently listed for rent nearby; rentals at typical pace (median 25d on market — plan ~3-4 weeks tenant-placement turnaround); 2,111 units permitted in Broward County in 2024 (1,265 in 5+ unit buildings).
- At $2,992/mo this rent would consume 56% of the median local household income ($64k/yr) (locally 3073% of renters already pay >50% of income on rent) — very limited rent-growth headroom before tenants either downsize or default.
Forward outlook
- Local home prices are declining (-3.0%/yr); year-one equity from $2k of loan paydown is wiped out by about $11k of value loss. Plan a longer hold.
- Broward County population projected at +34% by 2050 — long-run rental-demand tailwind backs the buy-and-hold thesis.
Negotiation context
- It's been on market 20 days — a 2% lower offer ($355k) is reasonable based on typical stale-listing flexibility.
- 4 sale attempts with the ask held roughly flat each time — persistent listings suggest the price (not the market) is what's stuck; bring a comps-based counter.
- Current owner paid $174k; list at $360k implies a 107% gain — meaningful room to come down on a strong offer.
Risks & watch-outs
- Climate carrying-cost: severe wind risk, 99% chance of damaging wind over 30y; extreme-heat days projected 7→28/yr by 2055 (HVAC capex compounding) — expect insurance premiums to compound above CPI over the hold.
Questions for the listing agent
- What do current leases actually rent for vs. the listed asking? Can we see a recent rent roll and the last 12 months of T-12 income?
- Is there a deadline driving the sale (1031 exchange, divorce, estate, relocation)? That informs how much negotiation room exists.
- The area grade is low — what's the realistic commute time and amenity access for the typical tenant pool here? Any planned neighborhood developments (good or bad) we should know about?
- What's the average days-on-market for RENTAL listings here right now (not sales)? A rising rental-DOM trend means longer vacancies and softer asking-rent achievability than the comps imply.
- What's the recent tenant-quality profile in this submarket — average credit score on applications, eviction rate, late-payment / NSF rate, and stable-employment percentage? A property-management company in the area should have these aggregated.
- How much new for-sale + rental construction is in the pipeline within 1–3 miles? Heavy new supply typically softens prices + rents 12–24 months out; constrained supply supports both.
Investment metrics
- 1% rule
- 0.83% ✗
- Cap rate
- 6.27%
- Cash-on-cash
- -0.09%
- DSCR
- 1.00
- GRM
- 10.0
CMA / ARV
- ARV (on-the-fly)
- $332,100
- Comps found
- 1
Show comp detail 1 sale within ~0.75 mi
| Address | Dist | Beds/Ba | Sqft | Sold | Price | $/sf | Match |
|---|---|---|---|---|---|---|---|
| 1209 Hampton Blvd #1209 | 0.50mi | 3/2.5 | 1,612 (-0%) | 20mo | $330,000 | $205 | 57 |
Match score weights: distance 35% · size 25% · config 20% · recency 20%. Top-matched comps best support the ARV.
Projected returns pro-forma
-3.0% appreciation · 0.0% rent growth · sell at horizon
- IRR
- -19.7%
- Equity multiple
- 0.33×
- Total profit
- $-67,615
- Equity at exit
- $53,662
- IRR
- -20.3%
- Equity multiple
- 0.07×
- Total profit
- $-93,518
- Equity at exit
- $31,118
Cash invested: $100,772 (down + closing). Projections, not guarantees.
Landlord ↔ Tenant lean methodology
- Overall (STATE)
- 87 Strongly Landlord-Friendly
- State Florida
- 87 Strongly Landlord-Friendly · R+3
- County
- — inherits STATE
- City
- — inherits STATE
ZIP-level market 33068
- Rents YoY
- -0.7%
- Active inventory
- 298
- Price-to-rent
- 10.0×
Monthly cashflow live
- Estimated rent
- $2,992 high interval (Pro) →
- Mortgage (P&I)
- −$1,887
- Tax from tax record
- −$334 /mo · $4,014/yr
- Insurance
- −$150
- HOA
- −$0
- Vacancy / Maint / Mgmt
- −$628
- Net cashflow
- $-8
Break-even live
UW: 25.0% down · 7.5% · 30yr · 1.5% tax · 5.0% vac · 8.0% maint · 8.0% mgmt
Financing live
Cash to close
- Down payment
- $89,975
- Closing costs
- $10,797
- Reserves months
- —
- Total cash needed
- —
Loan-product check · same deal, 3 products live
Conventional
25% down · 7.5% · 30yr
- Down + closing
- —
- Monthly P&I
- —
- Monthly cashflow
- —
- DSCR
- —
- Eligible?
- —
Personal DTI + credit; lowest rate.
DSCR
20% down · 8.5% · 30yr
- Down + closing
- —
- Monthly P&I
- —
- Monthly cashflow
- —
- DSCR
- —
- Eligible?
- —
No personal income docs; deal must DSCR.
Hard money
10% down · 12.0% · 12mo
- Down + closing
- —
- Monthly P&I
- —
- Monthly cashflow
- —
- DSCR
- —
- Eligible?
- —
Short-term bridge; refi at stabilization.
Rent comps 40 comps
| Address | Beds | Baths | Sqft | Rent | $/sqft | DOM | Units | Dist |
|---|---|---|---|---|---|---|---|---|
| 7906 SW 8th St North Lauderdale, FL | 3.0 | 2.5 | 1440 | $3,500 | $2.43 | 5d | 1 | 0.03mi |
| 7816 SW 7th Pl North Lauderdale, FL | 3.0 | 2.0 | 1620 | $3,500 | $2.16 | 24d | 1 | 0.12mi |
| 7931 SW 7th Pl #7931 North Lauderdale, FL | 4.0 | 2.5 | 1620 | $3,300 | $2.04 | 14d | 1 | 0.12mi |
| 7931 SW 7th Pl North Lauderdale, FL | 4.0 | 2.5 | 1620 | $3,300 | $2.04 | 15d | 1 | 0.13mi |
| 7931 SW 7th Pl North Lauderdale, FL | 4.0 | 2.5 | 1620 | $3,300 | $2.04 | 17d | 1 | 0.13mi |
| 7966 SW 7th Ct North Lauderdale, FL | 4.0 | 2.5 | 1709 | $3,100 | $1.81 | 5d | 1 | 0.17mi |
| 709 SW 79th Ter North Lauderdale, FL | 2.0 | 2.0 | 1152 | $2,950 | $2.56 | 24d | 1 | 0.19mi |
| 7731 SW 10th Ct Unit 4 North Lauderdale, FL | 3.0 | 1.0 | 1200 | $2,500 | $2.08 | 17d | 1 | 0.29mi |
| 7721 SW 10th Ct Unit B North Lauderdale, FL | 3.0 | 1.0 | 1050 | $1,950 | $1.86 | 24d | 1 | 0.30mi |
| 7701 SW 10th Ct Unit 1A North Lauderdale, FL | 3.0 | 1.0 | 1060 | $2,350 | $2.22 | 14d | 1 | 0.33mi |
| 8040 Hampton Blvd #508 North Lauderdale, FL | 2.0 | 2.0 | 1350 | $2,300 | $1.70 | 24d | 1 | 0.33mi |
| 7710 SW 6th St North Lauderdale, FL | 2.0 | 1.0 | 1056 | $2,525 | $2.39 | 3d | 1 | 0.35mi |
| 8210 SW 7th St North Lauderdale, FL | 3.0 | 2.0 | 1247 | $2,950 | $2.37 | 24d | 1 | 0.35mi |
| 7603 Kimberly Blvd North Lauderdale, FL | 3.0 | 2.0 | 1145 | $2,875 | $2.51 | 24d | 1 | 0.38mi |
| 8030 Hampton Blvd #414 North Lauderdale, FL | 2.0 | 2.0 | 1350 | $1,950 | $1.44 | 24d | 1 | 0.38mi |
| 1177 Sussex Dr North Lauderdale, FL | 2.0 | 1.0 | 1236 | $2,370 | $1.92 | 24d | 1 | 0.48mi |
| 8120 SW 4th Ct North Lauderdale, FL | 4.0 | 3.0 | 1370 | $4,000 | $2.92 | 5d | 1 | 0.48mi |
| 7900 Hampton Blvd North Lauderdale, FL | 1.0–2.0 | 1.0–2.0 | 925 | $2,364 | $2.56 | 2d | 35 | 0.51mi |
| 1233 Hampton Blvd North Lauderdale, FL | 3.0 | 2.5 | 1612 | $2,750 | $1.71 | 24d | 1 | 0.51mi |
| 7613 NW 67th Ave Tamarac, FL | 2.0 | 2.0 | 1581 | $3,000 | $1.90 | 24d | 1 | 0.52mi |
| 7613 NW 67th Ave Tamarac, FL | 2.0 | 2.0 | 1581 | $3,000 | $1.90 | 22d | 1 | 0.52mi |
| 401 SW 76th Ter North Lauderdale, FL | 4.0 | 2.0 | 1370 | $3,500 | $2.55 | 24d | 1 | 0.53mi |
| 7516 NW 67th Ave Tamarac, FL | 3.0 | 2.0 | 1647 | $2,850 | $1.73 | 24d | 1 | 0.54mi |
| 861 SW 74th Ter Unit 102D North Lauderdale, FL | 3.0 | 2.0 | 1150 | $2,100 | $1.83 | 24d | 1 | 0.55mi |
| 881 SW 74th Ter Unit 102C North Lauderdale, FL | 3.0 | 2.0 | 1150 | $2,200 | $1.91 | 24d | 1 | 0.55mi |
| 7336 SW 8th Ct #6 North Lauderdale, FL | 2.0 | 2.0 | 1056 | $2,100 | $1.99 | 24d | 1 | 0.57mi |
| 7613 NW 68th Ter Tamarac, FL | 2.0 | 1.0 | 1224 | $2,500 | $2.04 | 7d | 1 | 0.58mi |
| 6805 NW 75th Dr Fort Lauderdale, FL | 2.0 | 1.0 | 1204 | $2,200 | $1.83 | 24d | 1 | 0.61mi |
| 7907 SW 3rd St North Lauderdale, FL | 4.0 | 2.0 | 1114 | $4,250 | $3.82 | 24d | 1 | 0.61mi |
| 1359 Avon Ln North Lauderdale, FL | 3.0 | 2.5 | 1632 | $3,300 | $2.02 | 24d | 1 | 0.62mi |
| 7480 SW 10th Ct #1 North Lauderdale, FL | 3.0 | 2.0 | 1200 | $3,249 | $2.71 | 24d | 1 | 0.62mi |
| 1317 SW 82nd Ave North Lauderdale, FL | 3.0 | 2.0 | 1566 | $3,500 | $2.23 | 24d | 1 | 0.64mi |
| 7400 Kimberly Blvd Unit 202A North Lauderdale, FL | 3.0 | 2.0 | 1150 | $2,800 | $2.43 | 7d | 1 | 0.64mi |
| 1001 SW 74th Ave Unit 201a North Lauderdale, FL | 3.0 | 2.0 | 1150 | $2,650 | $2.30 | 5d | 1 | 0.68mi |
| 8121 Southgate Blvd North Lauderdale, FL | 3.0 | 2.0 | 1482 | $2,500 | $1.69 | 24d | 1 | 0.73mi |
| 8147 Southgate Blvd Unit N North Lauderdale, FL | 3.0 | 2.5 | 1482 | $2,800 | $1.89 | 24d | 1 | 0.74mi |
| 1400 Avon Ln North Lauderdale, FL | 1.0–3.0 | 1.0–2.0 | 1070 | $2,876 | $2.69 | 2d | 58 | 0.77mi |
| 7200 NW 77th St Tamarac, FL | 4.0 | 2.0 | 1640 | $3,150 | $1.92 | 24d | 1 | 0.78mi |
| 1213 SW 74th Ave North Lauderdale, FL | 4.0 | 2.0 | 1150 | $4,100 | $3.57 | 24d | 1 | 0.79mi |
| 7306 SW 3rd Ct North Lauderdale, FL | 3.0 | 2.0 | 1288 | $2,685 | $2.08 | 20d | 1 | 0.79mi |
Listing history 13 events
-
2026-06-18days on market $359,900 Active 20 DOM
-
2026-06-17days on market $359,900 Active 19 DOM
-
2026-06-16days on market $359,900 Active 18 DOM
-
2026-06-15days on market $359,900 Active 17 DOM
-
2026-06-13days on market $359,900 Active 15 DOM
-
2026-06-09days on market $359,900 Active 11 DOM
-
2026-06-08days on market $359,900 Active 10 DOM
-
2026-06-07days on market $359,900 Active 9 DOM
-
2026-06-04days on market $359,900 Active 6 DOM
-
2026-06-03days on market $359,900 Active 5 DOM
-
2026-06-02days on market $359,900 Active 4 DOM
-
2026-06-01days on market $359,900 Active 3 DOM
-
2026-05-31days on market $359,900 Active 2 DOM
ⓘ Source: listings_history table (triggers on properties + properties_extension) + one-shot
backfill from property_details.listing_events for pre-trigger history.
Tax reassessment forecast FL · Resets to sale price
- Current annual tax
- $4,014 · $334/mo
- Projected year-2 tax
- $4,014 · $334/mo
- Expected delta
- $0/yr ($0/mo · -0.0%)
ⓘ Screening estimate from a state-policy table — verify with the county assessor before closing.
Climate risk First Street
- Flood 1/10 Low FEMA zone X (shaded) · 0% chance over 30 yrs
- Wildfire 1/10 Low
- Heat 10/10 Extreme 7 d/yr ≥105°F today · 28 d/yr by 30 yrs out
- Wind 10/10 Extreme 99% chance of damaging wind over 30 yrs
- Air quality 3/10 Moderate 3 unhealthy d/yr today · 3 by 30 yrs out
Nearby sold comps map
Loading sold comps map…
Walkable amenities ~0.75 mi
Loading nearby amenities…
Taxation est. · year 1
- Rental income
- $35,908
- − Mortgage interest
- −$20,160
- − Property taxes
- −$4,014
- − Insurance
- −$1,800
- − Repairs & maintenance
- −$2,873
- − Management
- −$2,873
- − Depreciation
- −$10,470
- Taxable loss
- −$6,281
- Est. tax savings @ 24.0%
- +$1,507
- After-tax cash flow
- $1,413/yr
For passive investors: Depreciation is non-cash, so a rental often shows a tax loss while cash-flowing — sheltering income. Rental losses are passive: they offset passive income freely, and up to $25,000/yr can offset ordinary (W-2) income if you actively participate and your MAGI is under $100k (phasing out to $0 by $150k); unused losses carry forward. On sale, claimed depreciation is recaptured at up to 25%, and gains may owe capital-gains tax (a 1031 exchange can defer both). Figures are a year-1 estimate at your 24.0% rate — not tax advice; consult a CPA.
Schools (NCES district)
- District
- Broward
- NCES district ID
- 1200180
- Math proficiency
- 42% ▼ -18.00%
- Reading proficiency
- 53% ▼ -5.00%
- Median HH income
- $52,139
- Composite
- 40.88/100
- National rank
- #3621
- State rank
- #46 of 73 in FL
Livability — North Lauderdale
- Score
- 76/100
- State rank
- #230
- US rank
- #3635
Category grades
Schools grade is shown separately in the Schools card above.
Census & demographics
- Census place
- North Lauderdale, FL
- County
- Broward County · 1,963,430 people
- City population
- 54,439
- Metro
- Miami-Fort Lauderdale-Pompano Beach, FL
- Population (ZIP)
- 54,439
- Household income
- $64,051
- Rent vs Own
- Severe rent burden
- 3073.0
Population outlook (Broward County) Hauer SSP2
- Today (2025)
- 2,207,033 people
- By 2030
- 2,360,704 · +7.0%
- By 2040
- 2,661,208 · +20.6%
- By 2050
- 2,946,698 · +33.5%
- By 2075
- 3,602,273 · +63.2%
- By 2100
- 3,970,984 · +79.9%
Race, ethnicity, and origin ACS 2023
- Neighborhood character
- Diverse neighborhood (Simpson 0.61)
- Race & ethnicity
- Black 58% Hispanic / Latino 21% Two or more races 13% White 11% Asian 4%
- Hispanic origin (detail)
- Mexican 3% Puerto Rican 4% Cuban 1% Dominican 3%
- Common ancestry
- Hispanic 17% Estonian 1% Lithuanian 1%
- Foreign-born
- 47% · Canada, Jamaica, Vietnam
- Languages at home
- 59% English-only · Spanish 19% French/Haitian/Cajun 15% Other Indo-European 2%
Political lean MEDSL · Broward
- 2024 margin
- D (+17.0) · D 58.0% · R 41.0%
- 2008→2024 swing
- -17.8pp toward R · 2008: 34.7pp · 2024: 17.0pp
- All cycles
- 2024: D+17.0 2020: D+29.8 2016: D+35.0 2012: D+34.9 2008: D+34.7
Not yet ingested
- Civics
- —
Market trends
- HPI YoY
- ▼ -317.60%
- Current HPI
- 426.2972
- Rent YoY
- ▼ -0.74%
- Metro
- Miami-Fort Lauderdale-Pompano Beach, FL
- State GDP YoY
- ▲ 3.28%
- F500 in state
- 36
Industry mix (Fortune 500 HQ in FL)
| Industry | F500 HQs | Revenue |
|---|---|---|
| Industrial Technology | 2 | $29B |
|
||
| Insurance | 2 | $17B |
|
||
| Retail | 1 | $60B |
|
||
| Technology Distribution | 1 | $58B |
|
||
| Homebuilding | 1 | $35B |
|
||
| Technology Manufacturing | 1 | $35B |
|
||
Price history
+642.1% since first listed11 events — show timeline
- 2026-05-28 Listed $359,900 Beaches MLS
- 2025-11-06 Listing Removed — MARMLS
- 2025-09-05 Relisted — MARMLS
- 2025-08-29 Relisted — MARMLS
- 2025-06-13 Price Changed $330,000 MARMLS
- 2025-05-07 Listed $349,000 MARMLS
- 2019-07-01 Sold (Public Records) $174,000 Public Records
- 2006-08-07 Sold (Public Records) $190,000 Public Records
- 2004-11-16 Sold (Public Records) $137,000 Public Records
- 1993-12-29 Sold (Public Records) $40,000 Public Records
- 1991-04-01 Sold (Public Records) $48,500 Public Records
Property tax history
+10.1%/yrLatest (2025): $4,014 · +2.2% YoY. Source: county tax records.
Cash-flow waterfall
monthlySold comps — $/sqft
last 12 mo · ≤1 miLoading sold comps…