 6-Plex
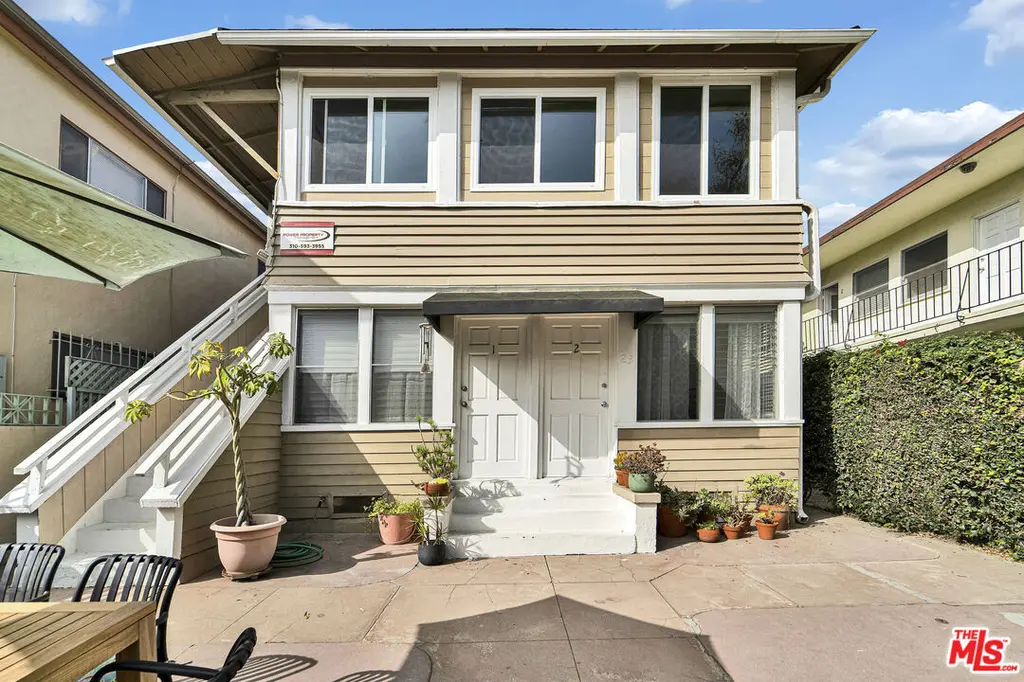
23 19th Ave · Los Angeles, CA
Flood risk 1/10 · Minimal
- FEMA flood zone
- X (unshaded)
- Chance of flooding over 30 yrs
- 0.0%
- Est. flood insurance / yr
- $507 – $1,088
Fire risk 1/10 · Minimal
- Est. fire insurance / yr
- $659 – $1,223
Heat risk 6/10 · Moderate
- Hot days now (above 83°F)
- 7 days/yr
- Hot days in 30 yrs
- 19 days/yr
Wind risk 1/10 · Minimal
- Chance of severe wind over 30 yrs
- —
Air-quality risk 4/10 · Minor
- Unhealthy air days now
- 5 days/yr
- Unhealthy air days in 30 yrs
- 6 days/yr
Risk factors via First Street. Map © Google.
Why this score? — see what drove the C grade
The composite is a weighted blend of 9 inputs, each scored 0–100. Each bar is that input's sub-score; the figure is the points it added to the 100-point composite (weight × sub-score).
- Cash flow +22.2/30.0
- DSCR +7.1/10.0
- 1% rule +5.8/10.0
- Appreciation +4.6/10.0
- ARV discount +4.0/15.0
- Schools +3.6/10.0
- Livability +3.4/5.0
- Rent growth +2.6/5.0
- Condition / age +2.5/5.0
$2,195,000
🖨 Deal sheet 📄 Offer letter ✓ Due diligence
Multi-family units
County records classify this as Multi-Family (2-4 Unit). Listing-text estimate: 6 units. estimate disagrees with records
Listing remarks MLS
Charming 6 - unit investment property in the heart of Venice on a "Walk-Street", just steps to the sand. The property features 4 -Singles, 2 of them have a sunporch, 1 - 1bd+1ba and 1 - 2bd+1ba units. Long term owner (over 40 years) with below market rents. The building has copper plumbing. Two of the units (units 2 & 4) have been completely remodeled. Two other units (units 3 & 5) have been partially remodeled including hardwood floors. Master metered for electricity. Individually metered for gas. However, the seller pays the gas for the tenants. The are 4 parking spots. The owner collects $150/mo. for parking from units 1, 3 and 6. The building was earthquake retrofitted in 1994. You can't beat the location, close to the Venice Boardwalk, Santa Monica Pier and Muscle Beach.
Key facts
- Sunporch
- Copper plumbing
- Completely remodeled
Tags
Neighborhood map
What this means for you Summary
Snapshot
- This is a 6 × 3-bed/6.0-bath units multifamily listed at $2.19M.
Deal economics
- At list price, monthly cash flow is $4k ($43k/yr) — positive. Per door: $596/mo.
- The deal already cash-flows at list — no discount required.
- Meets the 1% rule at list price ($24k rent vs $2.19M).
- Recommended offer: $1.93M (12.0% below list) — sets the bar for market timing.
- Cap rate 8.2% vs local median 2.1% in Los Angeles — top-decile yield for the area; either an underpriced asset or a hidden risk that comps aren't pricing in. Stress-test before assuming the spread holds.
Location & tenants
- Location reads 68/100 on livability (#273 in CA) — a middle-class / working-renter tenant base. Strengths: amenities A+, commute A+, employment B; Watch: health & safety C-, schools D+, crime F.
- Los Angeles Unified (urban): math 29% / reading 54% proficiency, ranked #223 of 517 in CA (top 43%) — families likely to look elsewhere, expect single-tenant / working-renter base with shorter leases; 67% free/reduced lunch — lower-income household profile, screen leases tightly.
- Market conditions: Rents flat; 223 active listings in the ZIP; 40 comparable units currently listed for rent nearby; rentals lingering (median 44d on market — plan ~5-8 weeks vacancy on turnover, expect pricing pressure); 58% of comp listings sitting > 30 days — soft ceiling on asking rent; high-income renter base; 19,697 units permitted in Los Angeles County in 2024 (9,426 in 5+ unit buildings).
- At $23,730/mo this rent would consume 232% of the median local household income ($123k/yr) (locally 2471% of renters already pay >50% of income on rent) — very limited rent-growth headroom before tenants either downsize or default.
Forward outlook
- Local home prices are declining (-0.8%/yr); year-one equity from $15k of loan paydown is wiped out by about $18k of value loss. Plan a longer hold.
- Los Angeles County population projected at +9% by 2050 — modest demand growth; plan on rents tracking national, not racing it.
Negotiation context
- It's been on market 151 days — a 12% lower offer ($1.93M) is reasonable based on typical stale-listing flexibility.
- 5 sale attempts since 26y ago; this cycle's ask has dropped $155k (7%) from the opening price — seller is motivated, your offer sets the floor, not the list.
Risks & watch-outs
- Watch-outs: built in 1904 — expect roof / HVAC / electrical / plumbing capex.
- Climate carrying-cost: extreme-heat days projected 7→19/yr by 2055 (HVAC capex compounding) — expect insurance premiums to compound above CPI over the hold.
Questions for the listing agent
- It's been on market 151 days. Have you received any prior offers? Is the seller open to a 12% concession, seller financing, or rate buy-down credit?
- Can we see the unit-by-unit rent roll, current vacancy, and any below-market leases? What's the average tenancy length?
- What capital expenditures (roof, boiler, parking lot, exteriors) have been made in the last 5 years, and what's planned in the next 2?
- Built in 1904 — when were the roof, HVAC, electrical panel, plumbing, and water heater last replaced?
- Why hasn't it sold? Are there any deal-killer items the seller is aware of (foundation, flood, title, zoning, code violations)?
- Is there a deadline driving the sale (1031 exchange, divorce, estate, relocation)? That informs how much negotiation room exists.
- Schools are D-rated, which usually means shorter tenancies and higher turnover. Who's the typical renter profile here, and what's been the actual vacancy rate?
- Crime grade is F in this area — have there been break-ins, vandalism, or insurance claims at this property in the last 3 years? What carrier currently insures it and at what premium?
- What's the average days-on-market for RENTAL listings here right now (not sales)? A rising rental-DOM trend means longer vacancies and softer asking-rent achievability than the comps imply.
- What's the recent tenant-quality profile in this submarket — average credit score on applications, eviction rate, late-payment / NSF rate, and stable-employment percentage? A property-management company in the area should have these aggregated.
- How much new apartment / multifamily construction is in the pipeline within 1–3 miles? Heavy new supply (>2% of stock underway) typically softens rents 12–24 months out; light construction supports rent growth.
Investment metrics
- 1% rule
- 1.08% ✓
- Cap rate
- 8.25%
- Cash-on-cash
- 6.99%
- DSCR
- 1.31
- GRM
- 7.7
CMA / ARV
- ARV (median comp)
- $2,037,950
- List price
- $2,195,000
- Delta
- 7.71%
- Verdict
- FAIR
- Comps
- 20 within 1.0 mi
Show comp detail 6 sales within ~0.75 mi
| Address | Dist | Beds/Ba | Sqft | Sold | Price | $/sf | Match |
|---|---|---|---|---|---|---|---|
| 11 19th Ave | 0.02mi | 4/5.0 (+1) | 2,724 (-2%) | 10mo | $2,600,000 | $954 | 84 |
| 22 20th Ave | 0.06mi | 4/6.0 (+1) | 2,980 (+8%) | 6mo | $1,150,000 | $386 | 70 |
| 217 Windward Ave | 0.20mi | 4/3.0 (+1) | 2,762 (-0%) | 12mo | $2,708,750 | $981 | 68 |
| 32 Horizon Ave | 0.21mi | 4/4.0 (+1) | 2,454 (-11%) | 5mo | $1,600,000 | $652 | 58 |
| 214 Market St | 0.21mi | 2/4.0 (-1) | 2,564 (-7%) | 22mo | $1,666,500 | $650 | 51 |
| 110 Driftwood St | 0.74mi | 3/4.0 | 2,407 (-13%) | 20mo | $2,350,000 | $976 | 23 |
Match score weights: distance 35% · size 25% · config 20% · recency 20%. Top-matched comps best support the ARV.
Projected returns pro-forma
-0.81% appreciation · 0.53% rent growth · sell at horizon
- IRR
- 0.9%
- Equity multiple
- 1.04×
- Total profit
- $24,366
- Equity at exit
- $550,040
- IRR
- 5.2%
- Equity multiple
- 1.47×
- Total profit
- $289,836
- Equity at exit
- $594,971
Cash invested: $614,600 (down + closing). Projections, not guarantees.
Landlord ↔ Tenant lean methodology
- Overall (CITY)
- 0 Strongly Tenant-Friendly
- State California
- 18 Strongly Tenant-Friendly · D+13
- County
- — inherits STATE
- City Los Angeles
- 0 Strongly Tenant-Friendly · D+22
ZIP-level market 90291
- Home prices YoY
- -0.2%
- Rents YoY
- 0.5%
- Active inventory
- 223
- Price-to-rent
- 46.2×
Monthly cashflow live
- Estimated rent
- $23,730 medium interval (Pro) →
- Mortgage (P&I)
- −$11,511
- Tax est. 1.5%
- −$2,744 /mo · $32,925/yr
- Insurance
- −$915
- HOA
- −$0
- Vacancy / Maint / Mgmt
- −$4,983
- Net cashflow
- $3,578
Break-even live
6-unit breakdown (identical units grouped — click to expand)
| Units | Beds | Baths | Est. rent |
|---|---|---|---|
| 6× units | 3 | 6 | $23,730 |
| #1 | 3 | 6 | $3,955 |
| #2 | 3 | 6 | $3,955 |
| #3 | 3 | 6 | $3,955 |
| #4 | 3 | 6 | $3,955 |
| #5 | 3 | 6 | $3,955 |
| #6 | 3 | 6 | $3,955 |
| Total (6 units) | $23,730 | ||
UW: 25.0% down · 7.5% · 30yr · 1.5% tax · 5.0% vac · 8.0% maint · 8.0% mgmt
Financing live
Cash to close
- Down payment
- $548,750
- Closing costs
- $65,850
- Reserves months
- —
- Total cash needed
- —
Loan-product check · same deal, 3 products live
Conventional
25% down · 7.5% · 30yr
- Down + closing
- —
- Monthly P&I
- —
- Monthly cashflow
- —
- DSCR
- —
- Eligible?
- —
Personal DTI + credit; lowest rate.
DSCR
20% down · 8.5% · 30yr
- Down + closing
- —
- Monthly P&I
- —
- Monthly cashflow
- —
- DSCR
- —
- Eligible?
- —
No personal income docs; deal must DSCR.
Hard money
10% down · 12.0% · 12mo
- Down + closing
- —
- Monthly P&I
- —
- Monthly cashflow
- —
- DSCR
- —
- Eligible?
- —
Short-term bridge; refi at stabilization.
Rent comps 40 comps
| Address | Beds | Baths | Sqft | Rent | $/sqft | DOM | Units | Dist |
|---|---|---|---|---|---|---|---|---|
| 38 19th Ave Venice, CA | 3.0 | 3.0 | 2150 | $8,998 | $4.19 | 43d | 1 | 0.05mi |
| 216 Grand Blvd Venice, CA | 3.0 | 3.0 | 4104 | $12,500 | $3.05 | 14d | 1 | 0.16mi |
| 234 Grand Blvd Venice, CA | 3.0 | 3.5 | 2768 | $11,995 | $4.33 | 15d | 1 | 0.18mi |
| 2217 Grand Canal Venice, CA | 3.0 | 3.5 | 3518 | $16,850 | $4.79 | 43d | 1 | 0.22mi |
| 404 Grand Blvd Venice, CA | 3.0 | 3.5 | 3089 | $16,000 | $5.18 | 17d | 1 | 0.24mi |
| 411 Grand Blvd Venice, CA | 4.0 | 4.0 | 2746 | $19,950 | $7.27 | 43d | 1 | 0.25mi |
| 419 Venice Way Venice, CA | 4.0 | 4.0 | 3173 | $11,500 | $3.62 | 43d | 1 | 0.26mi |
| 411 Linnie Canal Venice, CA | 3.0 | 2.0 | 1945 | $14,000 | $7.20 | 1d | 1 | 0.33mi |
| 522 Grand Blvd Venice, CA | 4.0 | 3.0 | 2220 | $10,250 | $4.62 | 43d | 1 | 0.35mi |
| 2609 Ocean Front Walk Venice, CA | 3.0 | 2.0 | 3290 | $11,000 | $3.34 | 43d | 1 | 0.36mi |
| 2512 Grand Canal Venice, CA | 4.0 | 4.0 | 3309 | $13,995 | $4.23 | 43d | 1 | 0.37mi |
| 524 Rialto Ave Venice, CA | 3.0 | 3.0 | 2990 | $17,000 | $5.69 | 24d | 1 | 0.38mi |
| 1217 Cabrillo Ave Venice, CA | 4.0 | 4.5 | 3110 | $16,500 | $5.31 | 24d | 1 | 0.38mi |
| 225 Sherman Canal Venice, CA | 3.0 | 2.5 | 2893 | $11,000 | $3.80 | 43d | 1 | 0.38mi |
| 405 Sherman Canal Venice, CA | 4.0 | 3.5 | 3936 | $23,000 | $5.84 | 43d | 1 | 0.41mi |
| 115 Park Pl Venice, CA | 3.0 | 3.5 | 3155 | $20,000 | $6.34 | 43d | 1 | 0.48mi |
| 2909 Ocean Front Walk Venice, CA | 3.0 | 2.0 | 3784 | $26,950 | $7.12 | 24d | 1 | 0.49mi |
| 702 Pacific Ave Venice, CA | 4.0 | 6.0 | 3807 | $16,500 | $4.33 | 43d | 1 | 0.53mi |
| 3007 Ocean Front Walk Venice, CA | 3.0 | 4.0 | 2060 | $18,000 | $8.74 | 43d | 1 | 0.53mi |
| 546 Broadway St Venice, CA | 3.0 | 3.0 | 2200 | $14,999 | $6.82 | 43d | 1 | 0.59mi |
| 3111 Via Dolce #301 Marina del Rey, CA | 3.0 | 3.0 | 2230 | $9,750 | $4.37 | 43d | 1 | 0.60mi |
| 2425 Clement Ave Venice, CA | 3.0 | 3.0 | 2966 | $15,555 | $5.24 | 24d | 1 | 0.61mi |
| 656 California Ave Venice, CA | 4.0 | 4.0 | 3170 | $15,975 | $5.04 | 17d | 1 | 0.63mi |
| 3015 Ocean Ave Venice, CA | 2.0 | 2.0 | 3584 | $4,475 | $1.25 | 7d | 1 | 0.65mi |
| 1670 Electric Ave Venice, CA | 3.0 | 3.0 | 1951 | $11,000 | $5.64 | 43d | 1 | 0.70mi |
| 24 Catamaran St #1149 Marina Del Rey, CA | 3.0 | 4.0 | 2100 | $6,010 | $2.86 | 24d | 1 | 0.71mi |
| 661 Broadway St Venice, CA | 3.0 | 3.0 | 2920 | $17,900 | $6.13 | 43d | 1 | 0.74mi |
| 749 Milwood Ave Venice, CA | 4.0 | 3.0 | 2514 | $24,000 | $9.55 | 7d | 1 | 0.76mi |
| 678 Broadway St Venice, CA | 4.0 | 3.0 | 2495 | $14,300 | $5.73 | 24d | 1 | 0.76mi |
| 615 6th Ave Unit 1/2 Venice, CA | 4.0 | 3.0 | 3660 | $11,995 | $3.28 | 43d | 1 | 0.77mi |
| 602 Victoria Ave Venice, CA | 4.0 | 3.0 | 1944 | $7,795 | $4.01 | 43d | 1 | 0.81mi |
| 1008 Oakwood Ave Venice, CA | 4.0 | 3.5 | 3308 | $18,500 | $5.59 | 43d | 1 | 0.84mi |
| 716 Brooks Ave Venice, CA | 4.0 | 4.5 | 4000 | $27,500 | $6.88 | 24d | 1 | 0.84mi |
| 716 Brooks Ave Venice, CA | 4.0 | 4.5 | 4000 | $25,000 | $6.25 | 7d | 1 | 0.84mi |
| 116 Pacific Ave Venice, CA | 3.0 | 4.0 | 2280 | $7,900 | $3.46 | 43d | 1 | 0.85mi |
| 746 Marco Pl Venice, CA | 3.0 | 3.0 | 4000 | $33,000 | $8.25 | 22d | 1 | 0.86mi |
| 115 Galleon St Unit A Marina Del Rey, CA | 3.0 | 3.0 | 2000 | $8,500 | $4.25 | 15d | 1 | 0.86mi |
| 821 Nowita Pl Venice, CA | 3.0 | 2.5 | 2036 | $17,500 | $8.60 | 43d | 1 | 0.88mi |
| 844 California Ave Venice, CA | 3.0 | 2.5 | 2265 | $15,000 | $6.62 | 43d | 1 | 0.88mi |
| 3806 Ocean Front Walk Apt 2 Marina Del Rey, CA | 4.0 | 5.0 | 2521 | $20,000 | $7.93 | 43d | 1 | 0.89mi |
Listing history 19 events
-
2026-06-13days on market $2,195,000 Active 151 DOM
-
2026-06-09days on market $2,195,000 Active 147 DOM
-
2026-06-08days on market $2,195,000 Active 146 DOM
-
2026-06-07days on market $2,195,000 Active 145 DOM
-
2026-06-04days on market $2,195,000 Active 142 DOM
-
2026-06-03days on market $2,195,000 Active 141 DOM
-
2026-06-02days on market $2,195,000 Active 140 DOM
-
2026-06-01days on market $2,195,000 Active 139 DOM
-
2026-05-31days on market $2,195,000 Active 138 DOM
-
2026-02-02price $2,195,000 807-char remark
Show marketing remark (807 chars)
Charming 6 - unit investment property in the heart of Venice on a "Walk-Street", just steps to the sand. The property features 4 -Singles, 2 of them have a sunporch, 1 - 1bd+1ba and 1 - 2bd+1ba units. Long term owner (over 40 years) with below market rents. The building has copper plumbing. Two of the units (units 2 & 4) have been completely remodeled. Two other units (units 3 & 5) have been partially remodeled including hardwood floors. Master metered for electricity. Individually metered for gas. However, the seller pays the gas for the tenants. The are 4 parking spots. The owner collects $150/mo. for parking from units 1, 3 and 6. The building was earthquake retrofitted in 1994. You can't beat the location, close to the Venice Boardwalk, Santa Monica Pier and Muscle Beach.
-
2026-01-13$2,350,000 Active 807-char remark
Show marketing remark (807 chars)
Charming 6 - unit investment property in the heart of Venice on a "Walk-Street", just steps to the sand. The property features 4 -Singles, 2 of them have a sunporch, 1 - 1bd+1ba and 1 - 2bd+1ba units. Long term owner (over 40 years) with below market rents. The building has copper plumbing. Two of the units (units 2 & 4) have been completely remodeled. Two other units (units 3 & 5) have been partially remodeled including hardwood floors. Master metered for electricity. Individually metered for gas. However, the seller pays the gas for the tenants. The are 4 parking spots. The owner collects $150/mo. for parking from units 1, 3 and 6. The building was earthquake retrofitted in 1994. You can't beat the location, close to the Venice Boardwalk, Santa Monica Pier and Muscle Beach.
-
2025-11-10Active
-
2023-11-10historical $2,100
-
2023-10-29price $2,100
-
2023-10-02$2,295
-
2001-04-30historical
-
2000-12-01
-
2000-10-26historical
-
2000-10-25
ⓘ Source: listings_history table (triggers on properties + properties_extension) + one-shot
backfill from property_details.listing_events for pre-trigger history.
Climate risk First Street
- Flood 1/10 Low FEMA zone X (unshaded) · 0% chance over 30 yrs
- Wildfire 1/10 Low
- Heat 6/10 Major 7 d/yr ≥83°F today · 19 d/yr by 30 yrs out
- Wind 1/10 Low
- Air quality 4/10 Moderate 5 unhealthy d/yr today · 6 by 30 yrs out
Nearby sold comps map
Loading sold comps map…
Walkable amenities ~0.75 mi
Loading nearby amenities…
Taxation est. · year 1
- Rental income
- $284,760
- − Mortgage interest
- −$122,954
- − Property taxes
- −$32,925
- − Insurance
- −$10,975
- − Repairs & maintenance
- −$22,781
- − Management
- −$22,781
- − Depreciation
- −$63,855
- Taxable income
- $8,490
- Est. tax owed @ 24.0%
- −$2,038
- After-tax cash flow
- $40,893/yr
For passive investors: Depreciation is non-cash, so a rental often shows a tax loss while cash-flowing — sheltering income. Rental losses are passive: they offset passive income freely, and up to $25,000/yr can offset ordinary (W-2) income if you actively participate and your MAGI is under $100k (phasing out to $0 by $150k); unused losses carry forward. On sale, claimed depreciation is recaptured at up to 25%, and gains may owe capital-gains tax (a 1031 exchange can defer both). Figures are a year-1 estimate at your 24.0% rate — not tax advice; consult a CPA.
Schools (NCES district)
- District
- Los Angeles Unified
- NCES district ID
- 0622710
- Math proficiency
- 29% ▼ -4.00%
- Reading proficiency
- 54% ▲ 10.00%
- Median HH income
- $50,403
- Composite
- 35.67/100
- National rank
- #4875
- State rank
- #223 of 517 in CA
Livability — Los Angeles
- Score
- 68/100
- State rank
- #273
- US rank
- #9237
Category grades
Schools grade is shown separately in the Schools card above.
Census & demographics
- Census place
- Los Angeles, CA
- County
- Los Angeles County · 9,444,647 people
- City population
- 3,838,149
- Metro
- Los Angeles-Long Beach-Anaheim, CA
- Population (ZIP)
- 26,324
- Household income
- $122,738
- Rent vs Own
- Severe rent burden
- 2471.0
Population outlook (Los Angeles County) Hauer SSP2
- Today (2025)
- 10,940,515 people
- By 2030
- 11,256,481 · +2.9%
- By 2040
- 11,729,929 · +7.2%
- By 2050
- 11,948,407 · +9.2%
- By 2075
- 11,818,114 · +8.0%
- By 2100
- 10,842,928 · -0.9%
Race, ethnicity, and origin ACS 2023
- Neighborhood character
- Predominantly White (68%)
- Race & ethnicity
- White 68% Hispanic / Latino 14% Two or more races 11% Asian 6% Black 6%
- Hispanic origin (detail)
- Mexican 8%
- Common ancestry
- Italian 5% Lithuanian 4% Romanian 3%
- Foreign-born
- 21% · Canada, China, Dominican Republic
- Languages at home
- 72% English-only · Spanish 13% French/Haitian/Cajun 4% Other Indo-European 4%
Political lean MEDSL · Los Angeles
- 2024 margin
- Solid D (+32.9) · D 64.8% · R 31.9% · Other 3.3%
- 2008→2024 swing
- -7.4pp toward R · 2008: 40.4pp · 2024: 32.9pp
- All cycles
- 2024: D+32.9 2020: D+44.2 2016: D+48.0 2012: D+40.0 2008: D+40.4
Not yet ingested
- Civics
- —
Market trends
- HPI YoY
- ▼ -0.81%
- Current HPI
- 377.6708
- Rent YoY
- ▲ 0.53%
- Metro
- Los Angeles-Long Beach-Anaheim, CA
- State GDP YoY
- ▲ 3.21%
- F500 in state
- 116
Industry mix (Fortune 500 HQ in CA)
| Industry | F500 HQs | Revenue |
|---|---|---|
| Technology | 27 | $1,492B |
|
||
| Financial Services | 3 | $174B |
|
||
| Retail | 3 | $44B |
|
||
| Insurance | 3 | $26B |
|
||
| Media / Entertainment | 2 | $115B |
|
||
| Pharmaceuticals / Biotech | 2 | $62B |
|
||
Price history
+95542.7% since first listed10 events — show timeline
- 2026-02-02 Price Changed $2,195,000 TheMLS
- 2026-01-13 Listed $2,350,000 TheMLS
- 2025-11-10 Listed — TheMLS
- 2023-11-10 Rental Removed $2,100 APPFOLIO
- 2023-10-29 Price Changed $2,100 APPFOLIO
- 2023-10-02 Listed for Rent $2,295 APPFOLIO
- 2001-04-30 Delisted — TheMLS
- 2000-12-01 Listed — TheMLS
- 2000-10-26 Delisted — TheMLS
- 2000-10-25 Listed — TheMLS
Property tax history
+1.6%/yrLatest (2025): $3,630 · +2.2% YoY. Source: county tax records.
Cash-flow waterfall
monthlySold comps — $/sqft
last 12 mo · ≤1 miLoading sold comps…