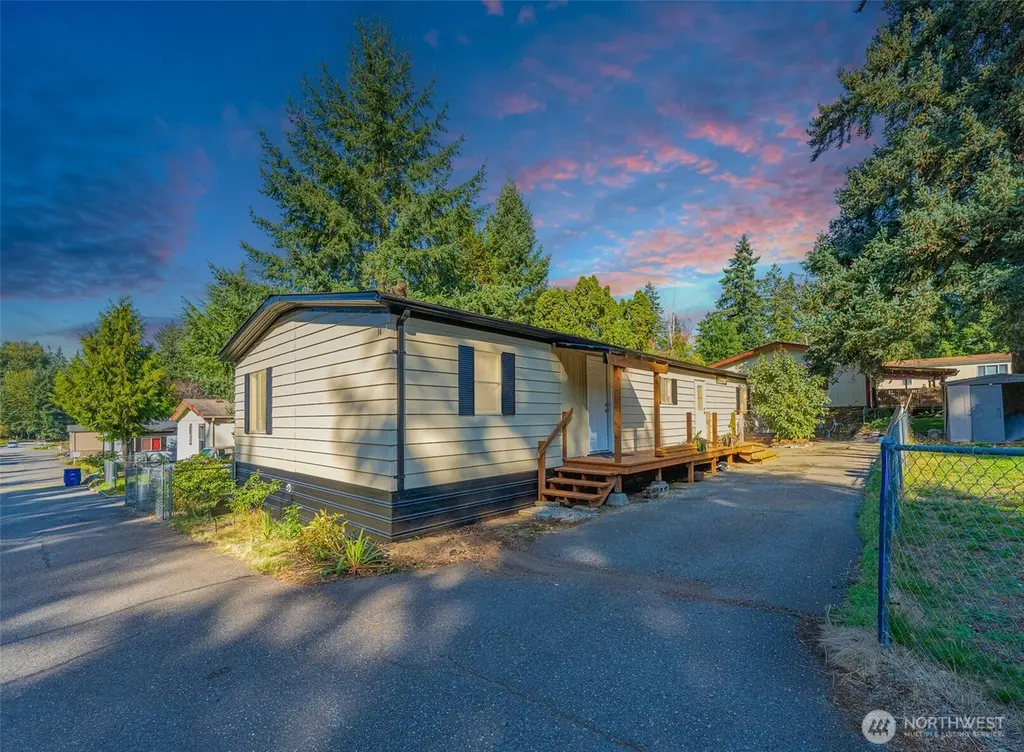
7427 154th St E #14 · South Hill, WA
Flood risk 1/10 · Minimal
- FEMA flood zone
- X (unshaded)
- Chance of flooding over 30 yrs
- 0.0%
- Est. flood insurance / yr
- $507 – $1,088
Fire risk 1/10 · Minimal
- Est. fire insurance / yr
- $604 – $1,122
Heat risk 3/10 · Minor
- Hot days now (above 87°F)
- 7 days/yr
- Hot days in 30 yrs
- 14 days/yr
Wind risk 1/10 · Minimal
- Chance of severe wind over 30 yrs
- —
Air-quality risk 7/10 · Major
- Unhealthy air days now
- 10 days/yr
- Unhealthy air days in 30 yrs
- 10 days/yr
Risk factors via First Street. Map © Google.
Why this score? — see what drove the B grade
The composite is a weighted blend of 9 inputs, each scored 0–100. Each bar is that input's sub-score; the figure is the points it added to the 100-point composite (weight × sub-score).
- Cash flow +30.0/30.0
- 1% rule +10.0/10.0
- DSCR +10.0/10.0
- ARV discount +9.0/15.0
- Schools +5.4/10.0
- Livability +4.0/5.0
- Rent growth +3.2/5.0
- Condition / age +2.5/5.0
- Appreciation +0.0/10.0
$145,000
🖨 Deal sheet 📄 Offer letter ✓ Due diligence
Listing remarks
Enjoy easy living in this beautifully maintained, pre-inspected single-level home nestled in a desirable all-ages park, offering the perfect blend of comfort, flexibility, and convenience. Inside, you’ll find a bright and spacious open floor plan featuring 3 bedrooms, 2 baths, updated flooring throughout, and a good-sized kitchen with updated finishes. A new deck and oversized front door make the home especially welcoming with ramp-friendly access for added ease. This home also has 3 separate entrances. Outside, enjoy a large landscaped and fully fenced yard — perfect for outdoor living, entertaining, and pets, with both cats and dogs welcome. Spacious parking accommodates up to
Key facts
- Good-sized kitchen
- Pre-inspected home
- Single-level home
Tags
Property features AI
Finance
- Other: Located on a cul-de-sac with paved access
- Financial info: Accepts cash and conventional financing
- HOA & community: Located in a manufactured home park (Firlane Valley MHP) with 28 homes; Park approved for sale; Park amenities include a recreational area; Pets allowed — see remarks; Land lease: $900
Exterior
- Parking: Uncovered parking; 3 open parking spaces
- Utilities: Electric energy source; Shared well (community water); Community septic; Puget Sound Energy power; Internet: Comcast
- Home design: Manufactured double-wide home (Modul Gibraltar); Single-story; Faces south; Vaulted ceilings; Bath off primary; Walk-in closet; Entry and dining room
- Construction: Metal skirt; Construction materials: metal/vinyl and wood; Composition roof; Pillar/post/pier foundation with tie-downs; Manufactured after 6/15/1976
- Exterior features: Awnings; Patio/porch/deck; Landscaped; Metal/vinyl and wood exterior
Interior
- Kitchen: Refrigerator; Stove/Range
- Bedrooms: 3 bedrooms
- Flooring: Vinyl plank; Carpet
- Bathrooms: 2 full bathrooms (2 tubs, 2 showers)
- Heating & cooling: Forced air heating; No cooling
- Interior features: Wood-burning fireplace; Water heater
- Laundry & utility: Washer; Dryer; Water heater located in utility room
Neighborhood map
What this means for you Summary
Snapshot
- This is a 3-bed/2.0-bath manufactured listed at $145k.
Deal economics
- At list price, monthly cash flow is $1k ($15k/yr) — positive.
- The deal already cash-flows at list — no discount required.
- Meets the 1% rule at list price ($3k rent vs $145k).
- Recommended offer: $141k (3.0% below list) — sets the bar for market timing.
- Cap rate 16.9% vs local median 3.0% in South Hill — top-decile yield for the area; either an underpriced asset or a hidden risk that comps aren't pricing in. Stress-test before assuming the spread holds.
Location & tenants
- Location reads 80/100 on livability (#84 in WA, #1,620 nationally) — a professional / high-income tenant draw. Strengths: employment A+, housing A+, health & safety A+; Watch: crime C-, cost of living F.
- Puyallup School District (suburban): math 53% / reading 66% proficiency, ranked #52 of 291 in WA (top 18%) — acceptable for families but not a draw, mixed tenant base, ~2y average lease.
- Zoned schools: Dessie F Evans Elementary (988 students, 42% FRL); Gov John Rogers High School (1,730 students, 42% FRL).
- Market conditions: Rents rising (+2.8%/yr); 283 active listings in the ZIP; 15 comparable units currently listed for rent nearby; rentals leasing fast (median 13d on market — plan ~1-2 weeks tenant-placement turnaround); high-income renter base; 3,209 units permitted in Pierce County in 2024 (1,269 in 5+ unit buildings).
Forward outlook
- Local home prices are declining (-3.0%/yr); year-one equity from $1k of loan paydown is wiped out by about $4k of value loss. Plan a longer hold.
- Pierce County population projected at +26% by 2050 — long-run rental-demand tailwind backs the buy-and-hold thesis.
- At projected returns (-3.0% appreciation + 2.8% rent growth), your $41k cash investment doubles in ~4 years — after that, you're playing with house money.
Negotiation context
- It's been on market 35 days — a 3% lower offer ($141k) is reasonable based on typical stale-listing flexibility.
- 5 sale attempts since 4y ago with the ask held roughly flat each time — persistent listings suggest the price (not the market) is what's stuck; bring a comps-based counter.
- Current owner paid $54k; list at $145k implies a 171% gain — meaningful room to come down on a strong offer.
Questions for the listing agent
- It's been on market 35 days. Have you received any prior offers? Is the seller open to a 3% concession, seller financing, or rate buy-down credit?
- Is there a deadline driving the sale (1031 exchange, divorce, estate, relocation)? That informs how much negotiation room exists.
- Schools are D-rated, which usually means shorter tenancies and higher turnover. Who's the typical renter profile here, and what's been the actual vacancy rate?
- What's the average days-on-market for RENTAL listings here right now (not sales)? A rising rental-DOM trend means longer vacancies and softer asking-rent achievability than the comps imply.
- What's the recent tenant-quality profile in this submarket — average credit score on applications, eviction rate, late-payment / NSF rate, and stable-employment percentage? A property-management company in the area should have these aggregated.
- How much new for-sale + rental construction is in the pipeline within 1–3 miles? Heavy new supply typically softens prices + rents 12–24 months out; constrained supply supports both.
Investment metrics
- 1% rule
- 1.90% ✓
- Cap rate
- 16.86%
- Cash-on-cash
- 37.75%
- DSCR
- 2.68
- GRM
- 4.4
CMA / ARV
- ARV (median comp)
- $150,167
- List price
- $145,000
- Delta
- -3.44%
- Verdict
- FAIR
- Comps
- 9 within 1.0 mi
Show comp detail 11 sales within ~0.75 mi
| Address | Dist | Beds/Ba | Sqft | Sold | Price | $/sf | Match |
|---|---|---|---|---|---|---|---|
| 7309 155th St E #2 | 0.15mi | 3/2.0 | 1,456 (+8%) | 2mo | $75,000 | $52 | 77 |
| 15807 78th Avenue Ct E | 0.36mi | 3/2.0 | 1,296 (-4%) | 11mo | $425,000 | $328 | 68 |
| 7620 157th Street Ct E #94 | 0.27mi | 3/2.0 | 1,506 (+12%) | 1mo | $124,000 | $82 | 67 |
| 7706 158th Ct Ct E #132 | 0.32mi | 3/2.0 | 1,294 (-4%) | 16mo | $136,000 | $105 | 66 |
| 15605 79th Ave E | 0.29mi | 3/2.0 | 1,200 (-11%) | 7mo | $350,000 | $292 | 63 |
| 7715 156th Street Ct E | 0.20mi | 3/2.0 | 1,512 (+12%) | 11mo | $50,000 | $33 | 61 |
| 15801 85th Ave E | 0.67mi | 3/2.0 | 1,280 (-5%) | 0mo | $449,500 | $351 | 60 |
| 7409 156th Street Ct E Unit E-2 | 0.17mi | 3/1.0 | 1,224 (-9%) | 24mo | $75,000 | $61 | 53 |
| 15801 81st Ave Ct E #71 | 0.48mi | 2/2.0 (-1) | 1,432 (+6%) | 16mo | $305,000 | $213 | 48 |
| 15807 85th Ave E | 0.68mi | 3/2.0 | 1,512 (+12%) | 15mo | $455,500 | $301 | 35 |
| 15919 84th Ave E | 0.68mi | 3/2.0 | 1,508 (+12%) | 16mo | $460,000 | $305 | 34 |
Match score weights: distance 35% · size 25% · config 20% · recency 20%. Top-matched comps best support the ARV.
Projected returns pro-forma
-3.0% appreciation · 2.79% rent growth · sell at horizon
- IRR
- 33.5%
- Equity multiple
- 2.41×
- Total profit
- $57,255
- Equity at exit
- $21,620
- IRR
- 40.3%
- Equity multiple
- 4.75×
- Total profit
- $152,146
- Equity at exit
- $12,537
Cash invested: $40,600 (down + closing). Projections, not guarantees.
Landlord ↔ Tenant lean methodology
- Overall (STATE)
- 28 Tenant-Leaning
- State Washington
- 28 Tenant-Leaning · D+8
- County
- — inherits STATE
- City
- — inherits STATE
ZIP-level market 98375
- Rents YoY
- 2.8%
- Active inventory
- 283
- Price-to-rent
- 4.4×
Monthly cashflow live
- Estimated rent
- $2,749 high interval (Pro) →
- Mortgage (P&I)
- −$760
- Tax from tax record
- −$73 /mo · $878/yr
- Insurance
- −$60
- HOA
- −$0
- Vacancy / Maint / Mgmt
- −$577
- Net cashflow
- $1,277
Break-even live
UW: 25.0% down · 7.5% · 30yr · 1.5% tax · 5.0% vac · 8.0% maint · 8.0% mgmt
Financing live
Cash to close
- Down payment
- $36,250
- Closing costs
- $4,350
- Reserves months
- —
- Total cash needed
- —
Loan-product check · same deal, 3 products live
Conventional
25% down · 7.5% · 30yr
- Down + closing
- —
- Monthly P&I
- —
- Monthly cashflow
- —
- DSCR
- —
- Eligible?
- —
Personal DTI + credit; lowest rate.
DSCR
20% down · 8.5% · 30yr
- Down + closing
- —
- Monthly P&I
- —
- Monthly cashflow
- —
- DSCR
- —
- Eligible?
- —
No personal income docs; deal must DSCR.
Hard money
10% down · 12.0% · 12mo
- Down + closing
- —
- Monthly P&I
- —
- Monthly cashflow
- —
- DSCR
- —
- Eligible?
- —
Short-term bridge; refi at stabilization.
Rent comps 15 comps
| Address | Beds | Baths | Sqft | Rent | $/sqft | DOM | Units | Dist |
|---|---|---|---|---|---|---|---|---|
| 15012 71st Ave E South Hill, WA | 3.0 | 1.5 | 1200 | $2,300 | $1.92 | 1d | 1 | 0.33mi |
| 15010 71st Ave E Unit S168-12 Puyallup, WA | 3.0 | 1.5 | 1200 | $2,300 | $1.92 | 1d | 1 | 0.33mi |
| 16216 and16218 72nd Avenue Ct E Puyallup, WA | 3.0 | 2.5 | 1500 | $2,480 | $1.65 | 24d | 1 | 0.59mi |
| 7104 163rd St E Puyallup, WA | 3.0 | 2.0 | 1260 | $2,800 | $2.22 | 24d | 1 | 0.65mi |
| 15502 87th Ave E Unit 15502 South Hill, WA | 3.0 | 2.0 | 1300 | $2,495 | $1.92 | 24d | 1 | 0.72mi |
| 15623 90th Avenue Ct E Puyallup, WA | 3.0 | 2.0 | 1286 | $3,065 | $2.38 | 11d | 1 | 0.97mi |
| 15623 90th Avenue Ct E Puyallup, WA | 4.0 | 2.0 | 1286 | $3,065 | $2.38 | 12d | 1 | 0.97mi |
| 6719 135th Street Ct E Puyallup, WA | 4.0 | 2.5 | 1675 | $2,795 | $1.67 | 43d | 1 | 1.24mi |
| 6820 133rd Street Ct E Puyallup, WA | 3.0 | 2.5 | 1285 | $2,550 | $1.98 | 1d | 1 | 1.34mi |
| 97th Ave E Puyallup, WA | 3.0 | 2.5 | 1452 | $2,495 | $1.72 | 24d | 1 | 1.35mi |
| 9530 160th Street Ct E Puyallup, WA | 2.0–3.0 | 2.5 | 1284 | $2,550 | $1.99 | 12d | 1 | 1.38mi |
| 9611 161st St E Puyallup, WA | 2.0 | 2.5 | 1150 | $2,200 | $1.91 | 14d | 1 | 1.39mi |
| 6801 132nd Street Ct E Puyallup, WA | 4.0 | 3.0 | 1768 | $3,139 | $1.78 | 1d | 1 | 1.41mi |
| 7513 177th Street Ct E Puyallup, WA | 1.0–4.0 | 1.0–2.5 | 1243 | $2,940 | $2.37 | 10d | 7 | 1.47mi |
| 8345 175th Street Ct E Puyallup, WA | 2.0 | 2.5 | 1588 | $2,300 | $1.45 | 12d | 1 | 1.48mi |
Listing history 26 events
-
2026-06-18days on market $145,000 Active 35 DOM
-
2026-06-17days on market $145,000 Active 34 DOM
-
2026-06-16days on market $145,000 Active 33 DOM
-
2026-06-15days on market $145,000 Active 32 DOM
-
2026-06-13days on market $145,000 Active 30 DOM
-
2026-06-13days on market $145,000 Active 29 DOM
-
2026-06-09days on market $145,000 Active 26 DOM
-
2026-06-08days on market $145,000 Active 25 DOM
-
2026-06-07pricedays on market $145,000 Active 24 DOM
-
2026-06-04days on market $150,000 Active 21 DOM
-
2026-06-03days on market $150,000 Active 20 DOM
-
2026-06-02days on market $150,000 Active 19 DOM
-
2026-06-01days on market $150,000 Active 18 DOM
-
2026-05-31days on market $150,000 Active 17 DOM
-
2026-05-14$150,000 Active
-
2022-10-07soldstatus $53,500 Closed
-
2022-09-23status Pending
-
2022-09-06status Active
-
2022-08-31status Pending
-
2022-08-26price $58,950
-
2022-08-22price $62,000
-
2022-08-11status Active
-
2022-08-10status Pending
-
2022-08-05status Active
-
2022-07-16status Pending
-
2022-07-14$65,000 Active
ⓘ Source: listings_history table (triggers on properties + properties_extension) + one-shot
backfill from property_details.listing_events for pre-trigger history.
Tax reassessment forecast WA · Resets to sale price
- Current annual tax
- $878 · $73/mo
- Projected year-2 tax
- $1,421 · $118/mo
- Expected delta
- +$543/yr (+$45/mo · 61.8%)
ⓘ Screening estimate from a state-policy table — verify with the county assessor before closing.
Climate risk First Street
- Flood 1/10 Low FEMA zone X (unshaded) · 0% chance over 30 yrs
- Wildfire 1/10 Low
- Heat 3/10 Moderate 7 d/yr ≥87°F today · 14 d/yr by 30 yrs out
- Wind 1/10 Low
- Air quality 7/10 Severe 10 unhealthy d/yr today · 10 by 30 yrs out
Nearby sold comps map
Loading sold comps map…
Walkable amenities ~0.75 mi
Loading nearby amenities…
Taxation est. · year 1
- Rental income
- $32,983
- − Mortgage interest
- −$8,122
- − Property taxes
- −$878
- − Insurance
- −$725
- − Repairs & maintenance
- −$2,639
- − Management
- −$2,639
- − Depreciation
- −$4,218
- Taxable income
- $13,762
- Est. tax owed @ 24.0%
- −$3,303
- After-tax cash flow
- $12,026/yr
For passive investors: Depreciation is non-cash, so a rental often shows a tax loss while cash-flowing — sheltering income. Rental losses are passive: they offset passive income freely, and up to $25,000/yr can offset ordinary (W-2) income if you actively participate and your MAGI is under $100k (phasing out to $0 by $150k); unused losses carry forward. On sale, claimed depreciation is recaptured at up to 25%, and gains may owe capital-gains tax (a 1031 exchange can defer both). Figures are a year-1 estimate at your 24.0% rate — not tax advice; consult a CPA.
Schools (NCES district)
- District
- Puyallup School District
- NCES district ID
- 5306960
- Math proficiency
- 53% ▬ 0.00%
- Reading proficiency
- 66% ▬ 0.00%
- Median HH income
- $68,291
- Composite
- 54.01/100
- National rank
- #3006
- State rank
- #52 of 291 in WA
Livability — South Hill
- Score
- 80/100
- State rank
- #84
- US rank
- #1620
Category grades
Schools grade is shown separately in the Schools card above.
Census & demographics
- Census place
- South Hill, WA
- County
- Pierce County · 788,257 people
- City population
- 76,707
- Metro
- Seattle-Tacoma-Bellevue, WA
- Population (ZIP)
- 31,187
- Household income
- $117,074
- Rent vs Own
- Severe rent burden
- 541.0
Population outlook (Pierce County) Hauer SSP2
- Today (2025)
- 956,648 people
- By 2030
- 1,010,862 · +5.7%
- By 2040
- 1,113,170 · +16.4%
- By 2050
- 1,206,524 · +26.1%
- By 2075
- 1,436,425 · +50.2%
- By 2100
- 1,563,654 · +63.5%
Race, ethnicity, and origin ACS 2023
- Neighborhood character
- Diverse neighborhood (Simpson 0.64)
- Race & ethnicity
- White 57% Two or more races 22% Hispanic / Latino 13% Black 8% Asian 6% Pacific Islander 1%
- Hispanic origin (detail)
- Mexican 10% Puerto Rican 1%
- Common ancestry
- Portuguese 3% Lithuanian 3% Italian 3%
- Foreign-born
- 11% · Canada, China, South Korea
- Languages at home
- 82% English-only · Spanish 8% Other Indo-European 2% Other Asian/Pacific 2%
Political lean MEDSL · Pierce
- 2024 margin
- D (+10.8) · D 53.9% · R 43.1% · Other 3.0%
- 2008→2024 swing
- -1.4pp toward R · 2008: 12.2pp · 2024: 10.8pp
- All cycles
- 2024: D+10.8 2020: D+11.2 2016: D+7.5 2012: D+11.0 2008: D+12.2
Not yet ingested
- Civics
- —
Market trends
- HPI YoY
- ▼ -189.98%
- Current HPI
- 285.0074
- Rent YoY
- ▲ 2.79%
- Metro
- Seattle-Tacoma-Bellevue, WA
- State GDP YoY
- ▲ 4.65%
- F500 in state
- 22
Industry mix (Fortune 500 HQ in WA)
| Industry | F500 HQs | Revenue |
|---|---|---|
| Retail | 2 | $269B |
|
||
| Technology / Retail | 1 | $638B |
|
||
| Technology | 1 | $245B |
|
||
| Telecommunications | 1 | $38B |
|
||
| Food / Beverage | 1 | $36B |
|
||
| Automotive / Trucks | 1 | $34B |
|
||
Price history
+123.1% since first listed13 events — show timeline
- 2026-06-04 Price Changed $145,000 NWMLS as Distributed by MLS Grid
- 2026-05-14 Listed $150,000 NWMLS as Distributed by MLS Grid
- 2022-10-07 Sold (MLS) $53,500 NWMLS as Distributed by MLS Grid
- 2022-09-23 Pending — NWMLS as Distributed by MLS Grid
- 2022-09-06 Relisted — NWMLS as Distributed by MLS Grid
- 2022-08-31 Pending — NWMLS as Distributed by MLS Grid
- 2022-08-26 Price Changed $58,950 NWMLS as Distributed by MLS Grid
- 2022-08-22 Price Changed $62,000 NWMLS as Distributed by MLS Grid
- 2022-08-11 Relisted — NWMLS as Distributed by MLS Grid
- 2022-08-10 Pending — NWMLS as Distributed by MLS Grid
- 2022-08-05 Relisted — NWMLS as Distributed by MLS Grid
- 2022-07-16 Pending — NWMLS as Distributed by MLS Grid
- 2022-07-14 Listed $65,000 NWMLS as Distributed by MLS Grid
Property tax history
+8.5%/yrLatest (2026): $878 · +4.8% YoY. Source: county tax records.
Cash-flow waterfall
monthlySold comps — $/sqft
last 12 mo · ≤1 miLoading sold comps…