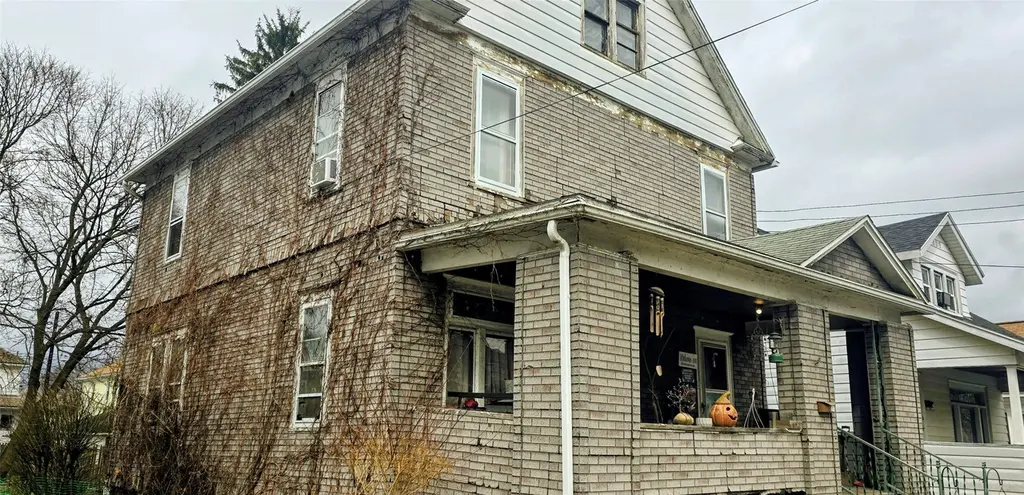
24 Burbank Ave · Johnson City, NY
Flood risk 7/10 · Major
- FEMA flood zone
- X
- Chance of flooding over 30 yrs
- 0.99%
- Est. flood insurance / yr
- $473 – $860
Fire risk 3/10 · Minor
- Est. fire insurance / yr
- $691 – $1,283
Heat risk 3/10 · Minor
- Hot days now (above 94°F)
- 7 days/yr
- Hot days in 30 yrs
- 16 days/yr
Wind risk 2/10 · Minimal
- Chance of severe wind over 30 yrs
- 1.0%
Air-quality risk 2/10 · Minimal
- Unhealthy air days now
- 0 days/yr
- Unhealthy air days in 30 yrs
- 1 days/yr
Risk factors via First Street. Map © Google.
Why this score? — see what drove the A- grade
The composite is a weighted blend of 9 inputs, each scored 0–100. Each bar is that input's sub-score; the figure is the points it added to the 100-point composite (weight × sub-score).
- Cash flow +26.4/30.0
- ARV discount +15.0/15.0
- 1% rule +10.0/10.0
- Appreciation +10.0/10.0
- DSCR +9.0/10.0
- Rent growth +4.9/5.0
- Livability +3.8/5.0
- Schools +3.3/10.0
- Condition / age +2.5/5.0
$99,500
🖨 Deal sheet (PDF) 📄 Offer letter ✓ Due diligence
Listing remarks
Hidden Gem and Fixer Upper! "As Is" Step into the charm and character of a classic 1900 home located in one of Johnson City’s most desirable neighborhoods. This spacious 3-bedroom, 1-bath residence offers a rare opportunity for buyers with vision to restore and modernize a home filled with original character. Inside, you’ll find a generously sized living room perfect for gathering and entertaining, along with beautiful hardwood floors and built-in cabinets that add warmth and timeless appeal. Conveniently located close to bus lines, shopping, and everyday amenities, this property combines location, character, and potential. With its solid bones and historic charm, t
Key facts
- Historic charm
- Built-in cabinets
- 4,600 sq ft lot
Tags
Neighborhood map
What this means for you Summary
Snapshot
- This is a 3-bed/1.0-bath single-family listed at $100k.
Deal economics
- At list price, monthly cash flow is $203 ($2k/yr) — positive.
- The deal already cash-flows at list — no discount required.
- Meets the 1% rule at list price ($2k rent vs $100k).
- Cap rate 9.4% vs local median 6.4% in Johnson City — top-decile yield for the area; either an underpriced asset or a hidden risk that comps aren't pricing in. Stress-test before assuming the spread holds.
Location & tenants
- Location reads 76/100 on livability (#238 in NY, #3,739 nationally) — a middle-class / working-renter tenant base. Strengths: cost of living A+, housing A+, health & safety A+; Watch: crime F, employment D-.
- Johnson City Central School District (suburban): math 38% / reading 41% proficiency, ranked #535 of 590 in NY (top 91%) — families likely to look elsewhere, expect single-tenant / working-renter base with shorter leases.
- Zoned schools: Johnson City Elementary/Primary School (496 students, 55% FRL) — zoned schools at 55% FRL track the district average.
- Market conditions: Rents rising fast (+9.5%/yr); 101 active listings in the ZIP; 19 comparable units currently listed for rent nearby; rentals at typical pace (median 23d on market — plan ~3-4 weeks tenant-placement turnaround); 340 units permitted in Broome County in 2024 (269 in 5+ unit buildings).
- This rent runs 31% of the median local income ($59k/yr) — at the standard rent-burdened threshold; future hikes will face affordability resistance.
Forward outlook
- In year one you build about $11k of equity ($688 loan paydown + $10k appreciation (10.0% local appreciation)).
- Broome County population projected at -13% by 2050 — secular population decline; favor cash flow + early exit over multi-decade hold.
- At projected returns (10.0% appreciation + 8.0% rent growth), your $28k cash investment doubles in ~2 years — after that, you're playing with house money.
- By year 4, paydown + projected appreciation supports a ~$38k cash-out refi (75% LTV) — recoverable capital for the next deal without selling this one.
Negotiation context
- Only 10 days on market — expect competitive offers; lowballing is unlikely to land.
Risks & watch-outs
- Watch-outs: property tax is 4.5% of price; flood insurance adds $56/mo; built in 1900 — expect roof / HVAC / electrical / plumbing capex.
- Climate carrying-cost: major flood risk — expect insurance premiums to compound above CPI over the hold.
Questions for the listing agent
- Built in 1900 — when were the roof, HVAC, electrical panel, plumbing, and water heater last replaced?
- Property tax is high relative to price — has the assessment been appealed recently, and will the sale trigger a re-assessment?
- What's the actual annual flood-insurance premium (NFIP or private), and is the property in a SFHA with mandatory coverage?
- Is there a deadline driving the sale (1031 exchange, divorce, estate, relocation)? That informs how much negotiation room exists.
- Crime grade is F in this area — have there been break-ins, vandalism, or insurance claims at this property in the last 3 years? What carrier currently insures it and at what premium?
- What's the average days-on-market for RENTAL listings here right now (not sales)? A rising rental-DOM trend means longer vacancies and softer asking-rent achievability than the comps imply.
- What's the recent tenant-quality profile in this submarket — average credit score on applications, eviction rate, late-payment / NSF rate, and stable-employment percentage? A property-management company in the area should have these aggregated.
- How much new for-sale + rental construction is in the pipeline within 1–3 miles? Heavy new supply typically softens prices + rents 12–24 months out; constrained supply supports both.
Investment metrics
- 1% rule
- 1.52% ✓
- Cap rate
- 9.42%
- Cash-on-cash
- 11.16%
- DSCR
- 1.50
- GRM
- 5.5
CMA / ARV
- ARV (on-the-fly)
- $153,120
- Comps found
- 12
Show comp detail 12 sales within ~0.75 mi
| Address | Dist | Beds/Ba | Sqft | Sold | Price | $/sf | Match |
|---|---|---|---|---|---|---|---|
| 19 Stokes Ave | 0.49mi | 3/1.0 | 1,369 (-2%) | 5mo | $175,000 | $128 | 70 |
| 20 Brown St | 0.64mi | 3/2.0 | 1,386 (-0%) | 0mo | $95,000 | $69 | 65 |
| 119 Lincoln Ave | 0.40mi | 3/1.0 | 1,248 (-10%) | 5mo | $120,000 | $96 | 60 |
| 73 Elizabeth St | 0.47mi | 3/2.5 | 1,480 (+6%) | 2mo | $190,000 | $128 | 60 |
| 43 Haynes Ave | 0.55mi | 4/1.5 (+1) | 1,360 (-2%) | 5mo | $155,000 | $114 | 59 |
| 135 Crestmont Rd | 0.63mi | 4/1.5 (+1) | 1,350 (-3%) | 0mo | $117,000 | $87 | 58 |
| 129 Ackley Ave | 0.51mi | 4/1.5 (+1) | 1,460 (+5%) | 5mo | $160,000 | $110 | 57 |
| 32 Haynes Ave | 0.55mi | 3/1.0 | 1,518 (+9%) | 5mo | $95,000 | $63 | 55 |
| 22 Park St | 0.54mi | 3/1.0 | 1,200 (-14%) | 2mo | $175,257 | $146 | 50 |
| 134 Matthews St | 0.65mi | 3/1.0 | 1,239 (-11%) | 5mo | $144,000 | $116 | 48 |
| 149 Matthews St | 0.58mi | 3/1.5 | 1,564 (+12%) | 5mo | $145,000 | $93 | 46 |
| 20 Lake Ave Ave | 0.63mi | 4/2.0 (+1) | 1,568 (+13%) | 2mo | $125,000 | $80 | 39 |
Match score weights: distance 35% · size 25% · config 20% · recency 20%. Top-matched comps best support the ARV.
Projected returns pro-forma
10.0% appreciation · 8.0% rent growth · sell at horizon
- IRR
- 33.7%
- Equity multiple
- 3.71×
- Total profit
- $75,373
- Equity at exit
- $89,637
- IRR
- 31.3%
- Equity multiple
- 9.33×
- Total profit
- $232,043
- Equity at exit
- $193,307
Cash invested: $27,860 (down + closing). Projections, not guarantees.
Landlord ↔ Tenant lean methodology
- Overall (STATE)
- 15 Strongly Tenant-Friendly
- State New York
- 15 Strongly Tenant-Friendly · D+10
- County
- — inherits STATE
- City
- — inherits STATE
ZIP-level market 13790
- Home prices YoY
- 6.8%
- Rents YoY
- 9.5%
- Active inventory
- 101
- Price-to-rent
- 5.5×
Monthly cashflow live
- Estimated rent
- $1,516 high interval (Pro) →
- Mortgage (P&I)
- −$522
- Tax from tax record
- −$376 /mo · $4,508/yr
- Insurance
- −$41
- Flood insurance flood zone
- −$56 /mo · $666/yr
- HOA
- −$0
- Vacancy / Maint / Mgmt
- −$318
- Net cashflow
- $203
Break-even live
Sensitivity live
| Price | -10% $524 | -5% $232 | +0% $203 | +5% $175 | +10% $147 |
|---|---|---|---|---|---|
| Rent | -10% $84 | -5% $144 | +0% $203 | +5% $263 | +10% $323 |
| Rate | -1.0pp $254 | -0.5pp $229 | base $203 | +0.5pp $178 | +1.0pp $151 |
UW: 25.0% down · 7.5% · 30yr · 1.5% tax · 5.0% vac · 8.0% maint · 8.0% mgmt
Financing live
Cash to close
- Down payment
- $24,875
- Closing costs
- $2,985
- Reserves months
- —
- Total cash needed
- —
Loan-product check · same deal, 3 products live
Conventional
25% down · 7.5% · 30yr
- Down + closing
- —
- Monthly P&I
- —
- Monthly cashflow
- —
- DSCR
- —
- Eligible?
- —
Personal DTI + credit; lowest rate.
DSCR
20% down · 8.5% · 30yr
- Down + closing
- —
- Monthly P&I
- —
- Monthly cashflow
- —
- DSCR
- —
- Eligible?
- —
No personal income docs; deal must DSCR.
Hard money
10% down · 12.0% · 12mo
- Down + closing
- —
- Monthly P&I
- —
- Monthly cashflow
- —
- DSCR
- —
- Eligible?
- —
Short-term bridge; refi at stabilization.
Rent comps 19 comps
| Address | Beds | Baths | Sqft | Rent | $/sqft | DOM | Units | Dist |
|---|---|---|---|---|---|---|---|---|
| 145 Floral Ave Unit 4 Johnson City, NY | 3.0 | 1.0 | 1095 | $1,250 | $1.14 | 22d | 1 | 0.12mi |
| 127 Burbank Ave Unit 2 Johnson City, NY | 2.0 | 1.0 | 1032 | $1,000 | $0.97 | 22d | 1 | 0.23mi |
| 248 Main St Unit 2 Johnson City, NY | 2.0 | 1.0 | 1650 | $1,650 | $1.00 | 14d | 1 | 0.37mi |
| 207 Saint Charles St #2 Johnson City, NY | 2.0 | 1.0 | 925 | $1,250 | $1.35 | 22d | 1 | 0.39mi |
| 51 Allen St Unit 1 Johnson City, NY | 3.0 | 1.0 | 1170 | $1,575 | $1.35 | 22d | 1 | 0.54mi |
| 296 Main St Unit 6 Binghamton, NY | 3.0 | 1.0 | 1200 | $1,250 | $1.04 | 14d | 1 | 0.62mi |
| 50 Crocker Ave Johnson City, NY | 4.0 | 2.0 | 1411 | $2,000 | $1.42 | 22d | 1 | 0.65mi |
| 133 Crestmont Rd Unit 2 Binghamton, NY | 3.0 | 1.0 | 1300 | $1,900 | $1.46 | 45d | 1 | 0.65mi |
| 263 Main St Binghamton, NY | 2.0 | 1.0 | 920 | $1,200 | $1.30 | 14d | 1 | 0.75mi |
| 4 Baxter St Unit Left Binghamton, NY | 4.0 | 2.5 | 1800 | $1,500 | $0.83 | 14d | 1 | 0.76mi |
| 129 Helen St Unit 1 Binghamton, NY | 4.0 | 2.0 | 1850 | $2,200 | $1.19 | 45d | 1 | 0.78mi |
| 400 Riverside Dr Unit 15 Johnson City, NY | 3.0 | 1.0 | 1000 | $2,425 | $2.42 | 14d | 1 | 0.80mi |
| 400 Riverside Dr Unit 212 Johnson City, NY | 3.0 | 1.0 | 1100 | $2,500 | $2.27 | 14d | 1 | 0.80mi |
| 99 Helen St Unit 2 Binghamton, NY | 3.0 | 1.0 | 1220 | $1,600 | $1.31 | 45d | 1 | 0.88mi |
| 36 Haendel St Unit 1 Binghamton, NY | 3.0 | 1.0 | 1600 | $1,650 | $1.03 | 45d | 1 | 1.04mi |
| 36 Haendel St Unit Second Floor Binghamton, NY | 3.0 | 1.0 | 1200 | $1,450 | $1.21 | 45d | 1 | 1.04mi |
| 16 Highland Ave Unit 1 Binghamton, NY | 3.0 | 1.0 | 1400 | $1,650 | $1.18 | 45d | 1 | 1.05mi |
| 11 Dayton St Apt 5 Johnson City, NY | 2.0 | 1.0 | 900 | $1,200 | $1.33 | 14d | 1 | 1.24mi |
| 10 Bidwell St Johnson City, NY | 3.0 | 2.0 | 1200 | $1,850 | $1.54 | 45d | 1 | 1.40mi |
Listing history 2 events
-
2026-03-27status Pending
-
2026-03-17$99,500 Active
ⓘ Source: listings_history table (triggers on properties + properties_extension) + one-shot
backfill from property_details.listing_events for pre-trigger history.
Tax reassessment forecast NY · Partial reset (capped growth)
- Current annual tax
- $4,508 · $376/mo
- Projected year-2 tax
- $4,508 · $376/mo
- Expected delta
- $0/yr ($0/mo · 0.0%)
ⓘ Screening estimate from a state-policy table — verify with the county assessor before closing.
Climate risk First Street
- Flood 7/10 Severe FEMA zone X · 99% chance over 30 yrs
- Wildfire 3/10 Moderate
- Heat 3/10 Moderate 7 d/yr ≥94°F today · 16 d/yr by 30 yrs out
- Wind 2/10 Low 100% chance of damaging wind over 30 yrs
- Air quality 2/10 Low 0 unhealthy d/yr today · 1 by 30 yrs out
Nearby sold comps map
Loading sold comps map…
Walkable amenities ~0.75 mi
Loading nearby amenities…
Taxation est. · year 1
- Rental income
- $18,196
- − Mortgage interest
- −$5,574
- − Property taxes
- −$4,508
- − Insurance
- −$1,164
- − Repairs & maintenance
- −$1,456
- − Management
- −$1,456
- − Depreciation
- −$2,895
- Taxable income
- $1,144
- Est. tax owed @ 24.0%
- −$275
- After-tax cash flow
- $2,167/yr
For passive investors: Depreciation is non-cash, so a rental often shows a tax loss while cash-flowing — sheltering income. Rental losses are passive: they offset passive income freely, and up to $25,000/yr can offset ordinary (W-2) income if you actively participate and your MAGI is under $100k (phasing out to $0 by $150k); unused losses carry forward. On sale, claimed depreciation is recaptured at up to 25%, and gains may owe capital-gains tax (a 1031 exchange can defer both). Figures are a year-1 estimate at your 24.0% rate — not tax advice; consult a CPA.
Schools (NCES district)
- District
- Johnson City Central School District
- NCES district ID
- 3615900
- Math proficiency
- 38% ▼ -8.00%
- Reading proficiency
- 41% ▲ 2.00%
- Median HH income
- $40,514
- Composite
- 33.17/100
- National rank
- #5545
- State rank
- #535 of 590 in NY
Livability — Johnson City
- Score
- 76/100
- State rank
- #238
- US rank
- #3739
Category grades
Schools grade is shown separately in the Schools card above.
Census & demographics
- Census place
- Johnson City, NY
- County
- Broome County · 126,805 people
- City population
- 18,739
- Metro
- Binghamton, NY
- Population (ZIP)
- 18,739
- Household income
- $59,045
- Rent vs Own
- Severe rent burden
- 1233.0
Population outlook (Broome County) Hauer SSP2
- Today (2025)
- 187,989 people
- By 2030
- 183,066 · -2.6%
- By 2040
- 172,228 · -8.4%
- By 2050
- 163,161 · -13.2%
- By 2075
- 153,641 · -18.3%
- By 2100
- 140,851 · -25.1%
Race, ethnicity, and origin ACS 2023
- Neighborhood character
- Predominantly White (75%)
- Race & ethnicity
- White 75% Two or more races 9% Asian 8% Black 6% Hispanic / Latino 4%
- Common ancestry
- Romanian 6% Lithuanian 3% Scotch-Irish 2%
- Foreign-born
- 9% · Canada, China, Vietnam
- Languages at home
- 88% English-only · Other Indo-European 4% French/Haitian/Cajun 2% Spanish 2%
Political lean MEDSL · Broome
- 2024 margin
- Toss-up / Even · D 50.2% · R 49.8%
- 2008→2024 swing
- -7.6pp toward R · 2008: 8.0pp · 2024: 0.4pp
- All cycles
- 2024: D+0.4 2020: D+3.5 2016: R+3.7 2012: D+4.6 2008: D+8.0
Not yet ingested
- Civics
- —
Market trends
- HPI YoY
- ▲ 18.06%
- Current HPI
- 285.3668
- Rent YoY
- ▲ 9.47%
- Metro
- Binghamton, NY
- State GDP YoY
- ▲ 2.60%
- F500 in state
- 92
Industry mix (Fortune 500 HQ in NY)
| Industry | F500 HQs | Revenue |
|---|---|---|
| Financial Services | 10 | $950B |
|
||
| Consumer Goods | 9 | $162B |
|
||
| Insurance | 4 | $225B |
|
||
| Telecommunications | 2 | $144B |
|
||
| Pharmaceuticals | 2 | $112B |
|
||
| Media / Entertainment | 2 | $69B |
|
||
Price history
2 events — show timeline
- 2026-03-27 Pending — GBAOR
- 2026-03-17 Listed $99,500 GBAOR
Property tax history
+2.2%/yrLatest (2025): $4,508 · +1.7% YoY. Source: county tax records.
Cash-flow waterfall
monthlySold comps — $/sqft
last 12 mo · ≤1 miLoading sold comps…