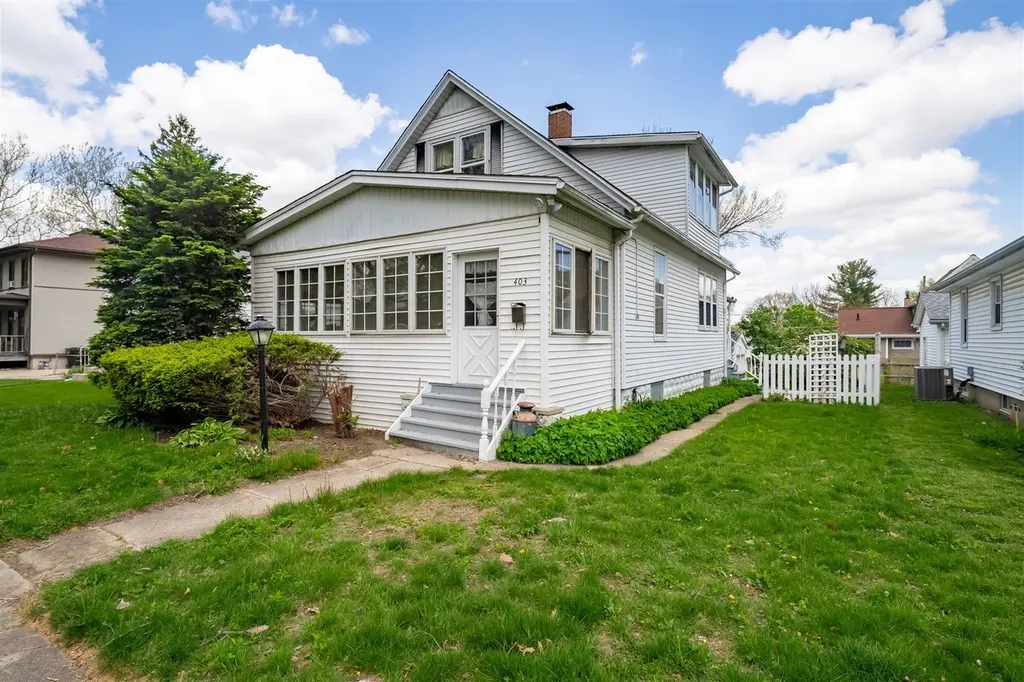
403 W Kelsey St · Bloomington, IL
Flood risk 1/10 · Minimal
- FEMA flood zone
- X (unshaded)
- Chance of flooding over 30 yrs
- 0.0%
- Est. flood insurance / yr
- $507 – $1,088
Fire risk 1/10 · Minimal
- Est. fire insurance / yr
- $804 – $1,492
Heat risk 3/10 · Minor
- Hot days now (above 105°F)
- 7 days/yr
- Hot days in 30 yrs
- 18 days/yr
Wind risk 2/10 · Minimal
- Chance of severe wind over 30 yrs
- 1.0%
Air-quality risk 2/10 · Minimal
- Unhealthy air days now
- 1 days/yr
- Unhealthy air days in 30 yrs
- 2 days/yr
Risk factors via First Street. Map © Google.
Why this score? — see what drove the B+ grade
The composite is a weighted blend of 9 inputs, each scored 0–100. Each bar is that input's sub-score; the figure is the points it added to the 100-point composite (weight × sub-score).
- Cash flow +30.0/30.0
- ARV discount +15.0/15.0
- 1% rule +10.0/10.0
- DSCR +10.0/10.0
- Rent growth +3.9/5.0
- Livability +3.9/5.0
- Condition / age +2.5/5.0
- Schools +1.5/10.0
- Appreciation +0.0/10.0
$144,900
🖨 Deal sheet (PDF) 📄 Offer letter ✓ Due diligence
Listing remarks
Fantastic investment opportunity! This 1.5 Story home has so much potential . Upon entry you will find a super cozy Enclosed Porch ~ perfect for peaceful evenings or morning coffee relaxation time. The Main Floor has a good sized Living Room, Open Dining , Large expansive Kitchen with plentiful Counters and Cabinetry , Full Bath, and 2 Main Floor Bedrooms. The Upper level has the 3rd Bedroom plus an additional "other room" that would make a fabulous play room or office . The Lower Level has 3 finished areas, a Family Room currently utilized as Train Room Central , an Office Area, a Storage Area , and Large Laundry area. House Roof has been recently replaced .
Key facts
- Large laundry area
- Family room
- Office area
Tags
Property features AI
Finance
- HOA & community: No master association fee required
Exterior
- Parking: Detached garage (owned) — 1 garage space, 1 total parking space
- Utilities: Public water; Public sewer
- Home design: Detached single-family home; 1.5-story design; Fee simple ownership; Over 100 years old; Not rebuilt or recently rehabbed
- Construction: Wood siding; Asphalt roof; Below-grade finished area and additional unfinished basement space; Built before 1978
- Exterior features: Lot dimensions approximately 110 x 50; Lot less than 0.25 acre; School bus service
Interior
- Kitchen: Eating area / table space; Range; Refrigerator
- Bedrooms: 3 bedrooms total; Master bedroom on main level; Additional bedrooms on main and second levels
- Flooring: Carpet in living room
- Bathrooms: 1 full bathroom
- Heating & cooling: Natural gas heating; Central air conditioning
- Interior features: First-floor bedroom; First-floor full bathroom; Separate dining room; Partially finished, crawl space and full basement; Estimated total finished living area about 2,310 (includes below-grade finished area)
- Laundry & utility: Laundry room in basement; Washer and dryer included
Neighborhood map
What this means for you Summary
Snapshot
- This is a 3-bed/1.0-bath single-family listed at $145k.
Deal economics
- At list price, monthly cash flow is $711 ($9k/yr) — positive.
- The deal already cash-flows at list — no discount required.
- Meets the 1% rule at list price ($2k rent vs $145k).
- Recommended offer: $143k (1.5% below list) — sets the bar for market timing.
- Cap rate 12.2% vs local median 5.4% in Bloomington — top-decile yield for the area; either an underpriced asset or a hidden risk that comps aren't pricing in. Stress-test before assuming the spread holds.
Location & tenants
- Location reads 77/100 on livability (#161 in IL, #2,987 nationally) — a middle-class / working-renter tenant base. Strengths: cost of living A+, housing A+, health & safety A+; Watch: amenities C-, commute F.
- Bloomington SD 87 (urban): math 14% / reading 19% proficiency, ranked #476 of 620 in IL (top 77%) — low school quality limits family demand, transient renter base, plan for 1-2y turnover.
- Zoned schools: Bent Elem School (math 8% / reading 8%, grade F, #1,627 of 2,056 statewide, top 81%, 374 students, 0% FRL); Bloomington Jr High School (math 12% / reading 19%, grade F, #493 of 665 statewide, top 75%, 1,006 students, 0% FRL); Bloomington High School (math 27% / reading 33%, grade F, #179 of 693 statewide, top 27%, 1,503 students, 0% FRL) — zoned schools average 0% FRL vs 51% district-wide (51 pts lower); this property's tenant base skews higher-income than the district average.
- Market conditions: Rents rising fast (+5.6%/yr); 92 active listings in the ZIP; 3 comparable units currently listed for rent nearby; rentals lingering (median 45d on market — plan ~5-8 weeks vacancy on turnover, expect pricing pressure); 67% of comp listings sitting > 30 days — soft ceiling on asking rent; 247 units permitted in McLean County in 2024 (54 in 5+ unit buildings).
- At $2,217/mo this rent would consume 47% of the median local household income ($57k/yr) (locally 1493% of renters already pay >50% of income on rent) — very limited rent-growth headroom before tenants either downsize or default.
Forward outlook
- Local home prices are declining (-3.0%/yr); year-one equity from $1k of loan paydown is wiped out by about $4k of value loss. Plan a longer hold.
- At projected returns (-3.0% appreciation + 5.6% rent growth), your $41k cash investment doubles in ~6 years — after that, you're playing with house money.
Negotiation context
- It's been on market 15 days — a 2% lower offer ($143k) is reasonable based on typical stale-listing flexibility.
- 2 sale attempts with the ask held roughly flat each time — persistent listings suggest the price (not the market) is what's stuck; bring a comps-based counter.
Risks & watch-outs
- Watch-outs: built in 1910 — expect roof / HVAC / electrical / plumbing capex.
Questions for the listing agent
- Built in 1910 — when were the roof, HVAC, electrical panel, plumbing, and water heater last replaced?
- Is there a deadline driving the sale (1031 exchange, divorce, estate, relocation)? That informs how much negotiation room exists.
- What's the average days-on-market for RENTAL listings here right now (not sales)? A rising rental-DOM trend means longer vacancies and softer asking-rent achievability than the comps imply.
- What's the recent tenant-quality profile in this submarket — average credit score on applications, eviction rate, late-payment / NSF rate, and stable-employment percentage? A property-management company in the area should have these aggregated.
- How much new for-sale + rental construction is in the pipeline within 1–3 miles? Heavy new supply typically softens prices + rents 12–24 months out; constrained supply supports both.
Investment metrics
- 1% rule
- 1.53% ✓
- Cap rate
- 12.18%
- Cash-on-cash
- 21.04%
- DSCR
- 1.94
- GRM
- 5.4
CMA / ARV
- ARV (on-the-fly)
- $177,696
- Comps found
- 12
Show comp detail 12 sales within ~0.75 mi
| Address | Dist | Beds/Ba | Sqft | Sold | Price | $/sf | Match |
|---|---|---|---|---|---|---|---|
| 1002 N Roosevelt Ave | 0.42mi | 4/2.0 (+1) | 2,222 (-10%) | 4mo | $160,000 | $72 | 51 |
| 1205 N Clinton Blvd | 0.74mi | 3/1.5 | 2,520 (+2%) | 11mo | $210,000 | $83 | 51 |
| 1216 N Oak St | 0.29mi | 4/2.0 (+1) | 2,754 (+12%) | 11mo | $185,000 | $67 | 49 |
| 413 Phoenix Ave | 0.55mi | 3/2.0 | 2,682 (+9%) | 8mo | $172,000 | $64 | 49 |
| 601 W Chestnut St | 0.61mi | 4/2.0 (+1) | 2,400 (-3%) | 13mo | $169,000 | $70 | 48 |
| 1411 Fell Ave | 0.59mi | 3/1.0 | 2,160 (-12%) | 7mo | $250,000 | $116 | 45 |
| 910 N Madison St | 0.50mi | 3/2.0 | 2,125 (-14%) | 5mo | $70,000 | $33 | 45 |
| 502 E Emerson St | 0.58mi | 2/1.0 (-1) | 2,288 (-7%) | 13mo | $155,500 | $68 | 45 |
| 1408 Fell Ave | 0.56mi | 4/2.0 (+1) | 2,808 (+14%) | 1mo | $300,000 | $107 | 41 |
| 1404 Fell Ave | 0.56mi | 3/2.0 | 2,130 (-14%) | 10mo | $215,000 | $101 | 38 |
| 602 N Lee St | 0.75mi | 4/1.0 (+1) | 2,700 (+9%) | 9mo | $155,000 | $57 | 37 |
| 711 Ohara St | 0.51mi | 3/2.0 | 2,100 (-15%) | 14mo | $225,000 | $107 | 36 |
Match score weights: distance 35% · size 25% · config 20% · recency 20%. Top-matched comps best support the ARV.
Projected returns pro-forma
-3.0% appreciation · 5.6% rent growth · sell at horizon
- IRR
- 16.5%
- Equity multiple
- 1.69×
- Total profit
- $27,830
- Equity at exit
- $21,605
- IRR
- 26.9%
- Equity multiple
- 3.68×
- Total profit
- $108,556
- Equity at exit
- $12,528
Cash invested: $40,572 (down + closing). Projections, not guarantees.
Landlord ↔ Tenant lean methodology
- Overall (STATE)
- 43 Moderately Tenant-Leaning
- State Illinois
- 43 Moderately Tenant-Leaning · D+7
- County
- — inherits STATE
- City
- — inherits STATE
ZIP-level market 61701
- Rents YoY
- 5.6%
- Active inventory
- 92
- Price-to-rent
- 5.4×
Monthly cashflow live
- Estimated rent
- $2,217 medium interval (Pro) →
- Mortgage (P&I)
- −$760
- Tax from tax record
- −$220 /mo · $2,639/yr
- Insurance
- −$60
- HOA
- −$0
- Vacancy / Maint / Mgmt
- −$466
- Net cashflow
- $711
Break-even live
Sensitivity live
| Price | -10% $793 | -5% $752 | +0% $711 | +5% $670 | +10% $629 |
|---|---|---|---|---|---|
| Rent | -10% $536 | -5% $624 | +0% $711 | +5% $799 | +10% $886 |
| Rate | -1.0pp $784 | -0.5pp $748 | base $711 | +0.5pp $674 | +1.0pp $636 |
UW: 25.0% down · 7.5% · 30yr · 1.5% tax · 5.0% vac · 8.0% maint · 8.0% mgmt
Financing live
Cash to close
- Down payment
- $36,225
- Closing costs
- $4,347
- Reserves months
- —
- Total cash needed
- —
Loan-product check · same deal, 3 products live
Conventional
25% down · 7.5% · 30yr
- Down + closing
- —
- Monthly P&I
- —
- Monthly cashflow
- —
- DSCR
- —
- Eligible?
- —
Personal DTI + credit; lowest rate.
DSCR
20% down · 8.5% · 30yr
- Down + closing
- —
- Monthly P&I
- —
- Monthly cashflow
- —
- DSCR
- —
- Eligible?
- —
No personal income docs; deal must DSCR.
Hard money
10% down · 12.0% · 12mo
- Down + closing
- —
- Monthly P&I
- —
- Monthly cashflow
- —
- DSCR
- —
- Eligible?
- —
Short-term bridge; refi at stabilization.
Rent comps 3 comps
| Address | Beds | Baths | Sqft | Rent | $/sqft | DOM | Units | Dist |
|---|---|---|---|---|---|---|---|---|
| 1102 N Madison St Bloomington, IL | 3.0 | 2.0 | 1603 | $1,950 | $1.22 | 22d | 1 | 0.36mi |
| 501 E Emerson St Bloomington, IL | 3.0 | 1.5 | 2825 | $2,500 | $0.88 | 45d | 1 | 0.56mi |
| 1 Uptown Cir Normal, IL | 1.0–3.0 | 1.0–2.0 | 1564 | $4,750 | $3.04 | 45d | 4 | 1.22mi |
Listing history 10 events
-
2026-06-07statusdays on market $144,900 Pending 15 DOM
-
2026-06-03days on market $144,900 Active 13 DOM
-
2026-06-02days on market $144,900 Active 12 DOM
-
2026-06-01days on market $144,900 Active 11 DOM
-
2026-05-31days on market $144,900 Active 10 DOM
-
2026-05-30days on market $144,900 Active 9 DOM
-
2026-05-25status Active
-
2026-05-25price $144,900
-
2026-04-29status Pending
-
2026-04-26$149,900 Active
ⓘ Source: listings_history table (triggers on properties + properties_extension) + one-shot
backfill from property_details.listing_events for pre-trigger history.
Tax reassessment forecast IL · Partial reset (capped growth)
- Current annual tax
- $2,639 · $220/mo
- Projected year-2 tax
- $2,964 · $247/mo
- Expected delta
- +$325/yr (+$27/mo · 12.3%)
ⓘ Screening estimate from a state-policy table — verify with the county assessor before closing.
Climate risk First Street
- Flood 1/10 Low FEMA zone X (unshaded) · 0% chance over 30 yrs
- Wildfire 1/10 Low
- Heat 3/10 Moderate 7 d/yr ≥105°F today · 18 d/yr by 30 yrs out
- Wind 2/10 Low 100% chance of damaging wind over 30 yrs
- Air quality 2/10 Low 1 unhealthy d/yr today · 2 by 30 yrs out
Nearby sold comps map
Loading sold comps map…
Walkable amenities ~0.75 mi
Loading nearby amenities…
Taxation est. · year 1
- Rental income
- $26,605
- − Mortgage interest
- −$8,117
- − Property taxes
- −$2,639
- − Insurance
- −$724
- − Repairs & maintenance
- −$2,128
- − Management
- −$2,128
- − Depreciation
- −$4,215
- Taxable income
- $6,652
- Est. tax owed @ 24.0%
- −$1,597
- After-tax cash flow
- $6,939/yr
For passive investors: Depreciation is non-cash, so a rental often shows a tax loss while cash-flowing — sheltering income. Rental losses are passive: they offset passive income freely, and up to $25,000/yr can offset ordinary (W-2) income if you actively participate and your MAGI is under $100k (phasing out to $0 by $150k); unused losses carry forward. On sale, claimed depreciation is recaptured at up to 25%, and gains may owe capital-gains tax (a 1031 exchange can defer both). Figures are a year-1 estimate at your 24.0% rate — not tax advice; consult a CPA.
Schools (NCES district)
- District
- Bloomington SD 87
- NCES district ID
- 1706480
- Math proficiency
- 14% ▼ -7.00%
- Reading proficiency
- 19% ▼ -7.00%
- Median HH income
- $50,544
- Composite
- 15.05/100
- National rank
- #9351
- State rank
- #476 of 620 in IL
Livability — Bloomington
- Score
- 77/100
- State rank
- #161
- US rank
- #2987
Category grades
Schools grade is shown separately in the Schools card above.
Census & demographics
- Census place
- Bloomington, IL
- County
- McLean County · 126,490 people
- City population
- 72,415
- Metro
- Bloomington, IL
- Population (ZIP)
- 35,136
- Household income
- $57,130
- Rent vs Own
- Severe rent burden
- 1493.0
Population outlook (McLean County) Hauer SSP2
- Today (2025)
- 176,468 people
- By 2030
- 178,002 · +0.9%
- By 2040
- 178,592 · +1.2%
- By 2050
- 177,090 · +0.4%
- By 2075
- 173,224 · -1.8%
- By 2100
- 158,425 · -10.2%
Race, ethnicity, and origin ACS 2023
- Neighborhood character
- Predominantly White (70%)
- Race & ethnicity
- White 70% Black 13% Two or more races 9% Hispanic / Latino 9% Asian 3%
- Hispanic origin (detail)
- Mexican 7%
- Common ancestry
- Romanian 3% Slovak 2% Italian 1%
- Foreign-born
- 6% · Canada, Philippines, Vietnam
- Languages at home
- 91% English-only · Spanish 5% Other Asian/Pacific 1% Other Indo-European 1%
Political lean MEDSL · McLean
- 2024 margin
- Toss-up / Even · D 51.6% · R 46.8% · Other 1.6%
- 2008→2024 swing
- +3.7pp toward D · 2008: 1.2pp · 2024: 4.9pp
- All cycles
- 2024: D+4.9 2020: D+3.9 2016: R+1.5 2012: R+11.1 2008: D+1.2
Not yet ingested
- Civics
- —
Market trends
- HPI YoY
- ▼ -115.13%
- Current HPI
- 172.3659
- Rent YoY
- ▲ 5.60%
- Metro
- Bloomington, IL
- State GDP YoY
- ▲ 1.59%
- F500 in state
- 60
Industry mix (Fortune 500 HQ in IL)
| Industry | F500 HQs | Revenue |
|---|---|---|
| Insurance | 4 | $201B |
|
||
| Consumer Goods | 4 | $87B |
|
||
| Industrial Machinery | 3 | $64B |
|
||
| Healthcare | 2 | $55B |
|
||
| Retail / Pharmacy | 1 | $148B |
|
||
| Agriculture / Food | 1 | $86B |
|
||
Price history
-3.3% since first listed4 events — show timeline
- 2026-05-25 Relisted — MRED as Distributed by MLS Grid
- 2026-05-25 Price Changed $144,900 MRED as Distributed by MLS Grid
- 2026-04-29 Pending — MRED as Distributed by MLS Grid
- 2026-04-26 Listed $149,900 MRED as Distributed by MLS Grid
Property tax history
+2.2%/yrLatest (2023): $2,639 · +1.4% YoY. Source: county tax records.
Cash-flow waterfall
monthlySold comps — $/sqft
last 12 mo · ≤1 miLoading sold comps…