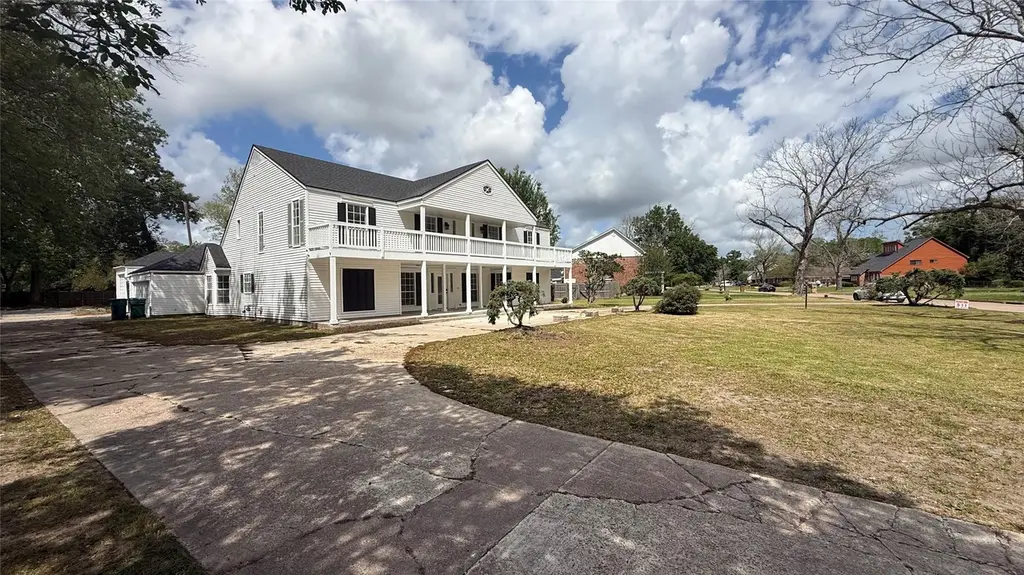
4409 Hillbrook Dr · Orange, TX
Flood risk 6/10 · Moderate
- FEMA flood zone
- X (unshaded)
- Chance of flooding over 30 yrs
- 0.74%
- Est. flood insurance / yr
- $507 – $1,088
Fire risk 3/10 · Minor
- Est. fire insurance / yr
- $1,222 – $2,270
Heat risk 9/10 · Severe
- Hot days now (above 108°F)
- 7 days/yr
- Hot days in 30 yrs
- 23 days/yr
Wind risk 9/10 · Severe
- Chance of severe wind over 30 yrs
- 99.0%
Air-quality risk 2/10 · Minimal
- Unhealthy air days now
- 1 days/yr
- Unhealthy air days in 30 yrs
- 1 days/yr
Risk factors via First Street. Map © Google.
Why this score? — see what drove the D grade
The composite is a weighted blend of 9 inputs, each scored 0–100. Each bar is that input's sub-score; the figure is the points it added to the 100-point composite (weight × sub-score).
- Cash flow +15.0/30.0
- ARV discount +7.5/15.0
- 1% rule +5.0/10.0
- DSCR +5.0/10.0
- Livability +3.6/5.0
- Rent growth +2.5/5.0
- Condition / age +2.5/5.0
- Schools +1.6/10.0
- Appreciation +0.0/10.0
$1
🖨 Deal sheet (PDF) 📄 Offer letter ✓ Due diligence
Listing remarks
Welcome to this beautifully updated home in a quiet, established neighborhood with no restrictions, no HOA, offering comfort, space, and extensive modern upgrades. Filled with natural light, this well-maintained home features major improvements completed in late 2025 and 2026, including a new roof, two A/C systems, two water heaters, water-resistant luxury vinyl flooring throughout with no carpet, and updated cabinetry with granite countertops. The spacious floor plan offers 4 bedrooms, 3 1/2 bathrooms, and a 3-car garage, providing flexibility for family living, guests, a home office, or entertaining. Step outside to enjoy your private backyard retreat featuring a swimming pool, perfect fo
Key facts
- Private backyard
- New flooring
- New cabinets
Tags
Property features AI
Exterior
- Parking: Attached 2-car garage; Additional parking with alley access
- Security: Security gate
- Utilities: Public sewer
- Home design: Residential property; Built in 1982; Slab foundation
- Construction: Brick, synthetic stucco, and wood siding exterior; Shingle and wood roof
- Exterior features: Private above-ground pool; Corner lot; Security gate
Interior
- Kitchen: Dishwasher; Garbage disposal
- Bedrooms: Primary bedroom on the first floor (14 x 9); Three additional bedrooms on the second floor (11 x 13; 11 x 9; 12 x 10)
- Bathrooms: Three full bathrooms; One half bathroom
- Heating & cooling: Central heating (electric); Central air conditioning (electric)
- Interior features: One fireplace
Neighborhood map
What this means for you Summary
Snapshot
- This is a 4-bed/3.5-bath single-family listed at $1.
Deal economics
- At list price, monthly cash flow is $1k ($17k/yr) — positive.
- The deal already cash-flows at list — no discount required.
- Meets the 1% rule at list price ($2k rent vs $1).
- Cap rate 1685105.9% vs local median 3.8% in Orange — top-decile yield for the area; either an underpriced asset or a hidden risk that comps aren't pricing in. Stress-test before assuming the spread holds.
Location & tenants
- Location reads 71/100 on livability (#286 in TX) — a middle-class / working-renter tenant base. Strengths: cost of living A+, housing A+, health & safety A+; Watch: crime D+, employment D+, amenities F.
- West Orange-Cove CISD (suburban): math 17% / reading 21% proficiency, ranked #784 of 826 in TX (top 95%) — low school quality limits family demand, transient renter base, plan for 1-2y turnover; 79% free/reduced lunch — lower-income household profile, screen leases tightly.
- Zoned schools: West Orange-Stark El (math 14% / reading 17%, grade F, #3,990 of 4,322 statewide, top 93%, 1,130 students, 94% FRL); West Orange-Stark Middle (math 20% / reading 20%, grade F, #1,428 of 1,662 statewide, top 87%, 505 students, 92% FRL); West Orange-Stark H S (math 19% / reading 31%, grade F, #1,250 of 1,632 statewide, top 77%, 660 students, 88% FRL).
- Market conditions: 294 active listings in the ZIP; 235 units permitted in Orange County in 2024 (50 in 5+ unit buildings).
Forward outlook
- Local home prices are declining (-3.0%/yr); year-one equity from $0 of loan paydown is wiped out by about $0 of value loss. Plan a longer hold.
- Orange County population projected at +6% by 2050 — modest demand growth; plan on rents tracking national, not racing it.
- At projected returns (-3.0% appreciation + 3.0% rent growth), your $0 cash investment doubles in ~1 year — after that, you're playing with house money.
Negotiation context
- It's been on market 24 days — a 2% lower offer ($0) is reasonable based on typical stale-listing flexibility.
- 3 sale attempts; this cycle's ask has dropped $2k (100%) from the opening price — seller is motivated, your offer sets the floor, not the list.
Risks & watch-outs
- Climate carrying-cost: major flood risk; severe wind risk, 99% chance of damaging wind over 30y; extreme-heat days projected 7→23/yr by 2055 (HVAC capex compounding) — expect insurance premiums to compound above CPI over the hold.
Questions for the listing agent
- Is there a deadline driving the sale (1031 exchange, divorce, estate, relocation)? That informs how much negotiation room exists.
- Schools are D-rated, which usually means shorter tenancies and higher turnover. Who's the typical renter profile here, and what's been the actual vacancy rate?
- Crime grade is D in this area — have there been break-ins, vandalism, or insurance claims at this property in the last 3 years? What carrier currently insures it and at what premium?
- The area grade is low — what's the realistic commute time and amenity access for the typical tenant pool here? Any planned neighborhood developments (good or bad) we should know about?
- What's the average days-on-market for RENTAL listings here right now (not sales)? A rising rental-DOM trend means longer vacancies and softer asking-rent achievability than the comps imply.
- What's the recent tenant-quality profile in this submarket — average credit score on applications, eviction rate, late-payment / NSF rate, and stable-employment percentage? A property-management company in the area should have these aggregated.
- How much new for-sale + rental construction is in the pipeline within 1–3 miles? Heavy new supply typically softens prices + rents 12–24 months out; constrained supply supports both.
Investment metrics
- 1% rule
- 177754.00% ✓
- Cap rate
- 1685105.92%
- Cash-on-cash
- 6018212.95%
- DSCR
- 267777.61
- GRM
- 0.0
CMA / ARV
- ARV (median comp)
- $294,857
- List price
- $1
- Delta
- 30.57%
- Verdict
- OVERPRICED
- Comps
- 6 within 1.0 mi
Projected returns pro-forma
-3.0% appreciation · 3.0% rent growth · sell at horizon
- IRR
- —
- Equity multiple
- 319515.52×
- Total profit
- $89,464
- Equity at exit
- $0
- IRR
- —
- Equity multiple
- 689921.17×
- Total profit
- $193,178
- Equity at exit
- $0
Cash invested: $0 (down + closing). Projections, not guarantees.
Landlord ↔ Tenant lean methodology
- Overall (STATE)
- 87 Strongly Landlord-Friendly
- State Texas
- 87 Strongly Landlord-Friendly · R+5
- County
- — inherits STATE
- City
- — inherits STATE
ZIP-level market 77632
- Home prices YoY
- -31.6%
- Active inventory
- 294
Monthly cashflow live
- Estimated rent
- $1,778 medium interval (Pro) →
- Mortgage (P&I)
- −$0
- Tax est. 1.5%
- −$0 /mo · $0/yr
- Insurance
- −$0
- HOA
- −$0
- Vacancy / Maint / Mgmt
- −$373
- Net cashflow
- $1,404
Break-even live
Sensitivity live
| Price | -10% $1,404 | -5% $1,404 | +0% $1,404 | +5% $1,404 | +10% $1,404 |
|---|---|---|---|---|---|
| Rent | -10% $1,264 | -5% $1,334 | +0% $1,404 | +5% $1,474 | +10% $1,545 |
| Rate | -1.0pp $1,404 | -0.5pp $1,404 | base $1,404 | +0.5pp $1,404 | +1.0pp $1,404 |
UW: 25.0% down · 7.5% · 30yr · 1.5% tax · 5.0% vac · 8.0% maint · 8.0% mgmt
Financing live
Cash to close
- Down payment
- $0
- Closing costs
- $0
- Reserves months
- —
- Total cash needed
- —
Loan-product check · same deal, 3 products live
Conventional
25% down · 7.5% · 30yr
- Down + closing
- —
- Monthly P&I
- —
- Monthly cashflow
- —
- DSCR
- —
- Eligible?
- —
Personal DTI + credit; lowest rate.
DSCR
20% down · 8.5% · 30yr
- Down + closing
- —
- Monthly P&I
- —
- Monthly cashflow
- —
- DSCR
- —
- Eligible?
- —
No personal income docs; deal must DSCR.
Hard money
10% down · 12.0% · 12mo
- Down + closing
- —
- Monthly P&I
- —
- Monthly cashflow
- —
- DSCR
- —
- Eligible?
- —
Short-term bridge; refi at stabilization.
Listing history 22 events
-
2026-06-21remarks 699-char remark
-
2026-06-21days on market $1 Active 24 DOM
-
2026-06-18days on market $1 Active 21 DOM
-
2026-06-17days on market $1 Active 20 DOM
-
2026-06-16days on market $1 Active 19 DOM
-
2026-06-15days on market $1 Active 18 DOM
-
2026-06-14days on market $1 Active 16 DOM
-
2026-06-13days on market $1 Active 15 DOM
-
2026-06-10days on market $1 Active 13 DOM
-
2026-06-09days on market $1 Active 12 DOM
-
2026-06-08days on market $1 Active 11 DOM
-
2026-06-07days on market $1 Active 10 DOM
-
2026-06-03days on market $1 Active 6 DOM
-
2026-06-02days on market $1 Active 5 DOM
-
2026-06-01days on market $1 Active 4 DOM
-
2026-05-31days on market $1 Active 3 DOM
-
2026-05-30days on market $1 Active 2 DOM
-
2026-05-16historical
-
2026-04-23price $385,000
-
2026-04-07$395,000 Active
-
2010-10-04soldstatus
-
2008-06-09soldstatus
ⓘ Source: listings_history table (triggers on properties + properties_extension) + one-shot
backfill from property_details.listing_events for pre-trigger history.
Climate risk First Street
- Flood 6/10 Major FEMA zone X (unshaded) · 74% chance over 30 yrs
- Wildfire 3/10 Moderate
- Heat 9/10 Extreme 7 d/yr ≥108°F today · 23 d/yr by 30 yrs out
- Wind 9/10 Extreme 99% chance of damaging wind over 30 yrs
- Air quality 2/10 Low 1 unhealthy d/yr today · 1 by 30 yrs out
Nearby sold comps map
Loading sold comps map…
Walkable amenities ~0.75 mi
Loading nearby amenities…
Taxation est. · year 1
- Rental income
- $21,330
- − Mortgage interest
- −$0
- − Property taxes
- −$0
- − Insurance
- −$0
- − Repairs & maintenance
- −$1,706
- − Management
- −$1,706
- − Depreciation
- −$0
- Taxable income
- $17,917
- Est. tax owed @ 24.0%
- −$4,300
- After-tax cash flow
- $12,551/yr
For passive investors: Depreciation is non-cash, so a rental often shows a tax loss while cash-flowing — sheltering income. Rental losses are passive: they offset passive income freely, and up to $25,000/yr can offset ordinary (W-2) income if you actively participate and your MAGI is under $100k (phasing out to $0 by $150k); unused losses carry forward. On sale, claimed depreciation is recaptured at up to 25%, and gains may owe capital-gains tax (a 1031 exchange can defer both). Figures are a year-1 estimate at your 24.0% rate — not tax advice; consult a CPA.
Schools (NCES district)
- District
- West Orange-Cove CISD
- NCES district ID
- 4845090
- Math proficiency
- 17% ▼ -7.00%
- Reading proficiency
- 21% ▼ -2.00%
- Median HH income
- $37,329
- Composite
- 15.86/100
- National rank
- #9260
- State rank
- #784 of 826 in TX
Livability — Orange
- Score
- 71/100
- State rank
- #286
- US rank
- #6456
Category grades
Schools grade is shown separately in the Schools card above.
Census & demographics
- Census place
- Orange, TX
- County
- Orange County · 87,112 people
- City population
- 22,976
- Metro
- Beaumont-Port Arthur, TX
- Population (ZIP)
- 22,976
- Household income
- $74,418
- Rent vs Own
- Severe rent burden
- 431.0
Population outlook (Orange County) Hauer SSP2
- Today (2025)
- 88,065 people
- By 2030
- 89,591 · +1.7%
- By 2040
- 91,982 · +4.4%
- By 2050
- 93,023 · +5.6%
- By 2075
- 94,871 · +7.7%
- By 2100
- 88,155 · +0.1%
Race, ethnicity, and origin ACS 2023
- Neighborhood character
- Predominantly White (85%)
- Race & ethnicity
- White 85% Hispanic / Latino 8% Two or more races 6% Black 4%
- Hispanic origin (detail)
- Mexican 6%
- Common ancestry
- Lithuanian 8% Slovak 2% Italian 2%
- Foreign-born
- 2% · Canada
- Languages at home
- 95% English-only · Spanish 4%
Political lean MEDSL · Orange
- 2024 margin
- Solid R (+66.8) · D 16.4% · R 83.1%
- 2008→2024 swing
- -19.6pp toward R · 2008: -47.1pp · 2024: -66.8pp
- All cycles
- 2024: R+66.8 2020: R+63.4 2016: R+61.9 2012: R+54.3 2008: R+47.1
Not yet ingested
- Civics
- —
Market trends
- HPI YoY
- ▼ -68.96%
- Current HPI
- 149.354
- Rent YoY
- —
- Metro
- Beaumont-Port Arthur, TX
- State GDP YoY
- ▲ 3.95%
- F500 in state
- 110
Industry mix (Fortune 500 HQ in TX)
| Industry | F500 HQs | Revenue |
|---|---|---|
| Energy | 16 | $1,198B |
|
||
| Technology | 5 | $198B |
|
||
| Engineering / Construction | 4 | $72B |
|
||
| Energy Services | 3 | $60B |
|
||
| Utilities | 3 | $41B |
|
||
| Healthcare | 2 | $330B |
|
||
Price history
-99.4% since first listed7 events — show timeline
- 2026-06-11 Listed for Rent $2,499 HARMLS
- 2026-05-28 Listed $1 HARMLS
- 2026-05-16 Listing Removed — HARMLS
- 2026-04-23 Price Changed $385,000 HARMLS
- 2026-04-07 Listed $395,000 HARMLS
- 2010-10-04 Sold (Public Records) — Public Records
- 2008-06-09 Sold (Public Records) — Public Records
Property tax history
-0.0%/yrLatest (2025): $8,205 · -4.4% YoY. Source: county tax records.
Cash-flow waterfall
monthlySold comps — $/sqft
last 12 mo · ≤1 miLoading sold comps…