5600 Seaview Ave Unit 1 · Wildwood Crest, NJ
Flood risk 7/10 · Major
- FEMA flood zone
- AE
- Chance of flooding over 30 yrs
- 0.96%
- Est. flood insurance / yr
- $1,737 – $8,500
Fire risk 1/10 · Minimal
- Est. fire insurance / yr
- $526 – $976
Heat risk 8/10 · Major
- Hot days now (above 95°F)
- 7 days/yr
- Hot days in 30 yrs
- 18 days/yr
Wind risk 8/10 · Major
- Chance of severe wind over 30 yrs
- 80.0%
Air-quality risk 2/10 · Minimal
- Unhealthy air days now
- 1 days/yr
- Unhealthy air days in 30 yrs
- 1 days/yr
Risk factors via First Street. Map © Google.
Why this score? — see what drove the D+ grade
The composite is a weighted blend of 9 inputs, each scored 0–100. Each bar is that input's sub-score; the figure is the points it added to the 100-point composite (weight × sub-score).
- Cash flow +16.9/30.0
- ARV discount +11.9/15.0
- DSCR +5.2/10.0
- Schools +3.7/10.0
- 1% rule +3.6/10.0
- Livability +3.5/5.0
- Rent growth +2.5/5.0
- Condition / age +2.5/5.0
- Appreciation +0.0/10.0
$450,777
🖨 Deal sheet 📄 Offer letter ✓ Due diligence
Listing remarks
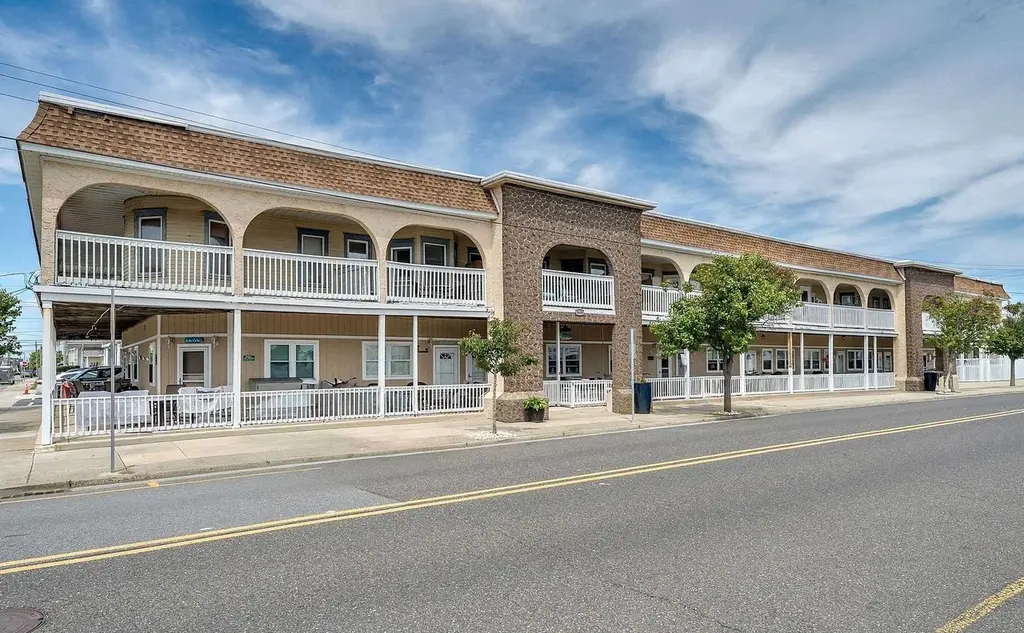
Escape to the shore at Costa De Sol, where relaxed coastal living and modern style come together in this beautifully updated 3-bedroom, 1.5-bath seasonal condo just three short blocks from the beach. Lovingly enjoyed and happily owned by the seller for nearly 30 years, this oversized unit is designed for easy seaside living, featuring a gorgeous renovated kitchen with stylish finishes, updated cabinetry, and modern appliances perfect for hosting after a day in the sand. Soak in the ocean air from the expansive wrap-around porch — the perfect place for morning coffee, sunset cocktails, or relaxing after a day by the water. Costa De Sol offers the ultimate shore experience with a long s
Key facts
- Community pool
- Renovated kitchen
- Wrap-around porch
Tags
Property features AI
Finance
- HOA & community: Condo fee of $700; Approximately 3 blocks to beach and bay
Exterior
- Parking: Parking for 2 cars
- Utilities: Public water; Public sewer; Gas hot water
- Home design: Condominium unit; First-floor entry; Unit #1
- Exterior features: Seasonal use only; Owners allowed pets; Pool (common area)
Interior
- Kitchen: Range; Oven; Microwave; Refrigerator; Dishwasher
- Bedrooms: 3 bedrooms (Unit #1, first floor)
- Bathrooms: 1 full bathroom
- Heating & cooling: Wall AC
- Interior features: Partial furniture included; Living room; Eat-in kitchen; Dining area; Florida room; 6 total rooms
- Laundry & utility: Washer; Dryer
Neighborhood map
What this means for you Summary
Snapshot
- This is a 3-bed/1.5-bath condo listed at $451k.
Deal economics
- At list price, monthly cash flow is $-132 ($-2k/yr) — negative.
- To cash-flow at today's rent, offer at most $427k (5.2% below list).
- To meet the 1% rule (rent ≥ 1% of price), the offer needs to be $387k (14.1% below list).
- Recommended offer: $387k (14.1% below list) — sets the bar for 1% rule.
- Cap rate 7.1% vs local median 2.7% in Wildwood Crest — top-decile yield for the area; either an underpriced asset or a hidden risk that comps aren't pricing in. Stress-test before assuming the spread holds.
Location & tenants
- Location reads 70/100 on livability (#257 in NJ) — a middle-class / working-renter tenant base. Strengths: health & safety A+; Watch: amenities C-, commute F, cost of living F.
- Wildwood Crest Borough School District (suburban): math 35% / reading 45% proficiency, ranked #493 of 612 in NJ (top 81%) — families likely to look elsewhere, expect single-tenant / working-renter base with shorter leases.
- Market conditions: 431 active listings in the ZIP; 2 comparable units currently listed for rent nearby; 877 units permitted in Cape May County in 2024 (35 in 5+ unit buildings).
Forward outlook
- Local home prices are declining (-3.0%/yr); year-one equity from $3k of loan paydown is wiped out by about $14k of value loss. Plan a longer hold.
- Cape May County population projected at -24% by 2050 — secular population decline; favor cash flow + early exit over multi-decade hold.
Negotiation context
- It's been on market 42 days — a 3% lower offer ($437k) is reasonable based on typical stale-listing flexibility.
- Current owner paid $33k; list at $451k implies a 1266% gain — meaningful room to come down on a strong offer.
Risks & watch-outs
- Watch-outs: flood insurance adds $427/mo; built in 1910 — expect roof / HVAC / electrical / plumbing capex.
- Climate carrying-cost: in FEMA flood zone AE (mandatory federal flood insurance); severe wind risk, 80% chance of damaging wind over 30y; extreme-heat days projected 7→18/yr by 2055 (HVAC capex compounding) — expect insurance premiums to compound above CPI over the hold.
Questions for the listing agent
- What do current leases actually rent for vs. the listed asking? Can we see a recent rent roll and the last 12 months of T-12 income?
- It's been on market 42 days. Have you received any prior offers? Is the seller open to a 14% concession, seller financing, or rate buy-down credit?
- Built in 1910 — when were the roof, HVAC, electrical panel, plumbing, and water heater last replaced?
- What's the actual annual flood-insurance premium (NFIP or private), and is the property in a SFHA with mandatory coverage?
- Any open or pending special assessments — roof, HVAC, plumbing, elevator, façade? What's the per-unit balance and payoff schedule, and is the seller paying it off at close or rolling it to the buyer?
- Is there a deadline driving the sale (1031 exchange, divorce, estate, relocation)? That informs how much negotiation room exists.
- The area grade is low — what's the realistic commute time and amenity access for the typical tenant pool here? Any planned neighborhood developments (good or bad) we should know about?
- What's the average days-on-market for RENTAL listings here right now (not sales)? A rising rental-DOM trend means longer vacancies and softer asking-rent achievability than the comps imply.
- What's the recent tenant-quality profile in this submarket — average credit score on applications, eviction rate, late-payment / NSF rate, and stable-employment percentage? A property-management company in the area should have these aggregated.
- How much new apartment / multifamily construction is in the pipeline within 1–3 miles? Heavy new supply (>2% of stock underway) typically softens rents 12–24 months out; light construction supports rent growth.
Investment metrics
- 1% rule
- 0.86% ✗
- Cap rate
- 7.08%
- Cash-on-cash
- 2.80%
- DSCR
- 1.12
- GRM
- 9.7
CMA / ARV
- ARV (median comp)
- $499,375
- List price
- $450,777
- Delta
- -9.73%
- Verdict
- FAIR
- Comps
- 20 within 1.0 mi
Projected returns pro-forma
-3.0% appreciation · 3.0% rent growth · sell at horizon
- IRR
- -18.3%
- Equity multiple
- 0.36×
- Total profit
- $-81,378
- Equity at exit
- $67,212
- IRR
- -10.6%
- Equity multiple
- 0.36×
- Total profit
- $-81,303
- Equity at exit
- $38,975
Cash invested: $126,218 (down + closing). Projections, not guarantees.
Landlord ↔ Tenant lean methodology
- Overall (STATE)
- 21 Tenant-Leaning
- State New Jersey
- 21 Tenant-Leaning · D+6
- County
- — inherits STATE
- City
- — inherits STATE
ZIP-level market 08260
- Home prices YoY
- -30.7%
- Active inventory
- 431
- Price-to-rent
- 9.7×
Monthly cashflow live
- Estimated rent
- $3,871 medium interval (Pro) →
- Mortgage (P&I)
- −$2,364
- Tax from tax record
- −$212 /mo · $2,547/yr
- Insurance
- −$188
- Flood insurance flood zone
- −$427 /mo · $5,118/yr
- HOA
- −$0
- Vacancy / Maint / Mgmt
- −$813
- Net cashflow
- $-132
Break-even live
UW: 25.0% down · 7.5% · 30yr · 1.5% tax · 5.0% vac · 8.0% maint · 8.0% mgmt
Financing live
Cash to close
- Down payment
- $112,694
- Closing costs
- $13,523
- Reserves months
- —
- Total cash needed
- —
Loan-product check · same deal, 3 products live
Conventional
25% down · 7.5% · 30yr
- Down + closing
- —
- Monthly P&I
- —
- Monthly cashflow
- —
- DSCR
- —
- Eligible?
- —
Personal DTI + credit; lowest rate.
DSCR
20% down · 8.5% · 30yr
- Down + closing
- —
- Monthly P&I
- —
- Monthly cashflow
- —
- DSCR
- —
- Eligible?
- —
No personal income docs; deal must DSCR.
Hard money
10% down · 12.0% · 12mo
- Down + closing
- —
- Monthly P&I
- —
- Monthly cashflow
- —
- DSCR
- —
- Eligible?
- —
Short-term bridge; refi at stabilization.
Rent comps 2 comps
| Address | Beds | Baths | Sqft | Rent | $/sqft | DOM | Units | Dist |
|---|---|---|---|---|---|---|---|---|
| 124 W Heather Rd Unit 1309025P Wildwood Crest, NJ | 2.0 | 1.0 | 699 | $4,563 | $6.53 | 44d | 1 | 0.31mi |
| 206 W Spencer Ave Wildwood, NJ | 2.0 | 1.0 | 750 | $2,000 | $2.67 | 44d | 1 | 0.89mi |
HOA detail condo
- Monthly dues
- $0 · $0/yr
- Likely covers
- water
- Assessments
- None detected in remarks — confirm with the listing agent.
Listing history 17 events
-
2026-06-18days on market $450,777 Active 42 DOM
-
2026-06-17days on market $450,777 Active 41 DOM
-
2026-06-16days on market $450,777 Active 40 DOM
-
2026-06-15days on market $450,777 Active 39 DOM
-
2026-06-13days on market $450,777 Active 37 DOM
-
2026-06-12days on market $450,777 Active 36 DOM
-
2026-06-09days on market $450,777 Active 33 DOM
-
2026-06-08days on market $450,777 Active 32 DOM
-
2026-06-07days on market $450,777 Active 31 DOM
-
2026-06-07days on market $450,777 Active 30 DOM
-
2026-06-04days on market $450,777 Active 27 DOM
-
2026-06-02days on market $450,777 Active 26 DOM
-
2026-06-01days on market $450,777 Active 25 DOM
-
2026-05-31days on market $450,777 Active 24 DOM
-
2026-05-07$450,777 Active 970-char remark
-
2000-07-19soldstatus $33,000
-
1998-04-27soldstatus $52,500
ⓘ Source: listings_history table (triggers on properties + properties_extension) + one-shot
backfill from property_details.listing_events for pre-trigger history.
Tax reassessment forecast NJ · Partial reset (capped growth)
- Current annual tax
- $2,547 · $212/mo
- Projected year-2 tax
- $6,886 · $574/mo
- Expected delta
- +$4,339/yr (+$362/mo · 170.4%)
ⓘ Screening estimate from a state-policy table — verify with the county assessor before closing.
Climate risk First Street
- Flood 7/10 Severe FEMA zone AE · 96% chance over 30 yrs
- Wildfire 1/10 Low
- Heat 8/10 Severe 7 d/yr ≥95°F today · 18 d/yr by 30 yrs out
- Wind 8/10 Severe 80% chance of damaging wind over 30 yrs
- Air quality 2/10 Low 1 unhealthy d/yr today · 1 by 30 yrs out
Nearby sold comps map
Loading sold comps map…
Walkable amenities ~0.75 mi
Loading nearby amenities…
Taxation est. · year 1
- Rental income
- $46,451
- − Mortgage interest
- −$25,251
- − Property taxes
- −$2,547
- − Insurance
- −$7,372
- − Repairs & maintenance
- −$3,716
- − Management
- −$3,716
- − Depreciation
- −$13,114
- Taxable loss
- −$9,264
- Est. tax savings @ 24.0%
- +$2,223
- After-tax cash flow
- $634/yr
For passive investors: Depreciation is non-cash, so a rental often shows a tax loss while cash-flowing — sheltering income. Rental losses are passive: they offset passive income freely, and up to $25,000/yr can offset ordinary (W-2) income if you actively participate and your MAGI is under $100k (phasing out to $0 by $150k); unused losses carry forward. On sale, claimed depreciation is recaptured at up to 25%, and gains may owe capital-gains tax (a 1031 exchange can defer both). Figures are a year-1 estimate at your 24.0% rate — not tax advice; consult a CPA.
Schools (NCES district)
- District
- Wildwood Crest Borough School District
- NCES district ID
- 3417970
- Math proficiency
- 35% ▬ 0.00%
- Reading proficiency
- 45% ▼ -5.00%
- Median HH income
- $55,087
- Composite
- 37.39/100
- National rank
- #8922
- State rank
- #493 of 612 in NJ
Livability — Wildwood Crest
- Score
- 70/100
- State rank
- #257
- US rank
- #7359
Category grades
Schools grade is shown separately in the Schools card above.
Census & demographics
- Census place
- Wildwood Crest, NJ
- Population (ZIP)
- 12,913
Population outlook (Cape May County) Hauer SSP2
- Today (2025)
- 88,234 people
- By 2030
- 84,144 · -4.6%
- By 2040
- 75,146 · -14.8%
- By 2050
- 67,389 · -23.6%
- By 2075
- 55,732 · -36.8%
- By 2100
- 44,972 · -49.0%
Race, ethnicity, and origin ACS 2023
- Neighborhood character
- Predominantly White (78%)
- Race & ethnicity
- White 78% Hispanic / Latino 14% Two or more races 7% Black 3% Native American 1%
- Hispanic origin (detail)
- Mexican 10% Puerto Rican 3%
- Common ancestry
- Romanian 7% Slovak 2% Lithuanian 1%
- Foreign-born
- 9% · Canada
- Languages at home
- 84% English-only · Spanish 12% Other Indo-European 3% French/Haitian/Cajun 1%
Political lean MEDSL · Cape May
- 2024 margin
- R (+19.2) · D 39.7% · R 58.9% · Other 1.4%
- 2008→2024 swing
- -10.6pp toward R · 2008: -8.7pp · 2024: -19.2pp
- All cycles
- 2024: R+19.2 2020: R+15.9 2016: R+19.9 2012: R+8.9 2008: R+8.7
Not yet ingested
- Civics
- —
Market trends
- HPI YoY
- ▼ -243.83%
- Current HPI
- 551.3393
- Rent YoY
- —
- Metro
- —
- State GDP YoY
- ▲ 2.05%
- F500 in state
- 34
Industry mix (Fortune 500 HQ in NJ)
| Industry | F500 HQs | Revenue |
|---|---|---|
| Consumer Goods | 3 | $31B |
|
||
| Pharmaceuticals | 2 | $153B |
|
||
| Technology | 2 | $21B |
|
||
| Insurance | 2 | $20B |
|
||
| Healthcare | 2 | $19B |
|
||
| Financial Services | 1 | $70B |
|
||
Price history
+758.6% since first listed3 events — show timeline
- 2026-05-07 Listed $450,777 CMCMLS
- 2000-07-19 Sold (Public Records) $33,000 Public Records
- 1998-04-27 Sold (Public Records) $52,500 Public Records
Property tax history
+2.1%/yrLatest (2025): $2,547 · +1.4% YoY. Source: county tax records.
Cash-flow waterfall
monthlySold comps — $/sqft
last 12 mo · ≤1 miLoading sold comps…