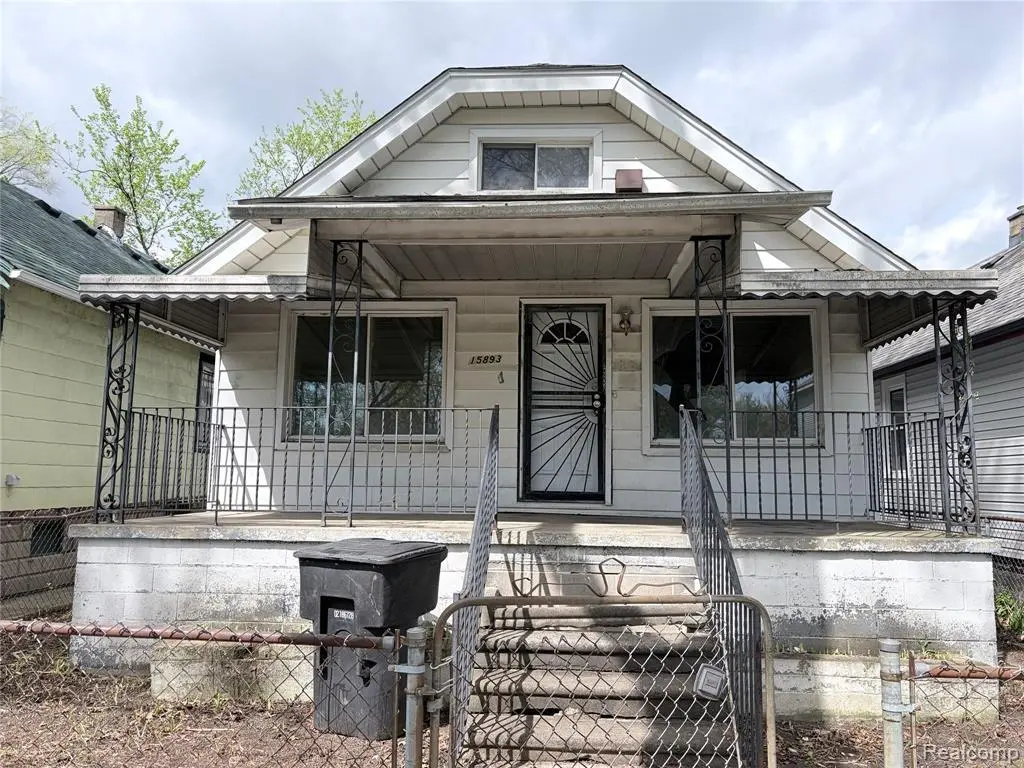
15893 Alden St · Detroit, MI
Flood risk 1/10 · Minimal
- FEMA flood zone
- X (unshaded)
- Chance of flooding over 30 yrs
- 0.0%
- Est. flood insurance / yr
- $473 – $860
Fire risk 1/10 · Minimal
- Est. fire insurance / yr
- $784 – $1,456
Heat risk 3/10 · Minor
- Hot days now (above 97°F)
- 7 days/yr
- Hot days in 30 yrs
- 14 days/yr
Wind risk 2/10 · Minimal
- Chance of severe wind over 30 yrs
- —
Air-quality risk 4/10 · Minor
- Unhealthy air days now
- 4 days/yr
- Unhealthy air days in 30 yrs
- 6 days/yr
Risk factors via First Street. Map © Google.
Why this score? — see what drove the D grade
The composite is a weighted blend of 9 inputs, each scored 0–100. Each bar is that input's sub-score; the figure is the points it added to the 100-point composite (weight × sub-score).
- Cash flow +15.0/30.0
- ARV discount +7.5/15.0
- 1% rule +5.0/10.0
- DSCR +5.0/10.0
- Rent growth +4.0/5.0
- Livability +3.7/5.0
- Condition / age +2.5/5.0
- Schools +1.3/10.0
- Appreciation +0.0/10.0
$24,000
🖨 Deal sheet (PDF) 📄 Offer letter ✓ Due diligence
Listing remarks MLS
Investor special on Detroit's west side! This 2-bedroom, 1-bath home offers solid potential for investors or buyers looking for their next rehab project. Features an unfinished attic space that may be able to be finished to create an additional bedroom or expanded living area - buyer to verify all possibilities and measurements. Property offers a functional layout, basement, and fenced yard. Great opportunity to add value and build equity at an attractive price point.
Key facts
- Fenced yard
- Functional layout
- 3,049 sq ft lot
Tags
Property features AI
Finance
- Financial info: Annual tax: $1,231
Exterior
- Parking: No garage
- Utilities: Public water; Public sewer
- Home design: Single-family residence; One level; Ground-level entry with steps
- Construction: Aluminum siding; Block foundation; Built area above grade: 836 square feet
- Exterior features: Paved road access; Lot approximately 30 x 100.1 (0.07 acres); Subdivision: FORD VIEW; Directions: South of Puritan Ave and East of Livernois; cross street Puritan Ave and Livernois
Interior
- Bedrooms: Total of 4 rooms (includes bedrooms and living areas)
- Bathrooms: 1 full bathroom; 1 half bathroom
- Heating & cooling: Forced air heating (natural gas); No air conditioning
- Interior features: Full unfinished basement
Neighborhood map
What this means for you Summary
Snapshot
- This is a 2-bed/1.0-bath single-family listed at $24k.
Deal economics
- At list price, monthly cash flow is $701 ($8k/yr) — positive.
- The deal already cash-flows at list — no discount required.
- Meets the 1% rule at list price ($1k rent vs $24k).
- Recommended offer: $24k (1.5% below list) — sets the bar for market timing.
- Cap rate 41.3% vs local median 10.0% in Detroit — top-decile yield for the area; either an underpriced asset or a hidden risk that comps aren't pricing in. Stress-test before assuming the spread holds.
Location & tenants
- Location reads 73/100 on livability (#218 in MI) — a middle-class / working-renter tenant base. Strengths: amenities A+, commute A+, cost of living A+; Watch: crime F, employment F.
- Detroit Public Schools Community District (urban): math 10% / reading 24% proficiency, ranked #499 of 540 in MI (top 92%) — low school quality limits family demand, transient renter base, plan for 1-2y turnover; 90% free/reduced lunch — lower-income household profile, screen leases tightly.
- Zoned schools: Paul Robeson Malcolm X Academy (math 10% / reading 10%, grade F, #1,230 of 1,397 statewide, top 91%, 395 students, 88% FRL); Mumford High School (math 24% / reading 24%, grade F, #481 of 713 statewide, top 81%, 889 students, 86% FRL) — zoned schools at 87% FRL track the district average.
- Market conditions: Rents rising fast (+6.1%/yr); 350 active listings in the ZIP; 40 comparable units currently listed for rent nearby; rentals at typical pace (median 27d on market — plan ~3-4 weeks tenant-placement turnaround); lower-income renter base — watch delinquency; 2,639 units permitted in Wayne County in 2024 (1,216 in 5+ unit buildings).
- This rent runs 40% of the median local income ($33k/yr) — at the standard rent-burdened threshold; future hikes will face affordability resistance.
Forward outlook
- Local home prices are declining (-3.0%/yr); year-one equity from $166 of loan paydown is wiped out by about $720 of value loss. Plan a longer hold.
- Wayne County population projected at -17% by 2050 — secular population decline; favor cash flow + early exit over multi-decade hold.
- At projected returns (-3.0% appreciation + 6.1% rent growth), your $7k cash investment doubles in ~1 year — after that, you're playing with house money.
Negotiation context
- It's been on market 19 days — a 2% lower offer ($24k) is reasonable based on typical stale-listing flexibility.
- 2 sale attempts with the ask held roughly flat each time — persistent listings suggest the price (not the market) is what's stuck; bring a comps-based counter.
Risks & watch-outs
- Watch-outs: built in 1921 — expect roof / HVAC / electrical / plumbing capex.
Questions for the listing agent
- Built in 1921 — when were the roof, HVAC, electrical panel, plumbing, and water heater last replaced?
- Is there a deadline driving the sale (1031 exchange, divorce, estate, relocation)? That informs how much negotiation room exists.
- Schools are F-rated, which usually means shorter tenancies and higher turnover. Who's the typical renter profile here, and what's been the actual vacancy rate?
- Crime grade is F in this area — have there been break-ins, vandalism, or insurance claims at this property in the last 3 years? What carrier currently insures it and at what premium?
- The area grade is low — what's the realistic commute time and amenity access for the typical tenant pool here? Any planned neighborhood developments (good or bad) we should know about?
- What's the average days-on-market for RENTAL listings here right now (not sales)? A rising rental-DOM trend means longer vacancies and softer asking-rent achievability than the comps imply.
- What's the recent tenant-quality profile in this submarket — average credit score on applications, eviction rate, late-payment / NSF rate, and stable-employment percentage? A property-management company in the area should have these aggregated.
- How much new for-sale + rental construction is in the pipeline within 1–3 miles? Heavy new supply typically softens prices + rents 12–24 months out; constrained supply supports both.
Investment metrics
- 1% rule
- 4.57% ✓
- Cap rate
- 41.35%
- Cash-on-cash
- 125.19%
- DSCR
- 6.57
- GRM
- 1.8
CMA / ARV
- ARV (median comp)
- $53,200
- List price
- $24,000
- Delta
- -54.89%
- Verdict
- UNDERPRICED
- Comps
- 20 within 1.0 mi
Show comp detail 12 sales within ~0.75 mi
| Address | Dist | Beds/Ba | Sqft | Sold | Price | $/sf | Match |
|---|---|---|---|---|---|---|---|
| 15893 Alden St | 0.00mi | 2/1.5 | 836 (0%) | 1mo | $24,000 | $29 | 97 |
| 15798 Muirland St | 0.16mi | 2/1.0 | 943 (+13%) | 1mo | $29,000 | $31 | 70 |
| 15721 Log Cabin St | 0.48mi | 2/1.0 | 844 (+1%) | 11mo | $23,000 | $27 | 67 |
| 6362 Globe St | 0.58mi | 2/1.0 | 888 (+6%) | 0mo | $15,000 | $17 | 62 |
| 15488 Wildemere St | 0.24mi | 3/1.0 (+1) | 949 (+14%) | 1mo | $49,900 | $53 | 60 |
| 16200 Lawton St | 0.17mi | 3/1.0 (+1) | 956 (+14%) | 4mo | $56,500 | $59 | 60 |
| 15865 Princeton St | 0.10mi | 2/1.0 | 714 (-15%) | 16mo | $59,000 | $83 | 57 |
| 1952 Louise St | 0.60mi | 3/1.0 (+1) | 882 (+6%) | 2mo | $33,000 | $37 | 56 |
| 16230 Santa Rosa Dr | 0.62mi | 2/1.0 | 895 (+7%) | 10mo | $120,000 | $134 | 50 |
| 14890 Holmur St | 0.69mi | 2/1.0 | 779 (-7%) | 10mo | $40,598 | $52 | 48 |
| 1983 Brighton St | 0.63mi | 3/1.0 (+1) | 921 (+10%) | 5mo | $40,000 | $43 | 45 |
| 1931 Pilgrim St | 0.63mi | 3/1.0 (+1) | 931 (+11%) | 13mo | $65,000 | $70 | 36 |
Match score weights: distance 35% · size 25% · config 20% · recency 20%. Top-matched comps best support the ARV.
Projected returns pro-forma
-3.0% appreciation · 6.14% rent growth · sell at horizon
- IRR
- —
- Equity multiple
- 7.60×
- Total profit
- $44,354
- Equity at exit
- $3,578
- IRR
- —
- Equity multiple
- 17.64×
- Total profit
- $111,837
- Equity at exit
- $2,075
Cash invested: $6,720 (down + closing). Projections, not guarantees.
Landlord ↔ Tenant lean methodology
- Overall (STATE)
- 62 Landlord-Friendly
- State Michigan
- 62 Landlord-Friendly · EVEN
- County
- — inherits STATE
- City
- — inherits STATE
ZIP-level market 48238
- Home prices YoY
- -14.4%
- Rents YoY
- 6.1%
- Active inventory
- 350
- Price-to-rent
- 1.8×
Monthly cashflow live
- Estimated rent
- $1,097 high interval (Pro) →
- Mortgage (P&I)
- −$126
- Tax est. 1.5%
- −$30 /mo · $360/yr
- Insurance
- −$10
- HOA
- −$0
- Vacancy / Maint / Mgmt
- −$230
- Net cashflow
- $701
Break-even live
Sensitivity live
| Price | -10% $718 | -5% $709 | +0% $701 | +5% $693 | +10% $684 |
|---|---|---|---|---|---|
| Rent | -10% $614 | -5% $658 | +0% $701 | +5% $744 | +10% $788 |
| Rate | -1.0pp $713 | -0.5pp $707 | base $701 | +0.5pp $695 | +1.0pp $689 |
UW: 25.0% down · 7.5% · 30yr · 1.5% tax · 5.0% vac · 8.0% maint · 8.0% mgmt
Financing live
Cash to close
- Down payment
- $6,000
- Closing costs
- $720
- Reserves months
- —
- Total cash needed
- —
Loan-product check · same deal, 3 products live
Conventional
25% down · 7.5% · 30yr
- Down + closing
- —
- Monthly P&I
- —
- Monthly cashflow
- —
- DSCR
- —
- Eligible?
- —
Personal DTI + credit; lowest rate.
DSCR
20% down · 8.5% · 30yr
- Down + closing
- —
- Monthly P&I
- —
- Monthly cashflow
- —
- DSCR
- —
- Eligible?
- —
No personal income docs; deal must DSCR.
Hard money
10% down · 12.0% · 12mo
- Down + closing
- —
- Monthly P&I
- —
- Monthly cashflow
- —
- DSCR
- —
- Eligible?
- —
Short-term bridge; refi at stabilization.
Rent comps 40 comps
| Address | Beds | Baths | Sqft | Rent | $/sqft | DOM | Units | Dist |
|---|---|---|---|---|---|---|---|---|
| 15906 Alden St Detroit, MI | 3.0 | 1.0 | 1030 | $1,150 | $1.12 | 19d | 1 | 0.04mi |
| 16174 Princeton St Unit 2 Detroit, MI | 2.0 | 1.0 | 985 | $1,100 | $1.12 | 46d | 1 | 0.20mi |
| 16174 Princeton St Detroit, MI | 2.0 | 1.0 | 985 | $1,100 | $1.12 | 21d | 1 | 0.20mi |
| 2623 W McNichols Rd Unit 23106 Detroit, MI | 1.0 | 1.0 | 750 | $1,075 | $1.43 | 46d | 1 | 0.57mi |
| 16927 Inverness St Detroit, MI | 2.0 | 1.0 | 897 | $1,650 | $1.84 | 19d | 1 | 0.67mi |
| 7350 Globe St Detroit, MI | 3.0 | 1.0 | 1000 | $1,550 | $1.55 | 5d | 1 | 0.71mi |
| 14950 Stoepel St Detroit, MI | 2.0 | 1.0 | 600 | $900 | $1.50 | 26d | 1 | 0.80mi |
| 17215 Warrington Dr Detroit, MI | 2.0 | 1.0 | 1015 | $2,000 | $1.97 | 46d | 1 | 0.82mi |
| 17150 Santa Rosa Dr Detroit, MI | 1.0 | 1.0 | 950 | $1,250 | $1.32 | 19d | 1 | 0.86mi |
| 1705 Oakman Blvd Unit 8 Detroit, MI | 1.0 | 1.0 | 650 | $950 | $1.46 | 0d | 1 | 0.87mi |
| 1705 Oakman Blvd Unit 10 Detroit, MI | 1.0 | 1.0 | 650 | $895 | $1.38 | 26d | 1 | 0.87mi |
| 1705 Oakman Blvd Unit 5 Detroit, MI | 1.0 | 1.0 | 650 | $895 | $1.38 | 46d | 1 | 0.87mi |
| 17145 Santa Rosa Dr Unit 1 Detroit, MI | 3.0 | 1.0 | 1050 | $1,400 | $1.33 | 20d | 1 | 0.88mi |
| 1875 Ewald Cir Unit 2E Detroit, MI | 1.0 | 1.0 | 725 | $875 | $1.21 | 7d | 1 | 0.91mi |
| 15771 Turner St Detroit, MI | 2.0 | 1.0 | 1000 | $1,049 | $1.05 | 46d | 1 | 0.92mi |
| 17147 Monica St Unit 2 1 Detroit, MI | 2.0 | 1.0 | 900 | $975 | $1.08 | 26d | 1 | 0.92mi |
| 16722 Tuller St Detroit, MI | 3.0 | 1.5 | 1100 | $1,500 | $1.36 | 19d | 1 | 0.97mi |
| 2034 Ewald Cir Detroit, MI | 2.0 | 1.0 | 1000 | $995 | $0.99 | 7d | 1 | 0.97mi |
| 941 Merton Rd Highland Park, MI | 2.0 | 1.0 | 850 | $1,000 | $1.18 | 46d | 1 | 1.02mi |
| 2433 Pasadena St Unit 2435 Detroit, MI | 2.0 | 1.0 | 700 | $1,025 | $1.46 | 46d | 1 | 1.03mi |
| 17449 Manderson Rd Unit 13 Detroit, MI | 1.0 | 1.0 | 700 | $1,010 | $1.44 | 0d | 1 | 1.03mi |
| 17449 Manderson Rd Unit 8 Detroit, MI | 1.0 | 1.0 | 700 | $950 | $1.36 | 22d | 1 | 1.03mi |
| 17449 Manderson Rd Unit 3 Detroit, MI | 1.0 | 1.0 | 700 | $950 | $1.36 | 5d | 1 | 1.03mi |
| 17449 Manderson Rd Unit 3 Detroit, MI | 1.0 | 1.0 | 700 | $1,015 | $1.45 | 26d | 1 | 1.03mi |
| 17449 Manderson Rd Unit 1 Detroit, MI | 2.0 | 1.0 | 750 | $1,150 | $1.53 | 26d | 1 | 1.03mi |
| 17449 Manderson Rd Unit 16 Detroit, MI | 1.0 | 1.0 | 700 | $950 | $1.36 | 26d | 1 | 1.03mi |
| 17461 Manderson Rd Unit 5 Detroit, MI | 1.0 | 1.0 | 700 | $1,015 | $1.45 | 24d | 1 | 1.03mi |
| 17497 Manderson Rd Unit 18A Detroit, MI | 1.0 | 1.0 | 700 | $91,015 | $130.02 | 24d | 1 | 1.04mi |
| 17497 Manderson Rd Unit 17 Detroit, MI | 1.0 | 1.0 | 700 | $1,015 | $1.45 | 24d | 1 | 1.04mi |
| 17497 Manderson Rd Unit 17A Detroit, MI | 1.0 | 1.0 | 700 | $1,015 | $1.45 | 26d | 1 | 1.04mi |
| 3808 Kendall St Unit 3 Detroit, MI | 1.0 | 1.0 | 550 | $700 | $1.27 | 46d | 1 | 1.06mi |
| 17551 Santa Rosa Dr Detroit, MI | 2.0 | 1.0 | 1036 | $1,095 | $1.06 | 46d | 1 | 1.08mi |
| 13639 La Salle Blvd Detroit, MI | 1.0 | 1.0 | 800 | $775 | $0.97 | 46d | 1 | 1.08mi |
| 13639 La Salle Blvd Detroit, MI | 2.0 | 1.0 | 800 | $695 | $0.87 | 13d | 1 | 1.08mi |
| 13641 La Salle Blvd Detroit, MI | 1.0 | 1.0 | 800 | $775 | $0.97 | 26d | 1 | 1.08mi |
| 3266 Pasadena St Unit 3 Detroit, MI | 1.0 | 1.0 | 696 | $700 | $1.01 | 46d | 1 | 1.10mi |
| 17701 Manderson Rd Unit 202 Highland Park, MI | 1.0 | 1.0 | 750 | $900 | $1.20 | 46d | 1 | 1.11mi |
| 17701 Manderson Rd Apt 203 Highland Park, MI | 1.0 | 1.0 | 750 | $900 | $1.20 | 0d | 1 | 1.11mi |
| 17701 Manderson Rd Unit 104 Highland Park, MI | 1.0 | 1.0 | 750 | $950 | $1.27 | 46d | 1 | 1.11mi |
| 17701 MANDERSON Detroit, MI | 1.0 | 1.0 | 750 | $925 | $1.23 | 19d | 9 | 1.11mi |
Listing history 2 events
-
2026-05-08$24,000 Active 482-char remark
Show marketing remark (472 chars)
Investor special on Detroit's west side! This 2-bedroom, 1-bath home offers solid potential for investors or buyers looking for their next rehab project. Features an unfinished attic space that may be able to be finished to create an additional bedroom or expanded living area - buyer to verify all possibilities and measurements. Property offers a functional layout, basement, and fenced yard. Great opportunity to add value and build equity at an attractive price point.
-
2026-05-08$24,000 Active 472-char remark
Show marketing remark (472 chars)
Investor special on Detroit's west side! This 2-bedroom, 1-bath home offers solid potential for investors or buyers looking for their next rehab project. Features an unfinished attic space that may be able to be finished to create an additional bedroom or expanded living area - buyer to verify all possibilities and measurements. Property offers a functional layout, basement, and fenced yard. Great opportunity to add value and build equity at an attractive price point.
ⓘ Source: listings_history table (triggers on properties + properties_extension) + one-shot
backfill from property_details.listing_events for pre-trigger history.
Climate risk First Street
- Flood 1/10 Low FEMA zone X (unshaded) · 0% chance over 30 yrs
- Wildfire 1/10 Low
- Heat 3/10 Moderate 7 d/yr ≥97°F today · 14 d/yr by 30 yrs out
- Wind 2/10 Low
- Air quality 4/10 Moderate 4 unhealthy d/yr today · 6 by 30 yrs out
Nearby sold comps map
Loading sold comps map…
Walkable amenities ~0.75 mi
Loading nearby amenities…
Taxation est. · year 1
- Rental income
- $13,168
- − Mortgage interest
- −$1,344
- − Property taxes
- −$360
- − Insurance
- −$120
- − Repairs & maintenance
- −$1,053
- − Management
- −$1,053
- − Depreciation
- −$698
- Taxable income
- $8,539
- Est. tax owed @ 24.0%
- −$2,049
- After-tax cash flow
- $6,363/yr
For passive investors: Depreciation is non-cash, so a rental often shows a tax loss while cash-flowing — sheltering income. Rental losses are passive: they offset passive income freely, and up to $25,000/yr can offset ordinary (W-2) income if you actively participate and your MAGI is under $100k (phasing out to $0 by $150k); unused losses carry forward. On sale, claimed depreciation is recaptured at up to 25%, and gains may owe capital-gains tax (a 1031 exchange can defer both). Figures are a year-1 estimate at your 24.0% rate — not tax advice; consult a CPA.
Schools (NCES district)
- District
- Detroit Public Schools Community District
- NCES district ID
- 2601103
- Math proficiency
- 10% ▼ -2.00%
- Reading proficiency
- 24% ▲ 6.00%
- Median HH income
- $25,815
- Composite
- 13.06/100
- National rank
- #9564
- State rank
- #499 of 540 in MI
Livability — Detroit
- Score
- 73/100
- State rank
- #218
- US rank
- #5427
Category grades
Schools grade is shown separately in the Schools card above.
Census & demographics
- Census place
- Detroit, MI
- County
- Wayne County · 1,562,939 people
- City population
- 572,865
- Metro
- Detroit-Warren-Dearborn, MI
- Population (ZIP)
- 24,731
- Household income
- $33,315
- Rent vs Own
- Severe rent burden
- 2172.0
Population outlook (Wayne County) Hauer SSP2
- Today (2025)
- 1,675,273 people
- By 2030
- 1,620,300 · -3.3%
- By 2040
- 1,502,341 · -10.3%
- By 2050
- 1,384,039 · -17.4%
- By 2075
- 1,124,592 · -32.9%
- By 2100
- 881,193 · -47.4%
Race, ethnicity, and origin ACS 2023
- Neighborhood character
- Predominantly Black (94%)
- Race & ethnicity
- Black 94% Two or more races 3% White 1%
- Foreign-born
- 1%
Political lean MEDSL · Wayne
- 2024 margin
- Strong D (+29.0) · D 62.7% · R 33.7% · Other 3.6%
- 2008→2024 swing
- -20.5pp toward R · 2008: 49.5pp · 2024: 29.0pp
- All cycles
- 2024: D+29.0 2020: D+38.1 2016: D+37.3 2012: D+46.9 2008: D+49.5
Not yet ingested
- Civics
- —
Market trends
- HPI YoY
- ▼ -31.96%
- Current HPI
- 189.6227
- Rent YoY
- ▲ 6.14%
- Metro
- Detroit-Warren-Dearborn, MI
- State GDP YoY
- ▲ 1.37%
- F500 in state
- 28
Industry mix (Fortune 500 HQ in MI)
| Industry | F500 HQs | Revenue |
|---|---|---|
| Automotive Parts | 3 | $48B |
|
||
| Automotive | 2 | $372B |
|
||
| Chemicals | 1 | $45B |
|
||
| Automotive Retail | 1 | $29B |
|
||
| Healthcare / Medical Devices | 1 | $23B |
|
||
| Automotive Technology | 1 | $20B |
|
||
Price history
+0.0% since first listed6 events — show timeline
- 2026-05-29 Sold (MLS) $24,000 MiRealSource-MiMLS
- 2026-05-29 Sold (MLS) $24,000 REALCOMP
- 2026-05-27 Pending — MiRealSource-MiMLS
- 2026-05-27 Pending — REALCOMP
- 2026-05-08 Listed $24,000 MiRealSource-MiMLS
- 2026-05-08 Listed $24,000 REALCOMP
Property tax history
+23.6%/yrLatest (2025): $2,473 · +0.9% YoY. Source: county tax records.
Cash-flow waterfall
monthlySold comps — $/sqft
last 12 mo · ≤1 miLoading sold comps…