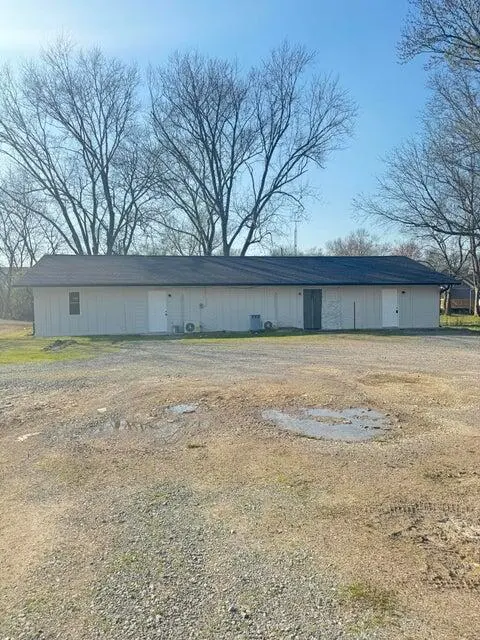
 Fourplex
1514 Aurora Ave SE · Cleveland, TN
Flood risk 6/10 · Moderate
- FEMA flood zone
- X (unshaded)
- Chance of flooding over 30 yrs
- 0.67%
- Est. flood insurance / yr
- $507 – $1,088
Fire risk 3/10 · Minor
- Est. fire insurance / yr
- $949 – $1,763
Heat risk 6/10 · Moderate
- Hot days now (above 104°F)
- 7 days/yr
- Hot days in 30 yrs
- 19 days/yr
Wind risk 3/10 · Minor
- Chance of severe wind over 30 yrs
- 6.0%
Air-quality risk 3/10 · Minor
- Unhealthy air days now
- 2 days/yr
- Unhealthy air days in 30 yrs
- 2 days/yr
Risk factors via First Street. Map © Google.
Why this score? — see what drove the B- grade
The composite is a weighted blend of 9 inputs, each scored 0–100. Each bar is that input's sub-score; the figure is the points it added to the 100-point composite (weight × sub-score).
- Cash flow +29.7/30.0
- DSCR +10.0/10.0
- ARV discount +7.5/15.0
- 1% rule +7.4/10.0
- Livability +3.5/5.0
- Rent growth +3.2/5.0
- Condition / age +2.5/5.0
- Schools +2.1/10.0
- Appreciation +0.0/10.0
$329,000
🖨 Deal sheet 📄 Offer letter ✓ Due diligence
Multi-family units
County records classify this as Multi-Family (2-4 Unit). Listing-text estimate: 4 units. confirmed
Listing remarks MLS
This renovated quadplex offers four 1-bedroom, 1-bathroom units, each thoughtfully updated for modern living. Recent improvements include a brand-new roof, new mini-split systems for efficient heating and cooling, updated cabinets, and washer/dryer hookups in every unit—an attractive feature for tenants seeking convenience. With strong rental potential and low-maintenance upgrades already in place, this property is ideal for investors looking for a turnkey opportunity.
Key facts
- Renovated quadplex
- Updated cabinets
- Brand new roof
Tags
Property features AI
Exterior
- Parking: Gravel parking
- Utilities: Public water; Public sewer; Electricity connected; Water connected; Sewer connected
- Home design: Residential income property (quadruplex); One story; Updated/remodeled
- Construction: Block construction; Slab foundation; Shingle roof; Built as a quadruplex
- Exterior features: Rain gutters; Level lot; City street frontage
Interior
- Kitchen: Refrigerator; Microwave; Electric range; Electric water heater
- Flooring: Vinyl
- Bathrooms: 4 full bathrooms
- Heating & cooling: Ductless heating; Ductless cooling
- Interior features: Open floorplan
- Laundry & utility: Laundry on main level
Neighborhood map
What this means for you Summary
Snapshot
- This is a 4 × 1-bed/1-bath units multifamily listed at $329k.
Deal economics
- At list price, monthly cash flow is $1k ($14k/yr) — positive. Per door: $299/mo.
- The deal already cash-flows at list — no discount required.
- Meets the 1% rule at list price ($4k rent vs $329k).
- Recommended offer: $309k (6.0% below list) — sets the bar for market timing.
- Cap rate 10.6% vs local median 3.5% in Cleveland — top-decile yield for the area; either an underpriced asset or a hidden risk that comps aren't pricing in. Stress-test before assuming the spread holds.
Location & tenants
- Location reads 70/100 on livability (#55 in TN) — a middle-class / working-renter tenant base. Strengths: cost of living A+, health & safety A+, housing A; Watch: employment D, crime F, amenities F.
- Cleveland (urban): math 23% / reading 28% proficiency, ranked #85 of 139 in TN (top 61%) — low school quality limits family demand, transient renter base, plan for 1-2y turnover.
- Zoned schools: Blythe-Bower Elementary (math 16% / reading 20%, grade F, #697 of 952 statewide, top 74%, 636 students, 0% FRL); Cleveland Middle (math 25% / reading 26%, grade F, #147 of 333 statewide, top 45%, 1,271 students, 0% FRL); Cleveland High (math 8% / reading 29%, grade F, #208 of 332 statewide, top 63%, 1,842 students, 0% FRL) — zoned schools average 0% FRL vs 53% district-wide (53 pts lower); this property's tenant base skews higher-income than the district average.
- Market conditions: Rents rising (+3.0%/yr); 196 active listings in the ZIP; 768 units permitted in Bradley County in 2024 (0 in 5+ unit buildings).
- At $4,072/mo this rent would consume 104% of the median local household income ($47k/yr) (locally 1184% of renters already pay >50% of income on rent) — very limited rent-growth headroom before tenants either downsize or default.
Forward outlook
- Local home prices are declining (-3.0%/yr); year-one equity from $2k of loan paydown is wiped out by about $10k of value loss. Plan a longer hold.
- Bradley County population projected at +21% by 2050 — long-run rental-demand tailwind backs the buy-and-hold thesis.
- At projected returns (-3.0% appreciation + 3.0% rent growth), your $92k cash investment doubles in ~8 years — after that, you're playing with house money.
Negotiation context
- It's been on market 67 days — a 6% lower offer ($309k) is reasonable based on typical stale-listing flexibility.
- 3 sale attempts with the ask held roughly flat each time — persistent listings suggest the price (not the market) is what's stuck; bring a comps-based counter.
- Current owner paid $170k; list at $329k implies a 94% gain — meaningful room to come down on a strong offer.
Risks & watch-outs
- Climate carrying-cost: major flood risk; extreme-heat days projected 7→19/yr by 2055 (HVAC capex compounding) — expect insurance premiums to compound above CPI over the hold.
Questions for the listing agent
- It's been on market 67 days. Have you received any prior offers? Is the seller open to a 6% concession, seller financing, or rate buy-down credit?
- Can we see the unit-by-unit rent roll, current vacancy, and any below-market leases? What's the average tenancy length?
- What capital expenditures (roof, boiler, parking lot, exteriors) have been made in the last 5 years, and what's planned in the next 2?
- Built in 1978 — when were the roof, HVAC, electrical panel, plumbing, and water heater last replaced?
- Why hasn't it sold? Are there any deal-killer items the seller is aware of (foundation, flood, title, zoning, code violations)?
- Is there a deadline driving the sale (1031 exchange, divorce, estate, relocation)? That informs how much negotiation room exists.
- Schools are D-rated, which usually means shorter tenancies and higher turnover. Who's the typical renter profile here, and what's been the actual vacancy rate?
- Crime grade is F in this area — have there been break-ins, vandalism, or insurance claims at this property in the last 3 years? What carrier currently insures it and at what premium?
- What's the average days-on-market for RENTAL listings here right now (not sales)? A rising rental-DOM trend means longer vacancies and softer asking-rent achievability than the comps imply.
- What's the recent tenant-quality profile in this submarket — average credit score on applications, eviction rate, late-payment / NSF rate, and stable-employment percentage? A property-management company in the area should have these aggregated.
- How much new apartment / multifamily construction is in the pipeline within 1–3 miles? Heavy new supply (>2% of stock underway) typically softens rents 12–24 months out; light construction supports rent growth.
Investment metrics
- 1% rule
- 1.24% ✓
- Cap rate
- 10.65%
- Cash-on-cash
- 15.56%
- DSCR
- 1.69
- GRM
- 6.7
CMA / ARV
No comps found within radius.
Projected returns pro-forma
-3.0% appreciation · 2.95% rent growth · sell at horizon
- IRR
- 6.3%
- Equity multiple
- 1.24×
- Total profit
- $22,452
- Equity at exit
- $49,055
- IRR
- 15.6%
- Equity multiple
- 2.26×
- Total profit
- $116,276
- Equity at exit
- $28,446
Cash invested: $92,120 (down + closing). Projections, not guarantees.
Landlord ↔ Tenant lean methodology
- Overall (STATE)
- 87 Strongly Landlord-Friendly
- State Tennessee
- 87 Strongly Landlord-Friendly · R+13
- County
- — inherits STATE
- City
- — inherits STATE
ZIP-level market 37311
- Home prices YoY
- -25.4%
- Rents YoY
- 3.0%
- Active inventory
- 196
- Price-to-rent
- 26.9×
Monthly cashflow live
- Estimated rent
- $4,072 medium interval (Pro) →
- Mortgage (P&I)
- −$1,725
- Tax from tax record
- −$160 /mo · $1,923/yr
- Insurance
- −$137
- HOA
- −$0
- Vacancy / Maint / Mgmt
- −$855
- Net cashflow
- $1,194
Break-even live
4-unit breakdown (identical units grouped — click to expand)
| Units | Beds | Baths | Est. rent |
|---|---|---|---|
| 4× units | 1 | 1 | $4,072 |
| #1 | 1 | 1 | $1,018 |
| #2 | 1 | 1 | $1,018 |
| #3 | 1 | 1 | $1,018 |
| #4 | 1 | 1 | $1,018 |
| Total (4 units) | $4,072 | ||
UW: 25.0% down · 7.5% · 30yr · 1.5% tax · 5.0% vac · 8.0% maint · 8.0% mgmt
Financing live
Cash to close
- Down payment
- $82,250
- Closing costs
- $9,870
- Reserves months
- —
- Total cash needed
- —
Loan-product check · same deal, 3 products live
Conventional
25% down · 7.5% · 30yr
- Down + closing
- —
- Monthly P&I
- —
- Monthly cashflow
- —
- DSCR
- —
- Eligible?
- —
Personal DTI + credit; lowest rate.
DSCR
20% down · 8.5% · 30yr
- Down + closing
- —
- Monthly P&I
- —
- Monthly cashflow
- —
- DSCR
- —
- Eligible?
- —
No personal income docs; deal must DSCR.
Hard money
10% down · 12.0% · 12mo
- Down + closing
- —
- Monthly P&I
- —
- Monthly cashflow
- —
- DSCR
- —
- Eligible?
- —
Short-term bridge; refi at stabilization.
Listing history 23 events
-
2026-06-19days on market $329,000 Active 67 DOM
-
2026-06-18days on market $329,000 Active 66 DOM
-
2026-06-17days on market $329,000 Active 65 DOM
-
2026-06-16days on market $329,000 Active 64 DOM
-
2026-06-15days on market $329,000 Active 63 DOM
-
2026-06-14days on market $329,000 Active 61 DOM
-
2026-06-13days on market $329,000 Active 60 DOM
-
2026-06-10days on market $329,000 Active 58 DOM
-
2026-06-09days on market $329,000 Active 57 DOM
-
2026-06-08days on market $329,000 Active 56 DOM
-
2026-06-07days on market $329,000 Active 55 DOM
-
2026-06-05days on market $329,000 Active 52 DOM
-
2026-06-03days on market $329,000 Active 51 DOM
-
2026-06-02days on market $329,000 Active 50 DOM
-
2026-06-01days on market $329,000 Active 49 DOM
-
2026-05-31days on market $329,000 Active 48 DOM
-
2026-05-30days on market $329,000 Active 47 DOM
-
2026-04-13$329,000 Active 479-char remark
Show marketing remark (479 chars)
This renovated quadplex offers four 1-bedroom, 1-bathroom units, each thoughtfully updated for modern living. Recent improvements include a brand-new roof, new mini-split systems for efficient heating and cooling, updated cabinets, and washer/dryer hookups in every unit—an attractive feature for tenants seeking convenience. With strong rental potential and low-maintenance upgrades already in place, this property is ideal for investors looking for a turnkey opportunity.
-
2026-04-13$329,000 Active
Show marketing remark (479 chars)
This renovated quadplex offers four 1-bedroom, 1-bathroom units, each thoughtfully updated for modern living. Recent improvements include a brand-new roof, new mini-split systems for efficient heating and cooling, updated cabinets, and washer/dryer hookups in every unit—an attractive feature for tenants seeking convenience. With strong rental potential and low-maintenance upgrades already in place, this property is ideal for investors looking for a turnkey opportunity.
-
2025-08-27$329,000 Active
-
2023-04-01soldstatus $170,000
-
2023-04-01soldstatus $170,000
-
1993-04-06soldstatus $30,000
ⓘ Source: listings_history table (triggers on properties + properties_extension) + one-shot
backfill from property_details.listing_events for pre-trigger history.
Tax reassessment forecast TN · Resets to sale price
- Current annual tax
- $1,923 · $160/mo
- Projected year-2 tax
- $2,336 · $195/mo
- Expected delta
- +$413/yr (+$34/mo · 21.5%)
ⓘ Screening estimate from a state-policy table — verify with the county assessor before closing.
Climate risk First Street
- Flood 6/10 Major FEMA zone X (unshaded) · 67% chance over 30 yrs
- Wildfire 3/10 Moderate
- Heat 6/10 Major 7 d/yr ≥104°F today · 19 d/yr by 30 yrs out
- Wind 3/10 Moderate 6% chance of damaging wind over 30 yrs
- Air quality 3/10 Moderate 2 unhealthy d/yr today · 2 by 30 yrs out
Nearby sold comps map
Loading sold comps map…
Walkable amenities ~0.75 mi
Loading nearby amenities…
Taxation est. · year 1
- Rental income
- $48,864
- − Mortgage interest
- −$18,429
- − Property taxes
- −$1,923
- − Insurance
- −$1,645
- − Repairs & maintenance
- −$3,909
- − Management
- −$3,909
- − Depreciation
- −$9,571
- Taxable income
- $9,478
- Est. tax owed @ 24.0%
- −$2,275
- After-tax cash flow
- $12,056/yr
For passive investors: Depreciation is non-cash, so a rental often shows a tax loss while cash-flowing — sheltering income. Rental losses are passive: they offset passive income freely, and up to $25,000/yr can offset ordinary (W-2) income if you actively participate and your MAGI is under $100k (phasing out to $0 by $150k); unused losses carry forward. On sale, claimed depreciation is recaptured at up to 25%, and gains may owe capital-gains tax (a 1031 exchange can defer both). Figures are a year-1 estimate at your 24.0% rate — not tax advice; consult a CPA.
Schools (NCES district)
- District
- Cleveland
- NCES district ID
- 4700690
- Math proficiency
- 23% ▼ -9.00%
- Reading proficiency
- 28% ▼ -6.00%
- Median HH income
- $37,612
- Composite
- 21.28/100
- National rank
- #8394
- State rank
- #85 of 139 in TN
Livability — Cleveland
- Score
- 70/100
- State rank
- #55
- US rank
- #7689
Category grades
Schools grade is shown separately in the Schools card above.
Census & demographics
- Census place
- Cleveland, TN
- County
- Bradley County · 99,337 people
- City population
- 99,337
- Metro
- Cleveland, TN
- Population (ZIP)
- 30,720
- Household income
- $47,153
- Rent vs Own
- Severe rent burden
- 1184.0
Population outlook (Bradley County) Hauer SSP2
- Today (2025)
- 114,901 people
- By 2030
- 120,137 · +4.6%
- By 2040
- 130,125 · +13.2%
- By 2050
- 139,257 · +21.2%
- By 2075
- 161,664 · +40.7%
- By 2100
- 179,767 · +56.5%
Race, ethnicity, and origin ACS 2023
- Neighborhood character
- Predominantly White (74%)
- Race & ethnicity
- White 74% Hispanic / Latino 12% Black 9% Two or more races 6%
- Hispanic origin (detail)
- Mexican 7% Puerto Rican 2%
- Common ancestry
- Slovak 3% Serbian 2% Italian 1%
- Foreign-born
- 6% · Canada
- Languages at home
- 88% English-only · Spanish 9% Russian/Polish/Slavic 1%
Political lean MEDSL · Bradley
- 2024 margin
- Solid R (+58.9) · D 20.0% · R 78.9% · Other 1.1%
- 2008→2024 swing
- -9.2pp toward R · 2008: -49.7pp · 2024: -58.9pp
- All cycles
- 2024: R+58.9 2020: R+55.3 2016: R+59.1 2012: R+53.9 2008: R+49.7
Not yet ingested
- Civics
- —
Market trends
- HPI YoY
- ▼ -97.10%
- Current HPI
- 285.0723
- Rent YoY
- ▲ 2.95%
- Metro
- Cleveland, TN
- State GDP YoY
- ▲ 2.78%
- F500 in state
- 22
Industry mix (Fortune 500 HQ in TN)
| Industry | F500 HQs | Revenue |
|---|---|---|
| Healthcare | 3 | $91B |
|
||
| Retail | 3 | $72B |
|
||
| Transportation / Logistics | 1 | $88B |
|
||
| Paper / Packaging | 1 | $19B |
|
||
| Insurance | 1 | $13B |
|
||
| Energy | 1 | $12B |
|
||
Price history
+996.7% since first listed6 events — show timeline
- 2026-04-13 Listed $329,000 RCAOR
- 2026-04-13 Listed $329,000 GCAR
- 2025-08-27 Listed $329,000 RCAOR
- 2023-04-01 Sold (MLS) $170,000 REALTRACS as Distributed by MLS Grid
- 2023-04-01 Sold (MLS) $170,000 GCAR
- 1993-04-06 Sold (Public Records) $30,000 Public Records
Property tax history
+7.4%/yrLatest (2025): $1,923 · +154.4% YoY. Source: county tax records.
Cash-flow waterfall
monthlySold comps — $/sqft
last 12 mo · ≤1 miLoading sold comps…