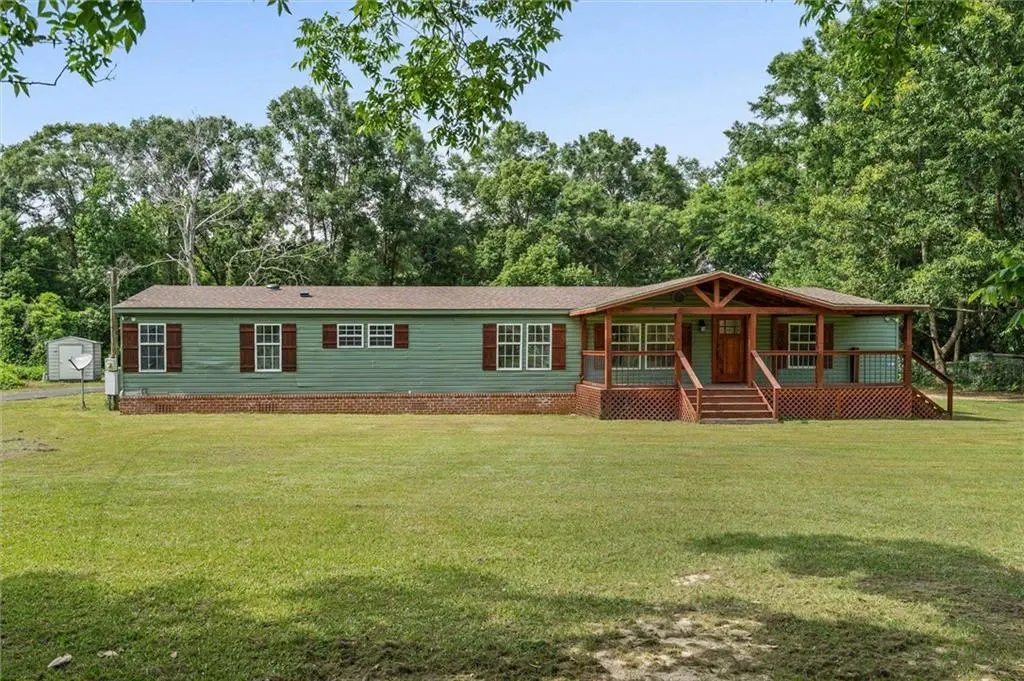
9230 Mcleod Rd · Tillmans Corner, AL
Flood risk 1/10 · Minimal
- FEMA flood zone
- X (unshaded)
- Chance of flooding over 30 yrs
- 0.0%
- Est. flood insurance / yr
- $507 – $1,088
Fire risk 6/10 · Moderate
- Est. fire insurance / yr
- $916 – $1,700
Heat risk 9/10 · Severe
- Hot days now (above 105°F)
- 7 days/yr
- Hot days in 30 yrs
- 20 days/yr
Wind risk 9/10 · Severe
- Chance of severe wind over 30 yrs
- 99.0%
Air-quality risk 1/10 · Minimal
- Unhealthy air days now
- 0 days/yr
- Unhealthy air days in 30 yrs
- 0 days/yr
Risk factors via First Street. Map © Google.
Why this score? — see what drove the D- grade
The composite is a weighted blend of 9 inputs, each scored 0–100. Each bar is that input's sub-score; the figure is the points it added to the 100-point composite (weight × sub-score).
- Cash flow +14.7/30.0
- ARV discount +7.5/15.0
- DSCR +4.5/10.0
- Livability +3.1/5.0
- 1% rule +2.8/10.0
- Condition / age +2.5/5.0
- Rent growth +2.4/5.0
- Schools +2.3/10.0
- Appreciation +0.0/10.0
$229,000
🖨 Deal sheet (PDF) 📄 Offer letter ✓ Due diligence
Listing remarks MLS
***VRM, Sellers will entertain offers between $229,000 - $249,000.*** USDA Eligible!! Welcome to your own private retreat at 9230 McLeod Road in West Mobile, where thoughtful updates, elegant finishes, and peaceful surroundings come together to create a place you’ll love coming home to.This beautifully remodeled 4-bedroom, 3-bath home offers a great blend of modern luxury and peaceful country living. From the moment you arrive, you’ll be welcomed by the charming covered front porch and picturesque setting that provides both privacy and room to breathe.Step inside to discover an impressive open-concept layout featuring a stunning living room with custom built-ins, a fireplace, tray ceilings, and elegant finishes throughout. The spacious kitchen is designed for gathering, complete with abundant cabinetry, beautiful countertops, stainless appliances, and a large island overlooking the main living area.The thoughtfully designed floor plan includes a dedicated office, a bonus room offering endless possibilities, and a spacious primary suite with a spa-inspired bathroom featuring double vanities and a gorgeous freestanding soaking tub. Step outside to enjoy the oversized covered back porch, great for entertaining, relaxing, or simply taking in the peaceful surroundings. With its extensive updates, beautiful craftsmanship, and functional layout, this home truly offers the space and lifestyle you’ve been searching for. Buyer to verify all information during due diligence.
Key facts
- Covered front porch
- Custom built-ins
- Abundant cabinetry
Tags
Property features AI
Finance
- Other: Listing office: Sweet Willow Realty
- HOA & community: No community features; No transfer fees
Exterior
- Parking: No designated parking
- Utilities: Water available; Septic tank; Electric service by Alabama Power
- Home design: Single family residence; One level
- Construction: Vinyl siding; Composition roof; Pillar/post/pier foundation; Resale property; Building area reported by seller
- Exterior features: Front porch; Rear porch; Lot less than 1 acre; No waterfront
Interior
- Kitchen: Dishwasher; Electric range; Refrigerator with ice maker
- Bedrooms: Primary bedroom on the 1st floor with walk-in closet; Primary bedroom/bath combo
- Flooring: Tile flooring
- Bathrooms: Three full bathrooms; Primary bathroom with double vanity and separate shower
- Heating & cooling: Electric central heating; Central electric cooling
- Interior features: Living room; Ceiling fans; Electric fireplace in the living room
Neighborhood map
What this means for you Summary
Snapshot
- This is a 4-bed/3.0-bath single-family listed at $229k.
Deal economics
- At list price, monthly cash flow is $59 ($702/yr) — positive.
- The deal already cash-flows at list — no discount required.
- To meet the 1% rule (rent ≥ 1% of price), the offer needs to be $179k (22.0% below list).
- Recommended offer: $179k (22.0% below list) — sets the bar for 1% rule.
- Cap rate 6.6% vs local median 4.9% in Tillmans Corner — top-decile yield for the area; either an underpriced asset or a hidden risk that comps aren't pricing in. Stress-test before assuming the spread holds.
Location & tenants
- Location reads 61/100 on livability (#260 in AL) — a middle-class / working-renter tenant base. Strengths: cost of living A+, housing A+; Watch: crime D+, amenities F, commute F.
- Mobile County (urban): math 15% / reading 39% proficiency, ranked #81 of 129 in AL (top 63%) — low school quality limits family demand, transient renter base, plan for 1-2y turnover; 67% free/reduced lunch — lower-income household profile, screen leases tightly.
- Zoned schools: Dawes Intermediate School (math 38% / reading 70%, grade C, #96 of 627 statewide, top 16%, 584 students, 30% FRL); Bernice J Causey Middle School (math 17% / reading 51%, grade F, #98 of 257 statewide, top 38%, 1,418 students, 53% FRL); Baker High School (math 25% / reading 28%, grade F, #107 of 305 statewide, top 36%, 2,491 students, 42% FRL) — zoned schools average 41% FRL vs 67% district-wide (26 pts lower); this property's tenant base skews higher-income than the district average.
- Market conditions: Rents soft (-0.4%/yr); 557 active listings in the ZIP; solid renter incomes; 1,678 units permitted in Mobile County in 2024 (264 in 5+ unit buildings).
Forward outlook
- Local home prices are declining (-3.0%/yr); year-one equity from $2k of loan paydown is wiped out by about $7k of value loss. Plan a longer hold.
- Mobile County population projected to shrink 8% by 2050 — rents likely to lag national; underwrite the cash flow, not the appreciation.
Negotiation context
- It's been on market 16 days — a 2% lower offer ($226k) is reasonable based on typical stale-listing flexibility.
- 3 sale attempts since 3y ago with the ask held roughly flat each time — persistent listings suggest the price (not the market) is what's stuck; bring a comps-based counter.
- Current owner paid $50k; list at $229k implies a 358% gain — meaningful room to come down on a strong offer.
Risks & watch-outs
- Climate carrying-cost: severe wind risk, 99% chance of damaging wind over 30y; major wildfire risk; extreme-heat days projected 7→20/yr by 2055 (HVAC capex compounding) — expect insurance premiums to compound above CPI over the hold.
Questions for the listing agent
- Is there a deadline driving the sale (1031 exchange, divorce, estate, relocation)? That informs how much negotiation room exists.
- Schools are F-rated, which usually means shorter tenancies and higher turnover. Who's the typical renter profile here, and what's been the actual vacancy rate?
- Crime grade is D in this area — have there been break-ins, vandalism, or insurance claims at this property in the last 3 years? What carrier currently insures it and at what premium?
- The area grade is low — what's the realistic commute time and amenity access for the typical tenant pool here? Any planned neighborhood developments (good or bad) we should know about?
- What's the average days-on-market for RENTAL listings here right now (not sales)? A rising rental-DOM trend means longer vacancies and softer asking-rent achievability than the comps imply.
- What's the recent tenant-quality profile in this submarket — average credit score on applications, eviction rate, late-payment / NSF rate, and stable-employment percentage? A property-management company in the area should have these aggregated.
- How much new for-sale + rental construction is in the pipeline within 1–3 miles? Heavy new supply typically softens prices + rents 12–24 months out; constrained supply supports both.
Investment metrics
- 1% rule
- 0.78% ✗
- Cap rate
- 6.60%
- Cash-on-cash
- 1.10%
- DSCR
- 1.05
- GRM
- 10.7
CMA / ARV
- ARV (on-the-fly)
- $467,996
- Comps found
- 5
Show comp detail 5 sales within ~0.75 mi
| Address | Dist | Beds/Ba | Sqft | Sold | Price | $/sf | Match |
|---|---|---|---|---|---|---|---|
| 10735 Mcleod Rd | 0.11mi | 4/3.0 | 2,997 (+1%) | 1mo | $422,900 | $141 | 92 |
| 10769 Mcleod Rd | 0.12mi | 4/3.0 | 2,997 (+1%) | 6mo | $427,900 | $143 | 88 |
| 4703 Mcfarland Rd | 0.75mi | 4/3.0 | 2,997 (+1%) | 0mo | $483,900 | $161 | 63 |
| 4689 Mcfarland Rd | 0.72mi | 5/3.0 (+1) | 3,127 (+6%) | 1mo | $493,400 | $158 | 52 |
| 8980 Dawes Ln N | 0.55mi | 4/3.5 | 2,643 (-11%) | 21mo | $550,000 | $208 | 37 |
Match score weights: distance 35% · size 25% · config 20% · recency 20%. Top-matched comps best support the ARV.
Projected returns pro-forma
-3.0% appreciation · 0.0% rent growth · sell at horizon
- IRR
- -17.6%
- Equity multiple
- 0.40×
- Total profit
- $-38,729
- Equity at exit
- $34,145
- IRR
- -15.5%
- Equity multiple
- 0.23×
- Total profit
- $-49,615
- Equity at exit
- $19,800
Cash invested: $64,120 (down + closing). Projections, not guarantees.
Landlord ↔ Tenant lean methodology
- Overall (STATE)
- 90 Strongly Landlord-Friendly
- State Alabama
- 90 Strongly Landlord-Friendly · R+15
- County
- — inherits STATE
- City
- — inherits STATE
ZIP-level market 36695
- Home prices YoY
- -30.9%
- Rents YoY
- -0.4%
- Active inventory
- 557
- Price-to-rent
- 10.7×
Monthly cashflow live
- Estimated rent
- $1,786 medium interval (Pro) →
- Mortgage (P&I)
- −$1,201
- Tax from tax record
- −$56 /mo · $670/yr
- Insurance
- −$95
- HOA
- −$0
- Vacancy / Maint / Mgmt
- −$375
- Net cashflow
- $59
Break-even live
Sensitivity live
| Price | -10% $188 | -5% $123 | +0% $59 | +5% $-6 | +10% $-71 |
|---|---|---|---|---|---|
| Rent | -10% $-83 | -5% $-12 | +0% $59 | +5% $129 | +10% $200 |
| Rate | -1.0pp $174 | -0.5pp $117 | base $59 | +0.5pp $-1 | +1.0pp $-61 |
UW: 25.0% down · 7.5% · 30yr · 1.5% tax · 5.0% vac · 8.0% maint · 8.0% mgmt
Financing live
Cash to close
- Down payment
- $57,250
- Closing costs
- $6,870
- Reserves months
- —
- Total cash needed
- —
Loan-product check · same deal, 3 products live
Conventional
25% down · 7.5% · 30yr
- Down + closing
- —
- Monthly P&I
- —
- Monthly cashflow
- —
- DSCR
- —
- Eligible?
- —
Personal DTI + credit; lowest rate.
DSCR
20% down · 8.5% · 30yr
- Down + closing
- —
- Monthly P&I
- —
- Monthly cashflow
- —
- DSCR
- —
- Eligible?
- —
No personal income docs; deal must DSCR.
Hard money
10% down · 12.0% · 12mo
- Down + closing
- —
- Monthly P&I
- —
- Monthly cashflow
- —
- DSCR
- —
- Eligible?
- —
Short-term bridge; refi at stabilization.
Listing history 12 events
-
2026-06-21days on market $229,000 Active 16 DOM
-
2026-06-18days on market $229,000 Active 13 DOM
-
2026-06-17days on market $229,000 Active 12 DOM
-
2026-06-16days on market $229,000 Active 11 DOM
-
2026-06-15days on market $229,000 Active 10 DOM
-
2026-06-14days on market $229,000 Active 8 DOM
-
2026-06-13days on market $229,000 Active 7 DOM
-
2026-06-10days on market $229,000 Active 5 DOM
-
2026-06-09days on market $229,000 Active 4 DOM
-
2026-06-08days on market $229,000 Active 3 DOM
-
2026-06-07remarks 687-char remark
-
2026-06-07$229,000 Active 2 DOM
ⓘ Source: listings_history table (triggers on properties + properties_extension) + one-shot
backfill from property_details.listing_events for pre-trigger history.
Tax reassessment forecast AL · Resets to sale price
- Current annual tax
- $670 · $56/mo
- Projected year-2 tax
- $939 · $78/mo
- Expected delta
- +$269/yr (+$22/mo · 40.1%)
ⓘ Screening estimate from a state-policy table — verify with the county assessor before closing.
Climate risk First Street
- Flood 1/10 Low FEMA zone X (unshaded) · 0% chance over 30 yrs
- Wildfire 6/10 Major
- Heat 9/10 Extreme 7 d/yr ≥105°F today · 20 d/yr by 30 yrs out
- Wind 9/10 Extreme 99% chance of damaging wind over 30 yrs
- Air quality 1/10 Low 0 unhealthy d/yr today · 0 by 30 yrs out
Nearby sold comps map
Loading sold comps map…
Walkable amenities ~0.75 mi
Loading nearby amenities…
Taxation est. · year 1
- Rental income
- $21,428
- − Mortgage interest
- −$12,828
- − Property taxes
- −$670
- − Insurance
- −$1,145
- − Repairs & maintenance
- −$1,714
- − Management
- −$1,714
- − Depreciation
- −$6,662
- Taxable loss
- −$3,305
- Est. tax savings @ 24.0%
- +$793
- After-tax cash flow
- $1,495/yr
For passive investors: Depreciation is non-cash, so a rental often shows a tax loss while cash-flowing — sheltering income. Rental losses are passive: they offset passive income freely, and up to $25,000/yr can offset ordinary (W-2) income if you actively participate and your MAGI is under $100k (phasing out to $0 by $150k); unused losses carry forward. On sale, claimed depreciation is recaptured at up to 25%, and gains may owe capital-gains tax (a 1031 exchange can defer both). Figures are a year-1 estimate at your 24.0% rate — not tax advice; consult a CPA.
Schools (NCES district)
- District
- Mobile County
- NCES district ID
- 0102370
- Math proficiency
- 15% ▼ -28.00%
- Reading proficiency
- 39% ▬ 0.00%
- Median HH income
- $42,455
- Composite
- 22.9/100
- National rank
- #8002
- State rank
- #81 of 129 in AL
Livability — Tillmans Corner
- Score
- 61/100
- State rank
- #260
- US rank
- #18090
Category grades
Schools grade is shown separately in the Schools card above.
Census & demographics
- County
- Mobile County · 246,577 people
- City population
- 205,729
- Metro
- Mobile, AL
- Population (ZIP)
- 52,690
- Household income
- $76,040
- Rent vs Own
- Severe rent burden
- 1619.0
Population outlook (Mobile County) Hauer SSP2
- Today (2025)
- 415,303 people
- By 2030
- 411,755 · -0.9%
- By 2040
- 399,670 · -3.8%
- By 2050
- 382,616 · -7.9%
- By 2075
- 337,353 · -18.8%
- By 2100
- 283,391 · -31.8%
Race, ethnicity, and origin ACS 2023
- Neighborhood character
- Predominantly White (67%)
- Race & ethnicity
- White 67% Black 23% Two or more races 5% Hispanic / Latino 5% Asian 2%
- Common ancestry
- Lithuanian 3% Italian 2% Slovak 1%
- Foreign-born
- 5% · Canada, Vietnam, China
- Languages at home
- 94% English-only · Spanish 2% Vietnamese 1% Arabic 1%
Political lean MEDSL · Mobile
- 2024 margin
- R (+16.4) · D 41.3% · R 57.7%
- 2008→2024 swing
- -7.7pp toward R · 2008: -8.7pp · 2024: -16.4pp
- All cycles
- 2024: R+16.4 2020: R+11.9 2016: R+13.9 2012: R+9.3 2008: R+8.7
Not yet ingested
- Civics
- —
Market trends
- HPI YoY
- ▼ -86.28%
- Current HPI
- 193.1651
- Rent YoY
- ▼ -0.41%
- Metro
- Mobile, AL
- State GDP YoY
- ▲ 2.94%
- F500 in state
- 4
Industry mix (Fortune 500 HQ in AL)
| Industry | F500 HQs | Revenue |
|---|---|---|
| Financial Services | 1 | $8B |
|
||
| Healthcare | 1 | $5B |
|
||
Price history
+252.9% since first listed5 events — show timeline
- 2026-06-05 Listed $229,000 GCMLS AL
- 2026-06-05 Listed $229,000 BCAR
- 2023-12-27 Listing Removed — CATRS
- 2023-12-08 Sold (Public Records) $50,000 Public Records
- 2023-11-02 Listed $64,900 CATRS
Property tax history
+12.7%/yrLatest (2025): $670 · +5.5% YoY. Source: county tax records.
Cash-flow waterfall
monthlySold comps — $/sqft
last 12 mo · ≤1 miLoading sold comps…