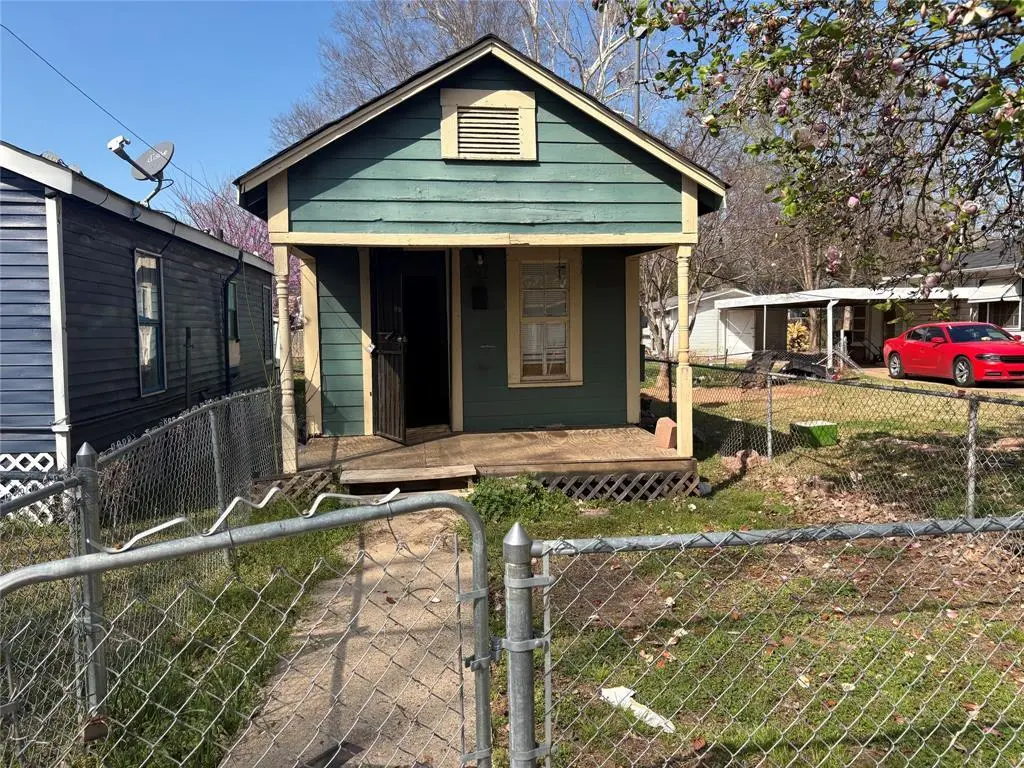
607 Kelly St · Bossier City, LA
Flood risk No data
- FEMA flood zone
- —
- Chance of flooding over 30 yrs
- —
- Est. flood insurance / yr
- —
Fire risk No data
- Est. fire insurance / yr
- —
Heat risk No data
- Hot days now (above threshold)
- —
- Hot days in 30 yrs
- —
Wind risk No data
- Chance of severe wind over 30 yrs
- —
Air-quality risk No data
- Unhealthy air days now
- —
- Unhealthy air days in 30 yrs
- —
Risk factors via First Street. Map © Google.
Why this score? — see what drove the B grade
The composite is a weighted blend of 9 inputs, each scored 0–100. Each bar is that input's sub-score; the figure is the points it added to the 100-point composite (weight × sub-score).
- Cash flow +30.0/30.0
- 1% rule +10.0/10.0
- DSCR +10.0/10.0
- ARV discount +7.5/15.0
- Rent growth +4.1/5.0
- Schools +3.8/10.0
- Livability +3.6/5.0
- Condition / age +2.2/5.0
- Appreciation +0.0/10.0
$30,000
🖨 Deal sheet (PDF) 📄 Offer letter ✓ Due diligence
Key facts
- 4,000 sq ft lot
- Built 1980
- Listed 49 days
Property features AI
Finance
- Other: Listing status: Active; Possession at closing/funding; Listing agreement: Exclusive right to sell
- Financial info: Treat as clear loan type; No second mortgage
- HOA & community: No association
Exterior
- Parking: On-street parking
- Utilities: City sewer; No municipal utility district
- Home design: Single family residence; Residential property; Built in 1980; Not attached; Multi-parcel
- Construction: Built in 1980
- Exterior features: 4000 sq ft lot; Subdivision: Cumberland; Directions: 607 Kelly St
Interior
- Kitchen: Electric cooktop
- Bedrooms: 2 bedrooms (Primary bedroom on level 1)
- Bathrooms: 1 full bathroom
- Interior features: Eat-in kitchen; One level
Neighborhood map
What this means for you Summary
Snapshot
- This is a 2-bed/1.0-bath single-family listed at $30k. Condition is rated fair.
Deal economics
- At list price, monthly cash flow is $620 ($7k/yr) — positive.
- The deal already cash-flows at list — no discount required.
- Meets the 1% rule at list price ($1k rent vs $30k).
- Recommended offer: $29k (3.0% below list) — sets the bar for market timing.
- Cap rate 31.1% vs local median 4.7% in Bossier City — top-decile yield for the area; either an underpriced asset or a hidden risk that comps aren't pricing in. Stress-test before assuming the spread holds.
Location & tenants
- Location reads 71/100 on livability (#47 in LA) — a middle-class / working-renter tenant base. Strengths: commute A+, cost of living A+, housing A+; Watch: employment D+, crime F, amenities F.
- Bossier Parish (urban): math 40% / reading 47% proficiency, ranked #17 of 98 in LA (top 17%) — families likely to look elsewhere, expect single-tenant / working-renter base with shorter leases.
- Market conditions: Rents rising fast (+6.6%/yr); 421 active listings in the ZIP; 11 comparable units currently listed for rent nearby; rentals at typical pace (median 22d on market — plan ~3-4 weeks tenant-placement turnaround); 45% of comp listings sitting > 30 days — soft ceiling on asking rent; 716 units permitted in Bossier Parish in 2024 (0 in 5+ unit buildings).
Forward outlook
- Local home prices are declining (-3.0%/yr); year-one equity from $207 of loan paydown is wiped out by about $900 of value loss. Plan a longer hold.
- Bossier County population projected at +28% by 2050 — long-run rental-demand tailwind backs the buy-and-hold thesis.
- At projected returns (-3.0% appreciation + 6.6% rent growth), your $8k cash investment doubles in ~2 years — after that, you're playing with house money.
Negotiation context
- It's been on market 49 days — a 3% lower offer ($29k) is reasonable based on typical stale-listing flexibility.
- 3 sale attempts since 2y ago with the ask held roughly flat each time — persistent listings suggest the price (not the market) is what's stuck; bring a comps-based counter.
Questions for the listing agent
- It's been on market 49 days. Have you received any prior offers? Is the seller open to a 3% concession, seller financing, or rate buy-down credit?
- Have any recent inspections been done? Can we get a copy of the seller's disclosures and any deferred-maintenance estimates?
- Is there a deadline driving the sale (1031 exchange, divorce, estate, relocation)? That informs how much negotiation room exists.
- Schools are B-rated — typically a magnet for longer-tenancy family renters. What's the average tenant stay here, and is there a school-zone premium baked into asking?
- Crime grade is F in this area — have there been break-ins, vandalism, or insurance claims at this property in the last 3 years? What carrier currently insures it and at what premium?
- What's the average days-on-market for RENTAL listings here right now (not sales)? A rising rental-DOM trend means longer vacancies and softer asking-rent achievability than the comps imply.
- What's the recent tenant-quality profile in this submarket — average credit score on applications, eviction rate, late-payment / NSF rate, and stable-employment percentage? A property-management company in the area should have these aggregated.
- How much new for-sale + rental construction is in the pipeline within 1–3 miles? Heavy new supply typically softens prices + rents 12–24 months out; constrained supply supports both.
Investment metrics
- 1% rule
- 3.49% ✓
- Cap rate
- 31.08%
- Cash-on-cash
- 88.52%
- DSCR
- 4.94
- GRM
- 2.4
CMA / ARV
- ARV (median comp)
- $68,724
- List price
- $30,000
- Delta
- -56.35%
- Verdict
- UNDERPRICED
- Comps
- 20 within 1.0 mi
Show comp detail 2 sales within ~0.75 mi
| Address | Dist | Beds/Ba | Sqft | Sold | Price | $/sf | Match |
|---|---|---|---|---|---|---|---|
| 626 Joannes St | 0.10mi | 3/1.0 (+1) | 851 (-5%) | 14mo | $25,000 | $29 | 69 |
| 424 Berry St | 0.18mi | 3/1.0 (+1) | 1,020 (+13%) | 19mo | $44,000 | $43 | 48 |
Match score weights: distance 35% · size 25% · config 20% · recency 20%. Top-matched comps best support the ARV.
Projected returns pro-forma
-3.0% appreciation · 6.56% rent growth · sell at horizon
- IRR
- 93.1%
- Equity multiple
- 5.58×
- Total profit
- $38,501
- Equity at exit
- $4,473
- IRR
- 96.7%
- Equity multiple
- 13.09×
- Total profit
- $101,552
- Equity at exit
- $2,594
Cash invested: $8,400 (down + closing). Projections, not guarantees.
Landlord ↔ Tenant lean methodology
- Overall (STATE)
- 90 Strongly Landlord-Friendly
- State Louisiana
- 90 Strongly Landlord-Friendly · R+12
- County
- — inherits STATE
- City
- — inherits STATE
ZIP-level market 71111
- Home prices YoY
- -34.8%
- Rents YoY
- 6.6%
- Active inventory
- 421
- Price-to-rent
- 2.4×
Monthly cashflow live
- Estimated rent
- $1,047 high interval (Pro) →
- Mortgage (P&I)
- −$157
- Tax est. 1.5%
- −$38 /mo · $450/yr
- Insurance
- −$12
- HOA
- −$0
- Vacancy / Maint / Mgmt
- −$220
- Net cashflow
- $620
Break-even live
Sensitivity live
| Price | -10% $640 | -5% $630 | +0% $620 | +5% $609 | +10% $599 |
|---|---|---|---|---|---|
| Rent | -10% $537 | -5% $578 | +0% $620 | +5% $661 | +10% $702 |
| Rate | -1.0pp $635 | -0.5pp $627 | base $620 | +0.5pp $612 | +1.0pp $604 |
UW: 25.0% down · 7.5% · 30yr · 1.5% tax · 5.0% vac · 8.0% maint · 8.0% mgmt
Financing live
Cash to close
- Down payment
- $7,500
- Closing costs
- $900
- Reserves months
- —
- Total cash needed
- —
Loan-product check · same deal, 3 products live
Conventional
25% down · 7.5% · 30yr
- Down + closing
- —
- Monthly P&I
- —
- Monthly cashflow
- —
- DSCR
- —
- Eligible?
- —
Personal DTI + credit; lowest rate.
DSCR
20% down · 8.5% · 30yr
- Down + closing
- —
- Monthly P&I
- —
- Monthly cashflow
- —
- DSCR
- —
- Eligible?
- —
No personal income docs; deal must DSCR.
Hard money
10% down · 12.0% · 12mo
- Down + closing
- —
- Monthly P&I
- —
- Monthly cashflow
- —
- DSCR
- —
- Eligible?
- —
Short-term bridge; refi at stabilization.
Rent comps 11 comps
| Address | Beds | Baths | Sqft | Rent | $/sqft | DOM | Units | Dist |
|---|---|---|---|---|---|---|---|---|
| 321 Edwards St Bossier City, LA | 2.0 | 1.0 | 676 | $750 | $1.11 | 44d | 1 | 0.28mi |
| 213 Kelly St Bossier City, LA | 2.0 | 1.0 | 598 | $1,300 | $2.17 | 14d | 1 | 0.29mi |
| 309 Edwards St Bossier City, LA | 3.0 | 1.0 | 804 | $815 | $1.01 | 21d | 1 | 0.30mi |
| 301 Edwards St Bossier City, LA | 2.0 | 1.0 | 900 | $1,175 | $1.31 | 21d | 1 | 0.31mi |
| 420 Wyche St Bossier City, LA | 1.0 | 1.0 | 800 | $500 | $0.62 | 44d | 1 | 0.31mi |
| 1820 E Texas St Bossier City, LA | 2.0 | 1.0 | 750 | $850 | $1.13 | 44d | 1 | 0.44mi |
| 1225 Delhi St Bossier City, LA | 3.0 | 1.0 | 1092 | $800 | $0.73 | 21d | 1 | 1.00mi |
| 1525 Debra St Bossier City, LA | 3.0 | 1.0 | 1033 | $975 | $0.94 | 21d | 1 | 1.26mi |
| 100 Crossroads Blvd Bossier City, LA | 1.0–2.0 | 1.0–2.0 | 858 | $1,299 | $1.51 | 44d | 1 | 1.37mi |
| 719 Edwards St Shreveport, LA | 1.0–2.0 | 1.0 | 810 | $1,275 | $1.57 | 21d | 7 | 1.37mi |
| 400 Preston Blvd Bossier City, LA | 1.0 | 1.0 | 706 | $870 | $1.23 | 44d | 1 | 1.40mi |
Listing history 20 events
-
2026-06-18days on market $30,000 Active 49 DOM
-
2026-06-17days on market $30,000 Active 48 DOM
-
2026-06-16days on market $30,000 Active 47 DOM
-
2026-06-15days on market $30,000 Active 46 DOM
-
2026-06-14days on market $30,000 Active 44 DOM
-
2026-06-13days on market $30,000 Active 43 DOM
-
2026-06-10days on market $30,000 Active 41 DOM
-
2026-06-09days on market $30,000 Active 40 DOM
-
2026-06-08days on market $30,000 Active 39 DOM
-
2026-06-07days on market $30,000 Active 38 DOM
-
2026-06-02days on market $30,000 Active 33 DOM
-
2026-06-01days on market $30,000 Active 32 DOM
-
2026-05-31days on market $30,000 Active 31 DOM
-
2026-05-30days on market $30,000 Active 30 DOM
-
2026-04-30$30,000 Active 763-char remark
-
2025-10-06historical $800
-
2025-10-04$800
-
2024-06-29historical $800
-
2024-06-08$800
-
2023-04-08historical
ⓘ Source: listings_history table (triggers on properties + properties_extension) + one-shot
backfill from property_details.listing_events for pre-trigger history.
Nearby sold comps map
Loading sold comps map…
Walkable amenities ~0.75 mi
Loading nearby amenities…
Taxation est. · year 1
- Rental income
- $12,561
- − Mortgage interest
- −$1,680
- − Property taxes
- −$450
- − Insurance
- −$150
- − Repairs & maintenance
- −$1,005
- − Management
- −$1,005
- − Depreciation
- −$873
- Taxable income
- $7,398
- Est. tax owed @ 24.0%
- −$1,776
- After-tax cash flow
- $5,660/yr
For passive investors: Depreciation is non-cash, so a rental often shows a tax loss while cash-flowing — sheltering income. Rental losses are passive: they offset passive income freely, and up to $25,000/yr can offset ordinary (W-2) income if you actively participate and your MAGI is under $100k (phasing out to $0 by $150k); unused losses carry forward. On sale, claimed depreciation is recaptured at up to 25%, and gains may owe capital-gains tax (a 1031 exchange can defer both). Figures are a year-1 estimate at your 24.0% rate — not tax advice; consult a CPA.
Condition & rehab AI · 9 photos
This property requires moderate renovations to improve its condition and increase its value. Key areas for improvement include the kitchen, bathrooms, exterior, and landscaping.
Repairs flagged
- Major Kitchen appliances — Older and worn, need replacement
- Major Bathroom fixtures — Outdated and small, need replacement
- Major Exterior paint — Weathered and needs repainting
- Major Exterior siding — Weathered and needs repair
- Major Landscaping — Needs trimming and planting
Value-add opportunities
- Both Replace kitchen appliances and fixtures — Modernizing the kitchen will appeal to both buyers and renters
- Both Paint exterior and interior — Fresh paint will improve curb appeal and interior aesthetics
- Both Replace windows — New windows will improve energy efficiency and curb appeal
Renovation cost estimate screening
| Repair item | Severity | Est. cost |
|---|---|---|
| Kitchen appliances · Older and worn, need replacement | Major | $15,000–50,000 |
| Bathroom fixtures · Outdated and small, need replacement | Major | $15,000–50,000 |
| Exterior paint · Weathered and needs repainting | Major | $15,000–50,000 |
| Exterior siding · Weathered and needs repair | Major | $15,000–50,000 |
| Landscaping · Needs trimming and planting | Major | $15,000–50,000 |
| Total estimated repair cost · 5 items | $75,000–250,000 |
Value-add ROI direction
- Both Replace kitchen appliances and fixtures — Modernizing the kitchen will appeal to both buyers and renters ↑
- Both Paint exterior and interior — Fresh paint will improve curb appeal and interior aesthetics ↑
- Both Replace windows — New windows will improve energy efficiency and curb appeal ↑
ⓘ Cost ranges are severity-bucket heuristics (US national rule-of-thumb). Get contractor quotes + a written scope before underwriting a rehab budget.
Schools (NCES district)
- District
- Bossier Parish
- NCES district ID
- 2200270
- Math proficiency
- 40% ▼ -32.00%
- Reading proficiency
- 47% ▼ -28.00%
- Median HH income
- $51,326
- Composite
- 37.5/100
- National rank
- #4402
- State rank
- #17 of 98 in LA
Livability — Bossier City
- Score
- 71/100
- State rank
- #47
- US rank
- #7044
Category grades
Schools grade is shown separately in the Schools card above.
Census & demographics
- Census place
- Bossier City, LA
- County
- Bossier Parish · 98,704 people
- City population
- 91,925
- Metro
- Shreveport-Bossier City, LA
- Population (ZIP)
- 43,925
- Household income
- $65,292
- Rent vs Own
- Severe rent burden
- 1942.0
Population outlook (Bossier County) Hauer SSP2
- Today (2025)
- 143,247 people
- By 2030
- 151,802 · +6.0%
- By 2040
- 168,194 · +17.4%
- By 2050
- 183,533 · +28.1%
- By 2075
- 217,009 · +51.5%
- By 2100
- 230,091 · +60.6%
Race, ethnicity, and origin ACS 2023
- Neighborhood character
- Diverse neighborhood (Simpson 0.60)
- Race & ethnicity
- White 56% Black 29% Hispanic / Latino 9% Two or more races 8% Asian 3%
- Hispanic origin (detail)
- Mexican 5%
- Common ancestry
- Lithuanian 2% Iranian 1% Slovak 1%
- Foreign-born
- 5% · Canada, Vietnam
- Languages at home
- 90% English-only · Spanish 7% Vietnamese 1% French/Haitian/Cajun 1%
Political lean MEDSL · Bossier
- 2024 margin
- Solid R (+43.3) · D 27.7% · R 71.0% · Other 1.3%
- 2008→2024 swing
- +0.3pp no change · 2008: -43.7pp · 2024: -43.3pp
- All cycles
- 2024: R+43.3 2020: R+41.0 2016: R+45.8 2012: R+45.4 2008: R+43.7
Not yet ingested
- Civics
- —
Market trends
- HPI YoY
- ▼ -79.78%
- Current HPI
- 149.4336
- Rent YoY
- ▲ 6.56%
- Metro
- Shreveport-Bossier City, LA
- State GDP YoY
- ▲ 3.29%
- F500 in state
- 10
Industry mix (Fortune 500 HQ in LA)
| Industry | F500 HQs | Revenue |
|---|---|---|
| Telecommunications | 2 | $23B |
|
||
| Utilities | 1 | $12B |
|
||
| Wholesale / Distribution | 1 | $5B |
|
||
| Advertising | 1 | $2B |
|
||
Price history
6 events — show timeline
- 2026-04-30 Listed $30,000 NTREIS
- 2025-10-06 Rental Removed $800 APPFOLIO
- 2025-10-04 Listed for Rent $800 APPFOLIO
- 2024-06-29 Rental Removed $800 APPFOLIO
- 2024-06-08 Listed for Rent $800 APPFOLIO
- 2023-04-08 Rental Removed — RENT.
Cash-flow waterfall
monthlySold comps — $/sqft
last 12 mo · ≤1 miLoading sold comps…