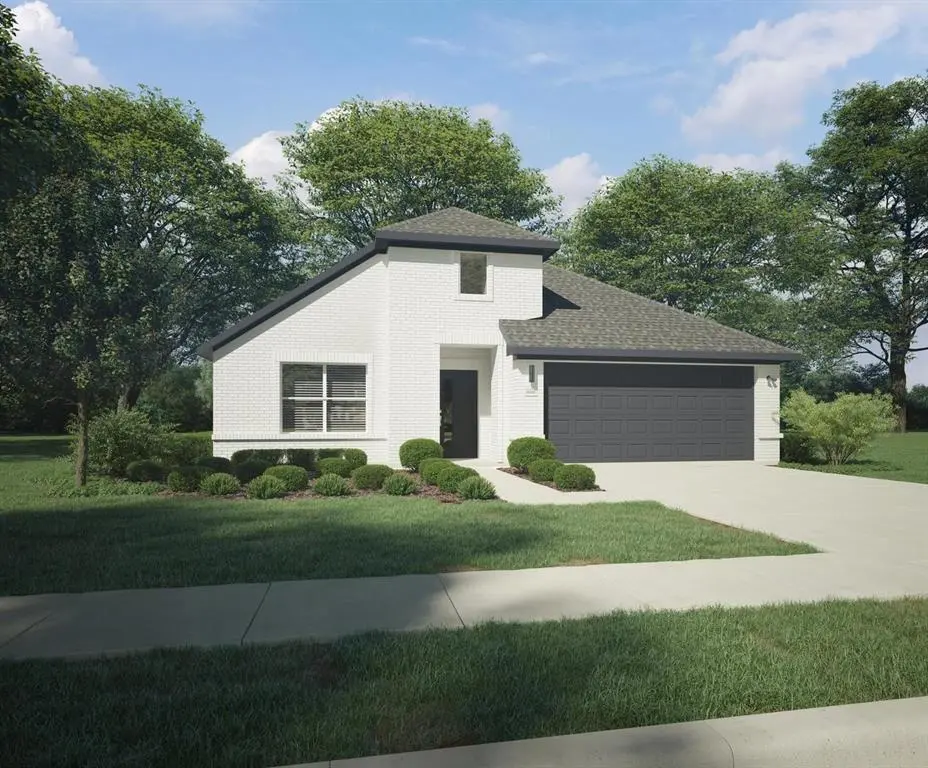
6648 Coyote Valley Trl · Fort Worth, TX
Flood risk No data
- FEMA flood zone
- —
- Chance of flooding over 30 yrs
- —
- Est. flood insurance / yr
- —
Fire risk No data
- Est. fire insurance / yr
- —
Heat risk No data
- Hot days now (above threshold)
- —
- Hot days in 30 yrs
- —
Wind risk No data
- Chance of severe wind over 30 yrs
- —
Air-quality risk No data
- Unhealthy air days now
- —
- Unhealthy air days in 30 yrs
- —
Risk factors via First Street. Map © Google.
Why this score? — see what drove the D- grade
The composite is a weighted blend of 9 inputs, each scored 0–100. Each bar is that input's sub-score; the figure is the points it added to the 100-point composite (weight × sub-score).
- Cash flow +12.3/30.0
- ARV discount +7.3/15.0
- Livability +4.0/5.0
- DSCR +3.6/10.0
- Rent growth +3.1/5.0
- 1% rule +2.5/10.0
- Schools +2.5/10.0
- Condition / age +2.5/5.0
- Appreciation +0.0/10.0
$359,990
🖨 Deal sheet 📄 Offer letter ✓ Due diligence
Listing remarks MLS
MLS# 21216674 - Built by Trophy Signature Homes - Jun 2026 completion! ~ Perfect proportions and an abundance of well-placed features make the Oscar a blockbuster design you'll love coming home to. Say hello to the sun as it streams through oversized windows in your primary suite. Just around the corner is your home office, an inviting space that encourages creativity and offers an escape to the back patio or the ultra-modern kitchen when it's time for a break. Life is centered in the great room with a cozy family room, chic dining area and an ultra-modern kitchen. Three additional bedrooms located near the front of the house are private, quiet and serene.
Key facts
- 5,750 sq ft lot
- 2 garage spots
- Community pool
Neighborhood map
What this means for you Summary
Snapshot
- This is a 4-bed/3.0-bath other listed at $360k.
Deal economics
- At list price, monthly cash flow is $-68 ($-819/yr) — negative.
- To cash-flow at today's rent, offer at most $348k (3.4% below list).
- To meet the 1% rule (rent ≥ 1% of price), the offer needs to be $269k (25.4% below list).
- Recommended offer: $269k (25.4% below list) — sets the bar for 1% rule.
- Cap rate 6.1% vs local median 3.9% in Fort Worth — top-decile yield for the area; either an underpriced asset or a hidden risk that comps aren't pricing in. Stress-test before assuming the spread holds.
Location & tenants
- Location reads 80/100 on livability (#49 in TX, #1,954 nationally) — a professional / high-income tenant draw. Strengths: amenities A+, cost of living A+, housing A+; Watch: schools D+, crime F.
- Crowley ISD (urban): math 23% / reading 32% proficiency, ranked #643 of 826 in TX (top 78%) — low school quality limits family demand, transient renter base, plan for 1-2y turnover.
- Market conditions: Rents rising (+2.3%/yr); 1018 active listings in the ZIP; 32 comparable units currently listed for rent nearby; rentals at typical pace (median 25d on market — plan ~3-4 weeks tenant-placement turnaround); 47% of comp listings sitting > 30 days — soft ceiling on asking rent; solid renter incomes; 18,938 units permitted in Tarrant County in 2024 (8,336 in 5+ unit buildings).
- This rent runs 33% of the median local income ($98k/yr) — at the standard rent-burdened threshold; future hikes will face affordability resistance.
Forward outlook
- Local home prices are declining (-3.0%/yr); year-one equity from $2k of loan paydown is wiped out by about $11k of value loss. Plan a longer hold.
- Tarrant County population projected at +41% by 2050 — long-run rental-demand tailwind backs the buy-and-hold thesis.
Negotiation context
- It's been on market 87 days — a 6% lower offer ($338k) is reasonable based on typical stale-listing flexibility.
- 2 sale attempts with the ask held roughly flat each time — persistent listings suggest the price (not the market) is what's stuck; bring a comps-based counter.
Questions for the listing agent
- What do current leases actually rent for vs. the listed asking? Can we see a recent rent roll and the last 12 months of T-12 income?
- It's been on market 87 days. Have you received any prior offers? Is the seller open to a 25% concession, seller financing, or rate buy-down credit?
- What does the HOA fee cover, when was the last increase, and are there any pending special assessments or reserve-fund shortfalls?
- Why hasn't it sold? Are there any deal-killer items the seller is aware of (foundation, flood, title, zoning, code violations)?
- Is there a deadline driving the sale (1031 exchange, divorce, estate, relocation)? That informs how much negotiation room exists.
- Schools are D-rated, which usually means shorter tenancies and higher turnover. Who's the typical renter profile here, and what's been the actual vacancy rate?
- Crime grade is F in this area — have there been break-ins, vandalism, or insurance claims at this property in the last 3 years? What carrier currently insures it and at what premium?
- The area grade is low — what's the realistic commute time and amenity access for the typical tenant pool here? Any planned neighborhood developments (good or bad) we should know about?
- What's the average days-on-market for RENTAL listings here right now (not sales)? A rising rental-DOM trend means longer vacancies and softer asking-rent achievability than the comps imply.
- What's the recent tenant-quality profile in this submarket — average credit score on applications, eviction rate, late-payment / NSF rate, and stable-employment percentage? A property-management company in the area should have these aggregated.
- How much new for-sale + rental construction is in the pipeline within 1–3 miles? Heavy new supply typically softens prices + rents 12–24 months out; constrained supply supports both.
Investment metrics
- 1% rule
- 0.75% ✗
- Cap rate
- 6.07%
- Cash-on-cash
- -0.81%
- DSCR
- 0.96
- GRM
- 11.2
CMA / ARV
- ARV (median comp)
- $358,266
- List price
- $359,990
- Delta
- 0.48%
- Verdict
- FAIR
- Comps
- 20 within 1.0 mi
Projected returns pro-forma
-3.0% appreciation · 2.28% rent growth · sell at horizon
- IRR
- -18.4%
- Equity multiple
- 0.36×
- Total profit
- $-64,757
- Equity at exit
- $53,676
- IRR
- -12.1%
- Equity multiple
- 0.30×
- Total profit
- $-70,380
- Equity at exit
- $31,125
Cash invested: $100,797 (down + closing). Projections, not guarantees.
Landlord ↔ Tenant lean methodology
- Overall (STATE)
- 87 Strongly Landlord-Friendly
- State Texas
- 87 Strongly Landlord-Friendly · R+5
- County
- — inherits STATE
- City
- — inherits STATE
ZIP-level market 76036
- Home prices YoY
- -25.2%
- Rents YoY
- 2.3%
- Active inventory
- 1018
- Price-to-rent
- 11.2×
Monthly cashflow live
- Estimated rent
- $2,686 high interval (Pro) →
- Mortgage (P&I)
- −$1,888
- Tax from tax record
- −$87 /mo · $1,045/yr
- Insurance
- −$150
- HOA
- −$65
- Vacancy / Maint / Mgmt
- −$564
- Net cashflow
- $-68
Break-even live
UW: 25.0% down · 7.5% · 30yr · 1.5% tax · 5.0% vac · 8.0% maint · 8.0% mgmt
Financing live
Cash to close
- Down payment
- $89,998
- Closing costs
- $10,800
- Reserves months
- —
- Total cash needed
- —
Loan-product check · same deal, 3 products live
Conventional
25% down · 7.5% · 30yr
- Down + closing
- —
- Monthly P&I
- —
- Monthly cashflow
- —
- DSCR
- —
- Eligible?
- —
Personal DTI + credit; lowest rate.
DSCR
20% down · 8.5% · 30yr
- Down + closing
- —
- Monthly P&I
- —
- Monthly cashflow
- —
- DSCR
- —
- Eligible?
- —
No personal income docs; deal must DSCR.
Hard money
10% down · 12.0% · 12mo
- Down + closing
- —
- Monthly P&I
- —
- Monthly cashflow
- —
- DSCR
- —
- Eligible?
- —
Short-term bridge; refi at stabilization.
Rent comps 32 comps
| Address | Beds | Baths | Sqft | Rent | $/sqft | DOM | Units | Dist |
|---|---|---|---|---|---|---|---|---|
| 6732 Denim Dr Crowley, TX | 4.0 | 3.0 | 2187 | $3,100 | $1.42 | 43d | 1 | 0.12mi |
| 9701 Theo TRL Fort Worth, TX | 1.0–3.0 | 1.0–2.0 | 1021 | $2,294 | $2.25 | 1d | 50 | 0.52mi |
| 6520 Pecos Hill Ln Fort Worth, TX | 3.0 | 2.0 | 2140 | $2,700 | $1.26 | 43d | 1 | 0.56mi |
| 8901 Brewer Blvd Fort Worth, TX | 1.0–4.0 | 1.0–2.5 | 1167 | $2,895 | $2.48 | 1d | 20 | 0.73mi |
| 6048 Bee Balm Dr Fort Worth, TX | 3.0 | 2.0 | 2454 | $2,420 | $0.99 | 5d | 1 | 0.75mi |
| 5637 McLanahan Ln Crowley, TX | 3.0 | 2.0 | 1501 | $2,150 | $1.43 | 43d | 1 | 0.83mi |
| 8409 Hollow Bend St Fort Worth, TX | 3.0 | 2.0 | 1624 | $2,050 | $1.26 | 24d | 1 | 0.93mi |
| 8409 Hollow Bend St Fort Worth, TX | 3.0 | 2.0 | 1624 | $2,050 | $1.26 | 11d | 1 | 0.93mi |
| 10308 Holycross Ln Crowley, TX | 3.0 | 2.0 | 1636 | $2,350 | $1.44 | 24d | 1 | 0.93mi |
| 10308 Holycross Ln Crowley, TX | 3.0 | 2.0 | 1636 | $2,400 | $1.47 | 12d | 1 | 0.93mi |
| 5609 Cookstown Ln Crowley, TX | 4.0 | 2.5 | 2095 | $2,455 | $1.17 | 24d | 1 | 0.94mi |
| 5601 Portlaw Ln Crowley, TX | 4.0 | 2.5 | 2338 | $2,575 | $1.10 | 24d | 1 | 0.95mi |
| 5520 McLanahan Ln Crowley, TX | 3.0 | 2.0 | 1508 | $2,195 | $1.46 | 24d | 1 | 0.96mi |
| 8428 Fawn Creek Dr Fort Worth, TX | 3.0 | 2.0 | 1515 | $2,095 | $1.38 | 43d | 1 | 0.98mi |
| 10356 Holycross Ln Crowley, TX | 4.0 | 2.0 | 1827 | $2,500 | $1.37 | 24d | 1 | 1.00mi |
| 10321 Rosegreen Ln Crowley, TX | 3.0 | 2.0 | 1636 | $1,999 | $1.22 | 43d | 1 | 1.02mi |
| 8301 Bell Ridge Ln Fort Worth, TX | 3.0 | 2.0 | 1487 | $1,919 | $1.29 | 22d | 1 | 1.05mi |
| 10357 Rosegreen Ln Crowley, TX | 3.0 | 2.0 | 1898 | $2,200 | $1.16 | 43d | 1 | 1.06mi |
| 5916 Pansy Rd Fort Worth, TX | 3.0 | 2.5 | 2084 | $2,899 | $1.39 | 5d | 1 | 1.06mi |
| 9729 Wild Prairie Way Crowley, TX | 3.0 | 2.0 | 1613 | $2,500 | $1.55 | 43d | 1 | 1.10mi |
| 9069 Summer Creek Dr Unit 9102 Fort Worth, TX | 3.0 | 2.0 | 1451 | $2,210 | $1.52 | 43d | 1 | 1.12mi |
| 9069 Summer Creek Dr Fort Worth, TX | 1.0–3.0 | 1.0–2.0 | 1059 | $2,185 | $2.06 | 1d | 40 | 1.12mi |
| 9724 Buffalo Ridge Rd Crowley, TX | 4.0 | 2.0 | 2004 | $2,125 | $1.06 | 43d | 1 | 1.12mi |
| 9720 Buffalo Ridge Rd Crowley, TX | 4.0 | 2.0 | 1838 | $2,400 | $1.31 | 24d | 1 | 1.12mi |
| 6128 Fall Creek Ln Fort Worth, TX | 4.0 | 2.0 | 2004 | $2,399 | $1.20 | 43d | 1 | 1.15mi |
| 8345 High Garden St Fort Worth, TX | 4.0 | 3.0 | 2320 | $2,425 | $1.05 | 5d | 1 | 1.16mi |
| 5841 Fir Tree Ln Fort Worth, TX | 4.0 | 2.0 | 1549 | $2,680 | $1.73 | 43d | 1 | 1.23mi |
| 5816 Burgundy Rose Dr Fort Worth, TX | 3.0 | 2.0 | 1441 | $1,999 | $1.39 | 43d | 1 | 1.32mi |
| 9808 Mescalbean Blvd Crowley, TX | 4.0 | 2.0 | 1729 | $2,150 | $1.24 | 43d | 1 | 1.38mi |
| 8609 Cloudyway Dr Fort Worth, TX | 3.0 | 2.0 | 2262 | $2,800 | $1.24 | 17d | 1 | 1.39mi |
| 4924 Sassafras Dr Crowley, TX | 3.0 | 2.0 | 1479 | $2,350 | $1.59 | 43d | 1 | 1.45mi |
| 8713 Windblow Ct Fort Worth, TX | 4.0 | 2.5 | 2465 | $2,499 | $1.01 | 43d | 1 | 1.50mi |
HOA detail
- Monthly dues
- $65 · $780/yr
Listing history 16 events
-
2026-06-18days on market $359,990 Active 87 DOM
-
2026-06-17days on market $359,990 Active 86 DOM
-
2026-06-16days on market $359,990 Active 85 DOM
-
2026-06-15days on market $359,990 Active 84 DOM
-
2026-06-13days on market $359,990 Active 82 DOM
-
2026-06-13days on market $359,990 Active 81 DOM
-
2026-06-09days on market $359,990 Active 78 DOM
-
2026-06-08days on market $359,990 Active 77 DOM
-
2026-06-07days on market $359,990 Active 76 DOM
-
2026-06-04days on market $359,990 Active 73 DOM
-
2026-06-03days on market $359,990 Active 72 DOM
-
2026-06-02days on market $359,990 Active 71 DOM
-
2026-06-01days on market $359,990 Active 70 DOM
-
2026-05-31days on market $359,990 Active 69 DOM
-
2026-03-23$359,990 Active 664-char remark
Show marketing remark (664 chars)
MLS# 21216674 - Built by Trophy Signature Homes - Jun 2026 completion! ~ Perfect proportions and an abundance of well-placed features make the Oscar a blockbuster design you'll love coming home to. Say hello to the sun as it streams through oversized windows in your primary suite. Just around the corner is your home office, an inviting space that encourages creativity and offers an escape to the back patio or the ultra-modern kitchen when it's time for a break. Life is centered in the great room with a cozy family room, chic dining area and an ultra-modern kitchen. Three additional bedrooms located near the front of the house are private, quiet and serene.
-
2026-03-22$359,990 Active 591-char remark
Show marketing remark (591 chars)
Perfect proportions and an abundance of well-placed features make the Oscar a blockbuster design you'll love coming home to. Say hello to the sun as it streams through oversized windows in your primary suite. Just around the corner is your home office, an inviting space that encourages creativity and offers an escape to the back patio or the ultra-modern kitchen when it's time for a break. Life is centered in the great room with a cozy family room, chic dining area and an ultra-modern kitchen. Three additional bedrooms located near the front of the house are private, quiet and serene.
ⓘ Source: listings_history table (triggers on properties + properties_extension) + one-shot
backfill from property_details.listing_events for pre-trigger history.
Tax reassessment forecast TX · Resets to sale price
- Current annual tax
- $1,045 · $87/mo
- Projected year-2 tax
- $6,588 · $549/mo
- Expected delta
- +$5,542/yr (+$462/mo · 530.2%)
ⓘ Screening estimate from a state-policy table — verify with the county assessor before closing.
Nearby sold comps map
Loading sold comps map…
Walkable amenities ~0.75 mi
Loading nearby amenities…
Taxation est. · year 1
- Rental income
- $32,228
- − Mortgage interest
- −$20,165
- − Property taxes
- −$1,045
- − Insurance
- −$1,800
- − Repairs & maintenance
- −$2,578
- − Management
- −$2,578
- − HOA
- −$780
- − Depreciation
- −$10,472
- Taxable loss
- −$7,191
- Est. tax savings @ 24.0%
- +$1,726
- After-tax cash flow
- $907/yr
For passive investors: Depreciation is non-cash, so a rental often shows a tax loss while cash-flowing — sheltering income. Rental losses are passive: they offset passive income freely, and up to $25,000/yr can offset ordinary (W-2) income if you actively participate and your MAGI is under $100k (phasing out to $0 by $150k); unused losses carry forward. On sale, claimed depreciation is recaptured at up to 25%, and gains may owe capital-gains tax (a 1031 exchange can defer both). Figures are a year-1 estimate at your 24.0% rate — not tax advice; consult a CPA.
Schools (NCES district)
- District
- Crowley ISD
- NCES district ID
- 4815910
- Math proficiency
- 23% ▼ -15.00%
- Reading proficiency
- 32% ▼ -6.00%
- Median HH income
- $59,810
- Composite
- 25.04/100
- National rank
- #7549
- State rank
- #643 of 826 in TX
Livability — Fort Worth
- Score
- 80/100
- State rank
- #49
- US rank
- #1954
Category grades
Schools grade is shown separately in the Schools card above.
Census & demographics
- Census place
- Fort Worth, TX
- County
- Tarrant County · 2,033,669 people
- City population
- 911,619
- Metro
- Dallas-Fort Worth-Arlington, TX
- Population (ZIP)
- 36,044
- Household income
- $97,973
- Rent vs Own
- Severe rent burden
- 584.0
Population outlook (Tarrant County) Hauer SSP2
- Today (2025)
- 2,380,417 people
- By 2030
- 2,578,900 · +8.3%
- By 2040
- 2,974,995 · +25.0%
- By 2050
- 3,350,489 · +40.8%
- By 2075
- 4,216,909 · +77.2%
- By 2100
- 4,741,527 · +99.2%
Race, ethnicity, and origin ACS 2023
- Neighborhood character
- Diverse neighborhood (Simpson 0.65)
- Race & ethnicity
- White 48% Hispanic / Latino 28% Black 20% Two or more races 14% Asian 2%
- Hispanic origin (detail)
- Mexican 23% Puerto Rican 2%
- Common ancestry
- Slovak 3% Italian 2% Serbian 1%
- Foreign-born
- 8% · Canada, Vietnam
- Languages at home
- 79% English-only · Spanish 18% Other Indo-European 1% Vietnamese 1%
Political lean MEDSL · Tarrant
- 2024 margin
- Lean R (+5.1) · D 46.7% · R 51.9% · Other 1.4%
- 2008→2024 swing
- +6.6pp toward D · 2008: -11.7pp · 2024: -5.1pp
- All cycles
- 2024: R+5.1 2020: D+0.2 2016: R+8.7 2012: R+15.7 2008: R+11.7
Not yet ingested
- Civics
- —
Market trends
- HPI YoY
- ▼ -80.45%
- Current HPI
- 238.6365
- Rent YoY
- ▲ 2.28%
- Metro
- Dallas-Fort Worth-Arlington, TX
- State GDP YoY
- ▲ 3.95%
- F500 in state
- 110
Industry mix (Fortune 500 HQ in TX)
| Industry | F500 HQs | Revenue |
|---|---|---|
| Energy | 16 | $1,198B |
|
||
| Technology | 5 | $198B |
|
||
| Engineering / Construction | 4 | $72B |
|
||
| Energy Services | 3 | $60B |
|
||
| Utilities | 3 | $41B |
|
||
| Healthcare | 2 | $330B |
|
||
Price history
+0.0% since first listed2 events — show timeline
- 2026-03-23 Listed $359,990 NTREIS
- 2026-03-22 Listed $359,990 Zillow
Cash-flow waterfall
monthlySold comps — $/sqft
last 12 mo · ≤1 miLoading sold comps…