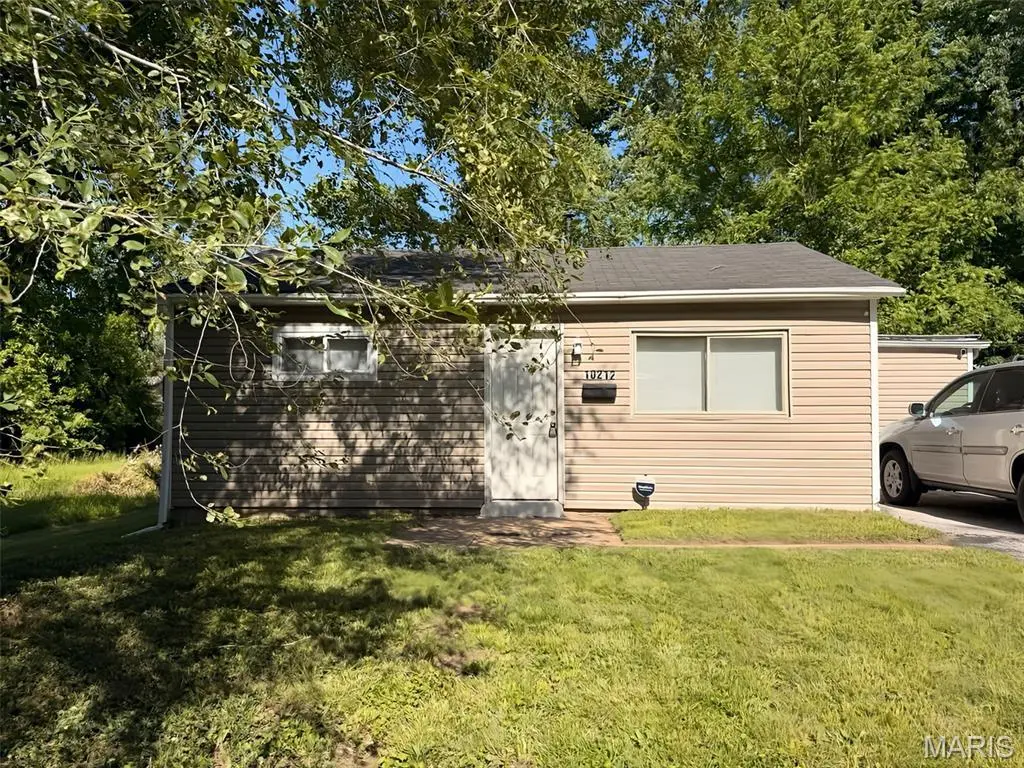
10212 Duke Dr · Castle Point, MO
Flood risk 1/10 · Minimal
- FEMA flood zone
- X (unshaded)
- Chance of flooding over 30 yrs
- 0.0%
- Est. flood insurance / yr
- $507 – $1,088
Fire risk 1/10 · Minimal
- Est. fire insurance / yr
- $1,054 – $1,958
Heat risk 5/10 · Moderate
- Hot days now (above 107°F)
- 7 days/yr
- Hot days in 30 yrs
- 20 days/yr
Wind risk 2/10 · Minimal
- Chance of severe wind over 30 yrs
- 1.0%
Air-quality risk 4/10 · Minor
- Unhealthy air days now
- 4 days/yr
- Unhealthy air days in 30 yrs
- 5 days/yr
Risk factors via First Street. Map © Google.
Why this score? — see what drove the B grade
The composite is a weighted blend of 9 inputs, each scored 0–100. Each bar is that input's sub-score; the figure is the points it added to the 100-point composite (weight × sub-score).
- Cash flow +30.0/30.0
- DSCR +10.0/10.0
- 1% rule +7.6/10.0
- ARV discount +7.5/15.0
- Appreciation +6.9/10.0
- Rent growth +3.7/5.0
- Livability +3.2/5.0
- Condition / age +2.5/5.0
- Schools +0.4/10.0
$85,000
🖨 Deal sheet 📄 Offer letter ✓ Due diligence
Listing remarks
Step into a beautifully renovated piece of St. Louis history at 10212 Duke Dr, St. Louis, MO 63136. Built in 1954, this move-in ready single-family home combines classic charm with extensive modern updates, offering peace of mind knowing nearly everything has already been replaced or upgraded. Major improvements include brand new underground plumbing, a brand new water line, new electric service outside, a brand new water heater, and a brand new A/C unit. The home also features brand new windows throughout and a roof that is less than 5 years old. The furnace is approximately 10 years old and still working great. The updated kitchen features granite countertops, a brand new backsplash, and
Key facts
- New water line
- New electric service
- New a/c unit
Tags
Property features AI
Finance
- Financial info: Annual tax amount: $397
Exterior
- Utilities: Public water; Public sewer; Electric service by Ameren; Cable available; Electricity available; Natural gas available
- Home design: Single-family residence; Residential property; One story
- Construction: Brick veneer exterior
- Exterior features: Front yard; Back yard; Some trees
Interior
- Bedrooms: 2 bedrooms (both on the main level)
- Bathrooms: 1 full bathroom (main level)
- Heating & cooling: Forced air heating (natural gas); Central air conditioning
- Interior features: One-level living
Neighborhood map
What this means for you Summary
Snapshot
- This is a 2-bed/1.0-bath single-family listed at $85k.
Deal economics
- At list price, monthly cash flow is $317 ($4k/yr) — positive.
- The deal already cash-flows at list — no discount required.
- Meets the 1% rule at list price ($1k rent vs $85k).
- Recommended offer: $82k (3.0% below list) — sets the bar for market timing.
Location & tenants
- Location reads 64/100 on livability (#313 in MO) — a middle-class / working-renter tenant base. Strengths: cost of living A+, crime B; Watch: amenities F, commute F, employment F.
- Riverview Gardens (suburban): math 2% / reading 9% proficiency, ranked #324 of 324 in MO (top 100%) — low school quality limits family demand, transient renter base, plan for 1-2y turnover; 90% free/reduced lunch — lower-income household profile, screen leases tightly.
- Zoned schools: Lewis And Clark Elem. (math 2% / reading 2%, grade F, #1,099 of 1,115 statewide, top 100%, 145 students, 98% FRL); Riverview Gardens Sr. High (math 2% / reading 18%, grade F, #501 of 521 statewide, top 97%, 1,331 students, 100% FRL).
- Market conditions: Rents rising fast (+5.0%/yr); 372 active listings in the ZIP; lower-income renter base — watch delinquency; 920 units permitted in St. Louis County in 2024 (250 in 5+ unit buildings).
- This rent runs 31% of the median local income ($41k/yr) — at the standard rent-burdened threshold; future hikes will face affordability resistance.
Forward outlook
- In year one you build about $4k of equity ($588 loan paydown + $3k appreciation (3.8% local appreciation)).
- At projected returns (3.8% appreciation + 5.0% rent growth), your $24k cash investment doubles in ~3 years — after that, you're playing with house money.
- By year 9, paydown + projected appreciation supports a ~$33k cash-out refi (75% LTV) — recoverable capital for the next deal without selling this one.
Negotiation context
- It's been on market 34 days — a 3% lower offer ($82k) is reasonable based on typical stale-listing flexibility.
- Current owner paid $10k; list at $85k implies a 795% gain — meaningful room to come down on a strong offer.
Risks & watch-outs
- Watch-outs: built in 1954 — expect roof / HVAC / electrical / plumbing capex.
- Climate carrying-cost: extreme-heat days projected 7→20/yr by 2055 (HVAC capex compounding) — expect insurance premiums to compound above CPI over the hold.
Questions for the listing agent
- It's been on market 34 days. Have you received any prior offers? Is the seller open to a 3% concession, seller financing, or rate buy-down credit?
- Built in 1954 — when were the roof, HVAC, electrical panel, plumbing, and water heater last replaced?
- Is there a deadline driving the sale (1031 exchange, divorce, estate, relocation)? That informs how much negotiation room exists.
- Schools are F-rated, which usually means shorter tenancies and higher turnover. Who's the typical renter profile here, and what's been the actual vacancy rate?
- What's the average days-on-market for RENTAL listings here right now (not sales)? A rising rental-DOM trend means longer vacancies and softer asking-rent achievability than the comps imply.
- What's the recent tenant-quality profile in this submarket — average credit score on applications, eviction rate, late-payment / NSF rate, and stable-employment percentage? A property-management company in the area should have these aggregated.
- How much new for-sale + rental construction is in the pipeline within 1–3 miles? Heavy new supply typically softens prices + rents 12–24 months out; constrained supply supports both.
Investment metrics
- 1% rule
- 1.26% ✓
- Cap rate
- 10.77%
- Cash-on-cash
- 15.99%
- DSCR
- 1.71
- GRM
- 6.6
CMA / ARV
- ARV (median comp)
- $55,169
- List price
- $85,000
- Delta
- 54.07%
- Verdict
- OVERPRICED
- Comps
- 20 within 1.0 mi
Show comp detail 7 sales within ~0.75 mi
| Address | Dist | Beds/Ba | Sqft | Sold | Price | $/sf | Match |
|---|---|---|---|---|---|---|---|
| 10040 Lord Dr | 0.26mi | 2/1.0 | 672 (+2%) | 4mo | $10,000 | $15 | 80 |
| 10167 Count Dr | 0.20mi | 2/1.0 | 624 (-5%) | 7mo | $69,900 | $112 | 76 |
| 10182 Count Dr | 0.19mi | 2/1.0 | 702 (+7%) | 17mo | $90,000 | $128 | 66 |
| 10417 Lord Dr | 0.32mi | 2/1.0 | 702 (+7%) | 11mo | $79,000 | $113 | 64 |
| 10140 Earl Dr | 0.09mi | 3/1.0 (+1) | 737 (+12%) | 10mo | $99,900 | $136 | 62 |
| 10353 Lord Dr | 0.26mi | 2/1.0 | 729 (+11%) | 14mo | $1,113,000 | $1,527 | 58 |
| 10437 Lord Dr | 0.35mi | 2/1.0 | 702 (+7%) | 17mo | $63,000 | $90 | 58 |
Match score weights: distance 35% · size 25% · config 20% · recency 20%. Top-matched comps best support the ARV.
Projected returns pro-forma
3.79% appreciation · 4.97% rent growth · sell at horizon
- IRR
- 25.4%
- Equity multiple
- 2.52×
- Total profit
- $36,196
- Equity at exit
- $42,057
- IRR
- 26.4%
- Equity multiple
- 5.19×
- Total profit
- $99,655
- Equity at exit
- $67,971
Cash invested: $23,800 (down + closing). Projections, not guarantees.
Landlord ↔ Tenant lean methodology
- Overall (STATE)
- 81 Strongly Landlord-Friendly
- State Missouri
- 81 Strongly Landlord-Friendly · R+10
- County
- — inherits STATE
- City
- — inherits STATE
ZIP-level market 63136
- Home prices YoY
- 0.9%
- Rents YoY
- 5.0%
- Active inventory
- 372
- Price-to-rent
- 6.6×
Monthly cashflow live
- Estimated rent
- $1,074 medium interval (Pro) →
- Mortgage (P&I)
- −$446
- Tax from tax record
- −$50 /mo · $598/yr
- Insurance
- −$35
- HOA
- −$0
- Vacancy / Maint / Mgmt
- −$225
- Net cashflow
- $317
Break-even live
UW: 25.0% down · 7.5% · 30yr · 1.5% tax · 5.0% vac · 8.0% maint · 8.0% mgmt
Financing live
Cash to close
- Down payment
- $21,250
- Closing costs
- $2,550
- Reserves months
- —
- Total cash needed
- —
Loan-product check · same deal, 3 products live
Conventional
25% down · 7.5% · 30yr
- Down + closing
- —
- Monthly P&I
- —
- Monthly cashflow
- —
- DSCR
- —
- Eligible?
- —
Personal DTI + credit; lowest rate.
DSCR
20% down · 8.5% · 30yr
- Down + closing
- —
- Monthly P&I
- —
- Monthly cashflow
- —
- DSCR
- —
- Eligible?
- —
No personal income docs; deal must DSCR.
Hard money
10% down · 12.0% · 12mo
- Down + closing
- —
- Monthly P&I
- —
- Monthly cashflow
- —
- DSCR
- —
- Eligible?
- —
Short-term bridge; refi at stabilization.
Listing history 18 events
-
2026-06-18days on market $85,000 Active 34 DOM
-
2026-06-17days on market $85,000 Active 33 DOM
-
2026-06-16days on market $85,000 Active 32 DOM
-
2026-06-15days on market $85,000 Active 31 DOM
-
2026-06-13days on market $85,000 Active 29 DOM
-
2026-06-13days on market $85,000 Active 28 DOM
-
2026-06-09days on market $85,000 Active 25 DOM
-
2026-06-08days on market $85,000 Active 24 DOM
-
2026-06-07days on market $85,000 Active 23 DOM
-
2026-06-05days on market $85,000 Active 20 DOM
-
2026-06-03days on market $85,000 Active 19 DOM
-
2026-06-02days on market $85,000 Active 18 DOM
-
2026-06-01days on market $85,000 Active 17 DOM
-
2026-05-31days on market $85,000 Active 16 DOM
-
2026-05-15$85,000 Active 1157-char remark
-
2004-04-30soldstatus $9,500
-
1991-01-01soldstatus
-
1990-11-01soldstatus
ⓘ Source: listings_history table (triggers on properties + properties_extension) + one-shot
backfill from property_details.listing_events for pre-trigger history.
Tax reassessment forecast MO · Resets to sale price
- Current annual tax
- $598 · $50/mo
- Projected year-2 tax
- $824 · $69/mo
- Expected delta
- +$227/yr (+$19/mo · 38.0%)
ⓘ Screening estimate from a state-policy table — verify with the county assessor before closing.
Climate risk First Street
- Flood 1/10 Low FEMA zone X (unshaded) · 0% chance over 30 yrs
- Wildfire 1/10 Low
- Heat 5/10 Major 7 d/yr ≥107°F today · 20 d/yr by 30 yrs out
- Wind 2/10 Low 100% chance of damaging wind over 30 yrs
- Air quality 4/10 Moderate 4 unhealthy d/yr today · 5 by 30 yrs out
Nearby sold comps map
Loading sold comps map…
Walkable amenities ~0.75 mi
Loading nearby amenities…
Taxation est. · year 1
- Rental income
- $12,883
- − Mortgage interest
- −$4,761
- − Property taxes
- −$598
- − Insurance
- −$425
- − Repairs & maintenance
- −$1,031
- − Management
- −$1,031
- − Depreciation
- −$2,473
- Taxable income
- $2,565
- Est. tax owed @ 24.0%
- −$616
- After-tax cash flow
- $3,190/yr
For passive investors: Depreciation is non-cash, so a rental often shows a tax loss while cash-flowing — sheltering income. Rental losses are passive: they offset passive income freely, and up to $25,000/yr can offset ordinary (W-2) income if you actively participate and your MAGI is under $100k (phasing out to $0 by $150k); unused losses carry forward. On sale, claimed depreciation is recaptured at up to 25%, and gains may owe capital-gains tax (a 1031 exchange can defer both). Figures are a year-1 estimate at your 24.0% rate — not tax advice; consult a CPA.
Schools (NCES district)
- District
- Riverview Gardens
- NCES district ID
- 2926670
- Math proficiency
- 2% ▼ -6.00%
- Reading proficiency
- 9% ▼ -6.00%
- Median HH income
- $32,759
- Composite
- 4.22/100
- National rank
- #10058
- State rank
- #324 of 324 in MO
Livability — Castle Point
- Score
- 64/100
- State rank
- #313
- US rank
- #14373
Category grades
Schools grade is shown separately in the Schools card above.
Census & demographics
- Census place
- Castle Point, MO
- County
- Saint Louis County · 888,823 people
- Metro
- St. Louis, MO-IL
- Population (ZIP)
- 40,929
- Household income
- $41,154
- Rent vs Own
- Severe rent burden
- 3085.0
Population outlook (St. Louis County) Hauer SSP2
- Today (2025)
- 1,025,227 people
- By 2030
- 1,028,023 · +0.3%
- By 2040
- 1,020,940 · -0.4%
- By 2050
- 1,007,280 · -1.8%
- By 2075
- 987,277 · -3.7%
- By 2100
- 921,984 · -10.1%
Race, ethnicity, and origin ACS 2023
- Neighborhood character
- Predominantly Black (90%)
- Race & ethnicity
- Black 90% White 5% Two or more races 3%
- Foreign-born
- 1% · Canada
Political lean MEDSL · St. Louis
- 2024 margin
- Strong D (+23.4) · D 60.8% · R 37.4% · Other 1.7%
- 2008→2024 swing
- +3.5pp toward D · 2008: 19.9pp · 2024: 23.4pp
- All cycles
- 2024: D+23.4 2020: D+24.0 2016: D+16.2 2012: D+13.7 2008: D+19.9
Not yet ingested
- Civics
- —
Market trends
- HPI YoY
- ▲ 3.79%
- Current HPI
- 420.28
- Rent YoY
- ▲ 4.97%
- Metro
- St. Louis, MO-IL
- State GDP YoY
- ▲ 1.84%
- F500 in state
- 20
Industry mix (Fortune 500 HQ in MO)
| Industry | F500 HQs | Revenue |
|---|---|---|
| Healthcare | 1 | $163B |
|
||
| Insurance | 1 | $21B |
|
||
| Industrial Technology | 1 | $17B |
|
||
| Retail | 1 | $16B |
|
||
| Industrial Distribution | 1 | $10B |
|
||
| Utilities | 1 | $9B |
|
||
Price history
+794.7% since first listed4 events — show timeline
- 2026-05-15 Listed $85,000 MARIS as Distributed by MLS Grid
- 2004-04-30 Sold (Public Records) $9,500 Public Records
- 1991-01-01 Sold (Public Records) — Public Records
- 1990-11-01 Sold (Public Records) — Public Records
Property tax history
-8.8%/yrLatest (2022): $598 · +0.4% YoY. Source: county tax records.
Cash-flow waterfall
monthlySold comps — $/sqft
last 12 mo · ≤1 miLoading sold comps…