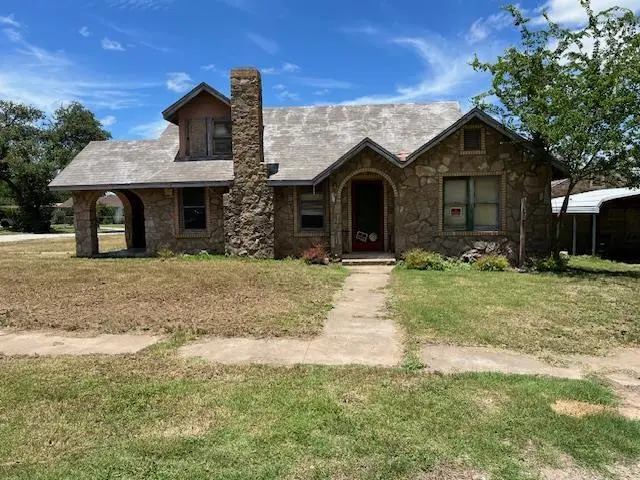
1421 S High St · Brady, TX
Flood risk 1/10 · Minimal
- FEMA flood zone
- X
- Chance of flooding over 30 yrs
- 0.0%
- Est. flood insurance / yr
- $507 – $1,088
Fire risk 5/10 · Moderate
- Est. fire insurance / yr
- $1,222 – $2,270
Heat risk 7/10 · Major
- Hot days now (above 105°F)
- 7 days/yr
- Hot days in 30 yrs
- 23 days/yr
Wind risk 6/10 · Moderate
- Chance of severe wind over 30 yrs
- 27.0%
Air-quality risk 1/10 · Minimal
- Unhealthy air days now
- 0 days/yr
- Unhealthy air days in 30 yrs
- 0 days/yr
Risk factors via First Street. Map © Google.
Why this score? — see what drove the B grade
The composite is a weighted blend of 9 inputs, each scored 0–100. Each bar is that input's sub-score; the figure is the points it added to the 100-point composite (weight × sub-score).
- Cash flow +23.1/30.0
- ARV discount +15.0/15.0
- Appreciation +8.3/10.0
- DSCR +7.4/10.0
- 1% rule +5.6/10.0
- Schools +4.0/10.0
- Livability +3.6/5.0
- Rent growth +2.5/5.0
- Condition / age +2.5/5.0
$89,500
🖨 Deal sheet 📄 Offer letter ✓ Due diligence
Listing remarks
1930 vintage rock home offering 1,397 sqft, 3 bedrooms, and 1 bathroom on a . 31-acre corner lot in Brady, Texas. This classic property features a welcoming living room with fireplace that flows into a formal dining area, maintaining the character and layout of its era. A standout detail is the original stonemason's unique signature—a built-in “doll piece” set into the stone archway on the front porch—adding rare historic charm. Ideal as a restoration project or investment property, this home offers solid bones, vintage craftsmanship, and plenty of potential on a spacious lot. Call to view today.
Key facts
- Historic charm
- Spacious lot
- Corner lot
Tags
Property features AI
Finance
- Other: Located in the Spiller subdivision
Exterior
- Parking: Gravel parking
- Utilities: Public water; Public sewer
- Home design: Single-family residence; Traditional/Other style; 2 stories
- Construction: Brick and stone construction; Composition and metal roof
- Exterior features: Level lot; Publicly maintained road access; Storage structure on property
Interior
- Flooring: Laminate; Wood
- Bathrooms: 1 full bathroom
- Heating & cooling: Natural gas heating; No cooling
- Interior features: Laminate and wood flooring; Natural gas heating; No central cooling
Neighborhood map
What this means for you Summary
Snapshot
- This is a 3-bed/1.0-bath single-family listed at $90k.
Deal economics
- At list price, monthly cash flow is $160 ($2k/yr) — positive.
- The deal already cash-flows at list — no discount required.
- Meets the 1% rule at list price ($950 rent vs $90k).
- Cap rate 8.4% vs local median 3.5% in Brady — top-decile yield for the area; either an underpriced asset or a hidden risk that comps aren't pricing in. Stress-test before assuming the spread holds.
Location & tenants
- Location reads 72/100 on livability (#270 in TX) — a middle-class / working-renter tenant base. Strengths: cost of living A+, housing A+, health & safety A+; Watch: employment D, schools D-, amenities F.
- Brady ISD (rural): math 50% / reading 46% proficiency, ranked #238 of 826 in TX (top 29%) — families likely to look elsewhere, expect single-tenant / working-renter base with shorter leases.
- Market conditions: 105 active listings in the ZIP; 1 comparable units currently listed for rent nearby; 2 units permitted in McCulloch County in 2024 (0 in 5+ unit buildings).
Forward outlook
- In year one you build about $6k of equity ($619 loan paydown + $6k appreciation (6.5% local appreciation)).
- At projected returns (6.5% appreciation + 3.0% rent growth), your $25k cash investment doubles in ~3 years — after that, you're playing with house money.
- By year 6, paydown + projected appreciation supports a ~$35k cash-out refi (75% LTV) — recoverable capital for the next deal without selling this one.
Negotiation context
- Only 6 days on market — expect competitive offers; lowballing is unlikely to land.
Risks & watch-outs
- Watch-outs: built in 1930 — expect roof / HVAC / electrical / plumbing capex.
- Climate carrying-cost: major wind risk, 27% chance of damaging wind over 30y; moderate wildfire risk; extreme-heat days projected 7→23/yr by 2055 (HVAC capex compounding) — expect insurance premiums to compound above CPI over the hold.
Questions for the listing agent
- Built in 1930 — when were the roof, HVAC, electrical panel, plumbing, and water heater last replaced?
- Is there a deadline driving the sale (1031 exchange, divorce, estate, relocation)? That informs how much negotiation room exists.
- Schools are D-rated, which usually means shorter tenancies and higher turnover. Who's the typical renter profile here, and what's been the actual vacancy rate?
- What's the average days-on-market for RENTAL listings here right now (not sales)? A rising rental-DOM trend means longer vacancies and softer asking-rent achievability than the comps imply.
- What's the recent tenant-quality profile in this submarket — average credit score on applications, eviction rate, late-payment / NSF rate, and stable-employment percentage? A property-management company in the area should have these aggregated.
- How much new for-sale + rental construction is in the pipeline within 1–3 miles? Heavy new supply typically softens prices + rents 12–24 months out; constrained supply supports both.
Investment metrics
- 1% rule
- 1.06% ✓
- Cap rate
- 8.44%
- Cash-on-cash
- 7.67%
- DSCR
- 1.34
- GRM
- 7.9
CMA / ARV
- ARV (on-the-fly)
- $140,774
- Comps found
- 12
Show comp detail 12 sales within ~0.75 mi
| Address | Dist | Beds/Ba | Sqft | Sold | Price | $/sf | Match |
|---|---|---|---|---|---|---|---|
| 1408 Bridge | 0.08mi | 2/2.0 (-1) | 1,130 (-5%) | 5mo | $155,000 | $137 | 74 |
| 310 Otte | 0.34mi | 3/2.0 | 1,171 (-2%) | 4mo | $130,000 | $111 | 74 |
| 1701 S High St | 0.16mi | 2/1.5 (-1) | 1,173 (-2%) | 15mo | $139,000 | $118 | 70 |
| 909 Calcutta | 0.44mi | 3/2.0 | 1,174 (-2%) | 6mo | $130,000 | $111 | 68 |
| 1019 W 11 St | 0.61mi | 3/1.5 | 1,196 (+0%) | 4mo | $160,000 | $134 | 66 |
| 900 S Cypress St | 0.46mi | 3/1.0 | 1,232 (+3%) | 10mo | $30,000 | $24 | 64 |
| 1815 S Oak St | 0.39mi | 3/2.0 | 1,314 (+10%) | 1mo | $179,000 | $136 | 60 |
| 405 E 5th St | 0.64mi | 3/2.0 | 1,156 (-3%) | 2mo | $69,000 | $60 | 59 |
| 1604 S Blackburn St | 0.15mi | 2/1.0 (-1) | 1,080 (-10%) | 18mo | $99,900 | $93 | 57 |
| 611 Poplar | 0.65mi | 2/2.0 (-1) | 1,180 (-1%) | 3mo | $185,000 | $157 | 57 |
| 1807 S Bradley | 0.27mi | 2/1.0 (-1) | 1,024 (-14%) | 9mo | $129,900 | $127 | 51 |
| 1205 S Cypress | 0.27mi | 2/1.0 (-1) | 1,319 (+11%) | 18mo | $112,000 | $85 | 50 |
Match score weights: distance 35% · size 25% · config 20% · recency 20%. Top-matched comps best support the ARV.
Projected returns pro-forma
6.53% appreciation · 3.0% rent growth · sell at horizon
- IRR
- 22.8%
- Equity multiple
- 2.55×
- Total profit
- $38,875
- Equity at exit
- $59,275
- IRR
- 21.4%
- Equity multiple
- 5.22×
- Total profit
- $105,693
- Equity at exit
- $110,193
Cash invested: $25,060 (down + closing). Projections, not guarantees.
Landlord ↔ Tenant lean methodology
- Overall (STATE)
- 87 Strongly Landlord-Friendly
- State Texas
- 87 Strongly Landlord-Friendly · R+5
- County
- — inherits STATE
- City
- — inherits STATE
ZIP-level market 76825
- Home prices YoY
- 4.2%
- Active inventory
- 105
- Price-to-rent
- 7.9×
Monthly cashflow live
- Estimated rent
- $950 medium interval (Pro) →
- Mortgage (P&I)
- −$469
- Tax from tax record
- −$84 /mo · $1,003/yr
- Insurance
- −$37
- HOA
- −$0
- Vacancy / Maint / Mgmt
- −$200
- Net cashflow
- $160
Break-even live
UW: 25.0% down · 7.5% · 30yr · 1.5% tax · 5.0% vac · 8.0% maint · 8.0% mgmt
Financing live
Cash to close
- Down payment
- $22,375
- Closing costs
- $2,685
- Reserves months
- —
- Total cash needed
- —
Loan-product check · same deal, 3 products live
Conventional
25% down · 7.5% · 30yr
- Down + closing
- —
- Monthly P&I
- —
- Monthly cashflow
- —
- DSCR
- —
- Eligible?
- —
Personal DTI + credit; lowest rate.
DSCR
20% down · 8.5% · 30yr
- Down + closing
- —
- Monthly P&I
- —
- Monthly cashflow
- —
- DSCR
- —
- Eligible?
- —
No personal income docs; deal must DSCR.
Hard money
10% down · 12.0% · 12mo
- Down + closing
- —
- Monthly P&I
- —
- Monthly cashflow
- —
- DSCR
- —
- Eligible?
- —
Short-term bridge; refi at stabilization.
Rent comps 1 comps
| Address | Beds | Baths | Sqft | Rent | $/sqft | DOM | Units | Dist |
|---|---|---|---|---|---|---|---|---|
| 2030 Menard Hwy Unit 6 Brady, TX | 2.0 | 1.0 | 804 | $950 | $1.18 | 43d | 1 | 0.65mi |
Listing history 6 events
-
2026-06-18days on market $89,500 Active 6 DOM
-
2026-06-17days on market $89,500 Active 5 DOM
-
2026-06-16days on market $89,500 Active 4 DOM
-
2026-06-15days on market $89,500 Active 3 DOM
-
2026-06-12remarks 603-char remark
-
2026-06-12$89,500 Active 1 DOM
ⓘ Source: listings_history table (triggers on properties + properties_extension) + one-shot
backfill from property_details.listing_events for pre-trigger history.
Tax reassessment forecast TX · Resets to sale price
- Current annual tax
- $1,003 · $84/mo
- Projected year-2 tax
- $1,638 · $136/mo
- Expected delta
- +$635/yr (+$53/mo · 63.2%)
ⓘ Screening estimate from a state-policy table — verify with the county assessor before closing.
Climate risk First Street
- Flood 1/10 Low FEMA zone X · 0% chance over 30 yrs
- Wildfire 5/10 Major
- Heat 7/10 Severe 7 d/yr ≥105°F today · 23 d/yr by 30 yrs out
- Wind 6/10 Major 27% chance of damaging wind over 30 yrs
- Air quality 1/10 Low 0 unhealthy d/yr today · 0 by 30 yrs out
Nearby sold comps map
Loading sold comps map…
Walkable amenities ~0.75 mi
Loading nearby amenities…
Taxation est. · year 1
- Rental income
- $11,400
- − Mortgage interest
- −$5,013
- − Property taxes
- −$1,003
- − Insurance
- −$448
- − Repairs & maintenance
- −$912
- − Management
- −$912
- − Depreciation
- −$2,604
- Taxable income
- $508
- Est. tax owed @ 24.0%
- −$122
- After-tax cash flow
- $1,801/yr
For passive investors: Depreciation is non-cash, so a rental often shows a tax loss while cash-flowing — sheltering income. Rental losses are passive: they offset passive income freely, and up to $25,000/yr can offset ordinary (W-2) income if you actively participate and your MAGI is under $100k (phasing out to $0 by $150k); unused losses carry forward. On sale, claimed depreciation is recaptured at up to 25%, and gains may owe capital-gains tax (a 1031 exchange can defer both). Figures are a year-1 estimate at your 24.0% rate — not tax advice; consult a CPA.
Schools (NCES district)
- District
- Brady ISD
- NCES district ID
- 4811110
- Math proficiency
- 50% ▼ -2.00%
- Reading proficiency
- 46% ▲ 2.00%
- Median HH income
- $38,179
- Composite
- 40.02/100
- National rank
- #3826
- State rank
- #238 of 826 in TX
Livability — Brady
- Score
- 72/100
- State rank
- #270
- US rank
- #6336
Category grades
Schools grade is shown separately in the Schools card above.
Census & demographics
- Census place
- Brady, TX
- Population (ZIP)
- 6,595
Population outlook (McCulloch County) Hauer SSP2
- Today (2025)
- 8,509 people
- By 2030
- 8,544 · +0.4%
- By 2040
- 8,555 · +0.5%
- By 2050
- 8,486 · -0.3%
- By 2075
- 8,089 · -4.9%
- By 2100
- 6,599 · -22.4%
Race, ethnicity, and origin ACS 2023
- Neighborhood character
- Majority White (60%)
- Race & ethnicity
- White 60% Hispanic / Latino 33% Two or more races 21%
- Hispanic origin (detail)
- Mexican 30%
- Common ancestry
- Italian 8% Lithuanian 3% Portuguese 2%
- Foreign-born
- 6% · Canada, Vietnam
- Languages at home
- 72% English-only · Spanish 27%
Political lean MEDSL · McCulloch
- 2024 margin
- Solid R (+73.4) · D 12.9% · R 86.3%
- 2008→2024 swing
- -22.4pp toward R · 2008: -51.0pp · 2024: -73.4pp
- All cycles
- 2024: R+73.4 2020: R+70.3 2016: R+67.0 2012: R+62.9 2008: R+51.0
Not yet ingested
- Civics
- —
Market trends
- HPI YoY
- ▲ 6.53%
- Current HPI
- 161.5061
- Rent YoY
- —
- Metro
- —
- State GDP YoY
- ▲ 3.95%
- F500 in state
- 110
Industry mix (Fortune 500 HQ in TX)
| Industry | F500 HQs | Revenue |
|---|---|---|
| Energy | 16 | $1,198B |
|
||
| Technology | 5 | $198B |
|
||
| Engineering / Construction | 4 | $72B |
|
||
| Energy Services | 3 | $60B |
|
||
| Utilities | 3 | $41B |
|
||
| Healthcare | 2 | $330B |
|
||
Price history
4 events — show timeline
- 2026-06-12 Listed $89,500 CHCMLS
- 1999-03-02 Sold (Public Records) — Public Records
- 1996-10-11 Sold (Public Records) — Public Records
- 1995-10-27 Sold (Public Records) — Public Records
Property tax history
+3.3%/yrLatest (2025): $1,003 · +27.4% YoY. Source: county tax records.
Cash-flow waterfall
monthlySold comps — $/sqft
last 12 mo · ≤1 miLoading sold comps…