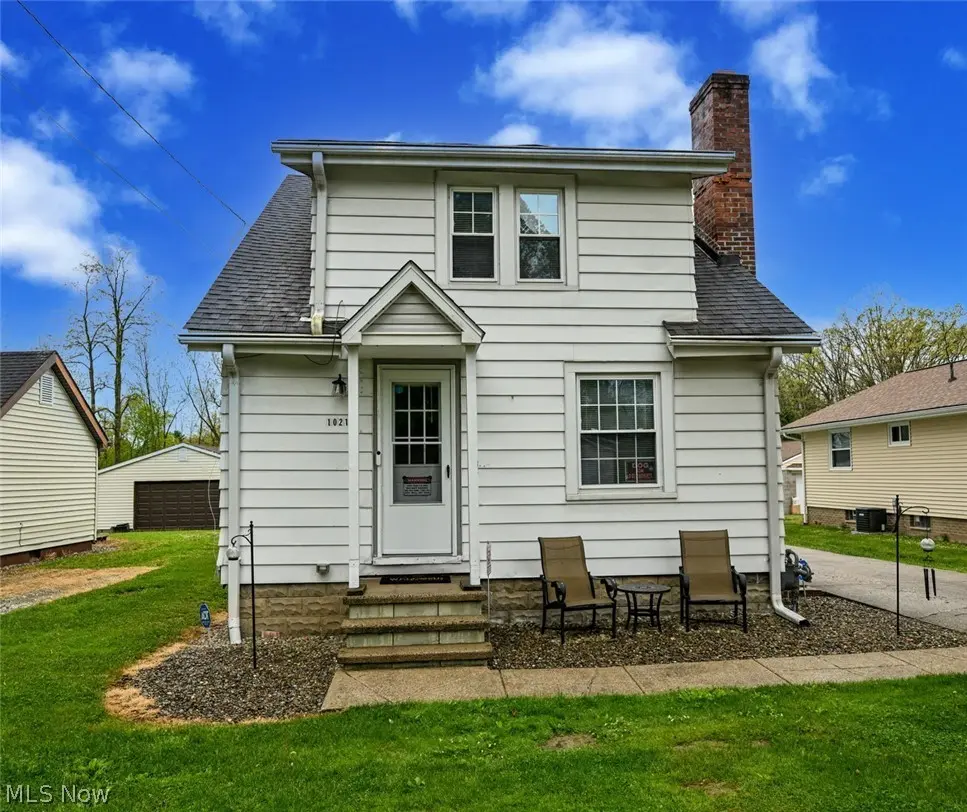
1021 East Blvd · Aurora, OH
Flood risk 1/10 · Minimal
- FEMA flood zone
- X (unshaded)
- Chance of flooding over 30 yrs
- 0.0%
- Est. flood insurance / yr
- $473 – $860
Fire risk 1/10 · Minimal
- Est. fire insurance / yr
- $713 – $1,323
Heat risk 2/10 · Minimal
- Hot days now (above 96°F)
- 7 days/yr
- Hot days in 30 yrs
- 17 days/yr
Wind risk 1/10 · Minimal
- Chance of severe wind over 30 yrs
- —
Air-quality risk 3/10 · Minor
- Unhealthy air days now
- 2 days/yr
- Unhealthy air days in 30 yrs
- 3 days/yr
Risk factors via First Street. Map © Google.
Why this score? — see what drove the A- grade
The composite is a weighted blend of 9 inputs, each scored 0–100. Each bar is that input's sub-score; the figure is the points it added to the 100-point composite (weight × sub-score).
- Cash flow +30.0/30.0
- ARV discount +15.0/15.0
- DSCR +10.0/10.0
- 1% rule +9.9/10.0
- Schools +7.2/10.0
- Livability +3.8/5.0
- Rent growth +2.5/5.0
- Condition / age +2.5/5.0
- Appreciation +0.0/10.0
$185,000
🖨 Deal sheet 📄 Offer letter ✓ Due diligence
Listing remarks
Charming century home in the heart of Aurora offering over 1,700 sq ft of living space. Full of character and potential, this home features spacious living areas, open floor plan (especially for a century home), 2 Car garage, and a full basement. Historic charm is abundant throughout this lovely home. Updated Main bath and carpeting on the second level, Situated on a spacious private lot on desirable East Blvd, conveniently located near schools, shopping, dining, parks, and major highways. Great opportunity at a GREAT price! Make your appointment today before it's too late!
Key facts
- 0.28 acre lot
- 2 garage spots
- Built 1900
Property features AI
Exterior
- Parking: Detached garage (2 spaces); Detached carport (2 spaces)
- Utilities: Public water; Public sewer
- Home design: Two-story home; Frame construction; Block foundation; Asphalt/fiberglass roof
- Construction: Built per public records; Frame construction; Block foundation; Asphalt and fiberglass roof
- Exterior features: Private lot; Patio
Interior
- Kitchen: Eat-in kitchen (11 x 10)
- Bedrooms: Second-floor bedroom (13 x 12); Second-floor bedroom (13 x 12); First-floor bedroom (14 x 13); Main level bedroom (1 on main level)
- Bathrooms: 1 full bathroom
- Heating & cooling: Forced air heating (gas); Central air conditioning
- Interior features: Built-in bookcases; Eat-in kitchen; Decorative fireplace; Full unfinished basement
- Laundry & utility: Laundry in basement
Neighborhood map
What this means for you Summary
Snapshot
- This is a 4-bed/1.0-bath single-family listed at $185k.
Deal economics
- At list price, monthly cash flow is $891 ($11k/yr) — positive.
- The deal already cash-flows at list — no discount required.
- Meets the 1% rule at list price ($3k rent vs $185k).
- Cap rate 12.1% vs local median 2.5% in Aurora — top-decile yield for the area; either an underpriced asset or a hidden risk that comps aren't pricing in. Stress-test before assuming the spread holds.
Location & tenants
- Location reads 75/100 on livability (#258 in OH, #4,104 nationally) — a middle-class / working-renter tenant base. Strengths: schools A+, crime A+, employment A+; Watch: amenities F, commute F, health & safety F.
- Aurora City (suburban): math 79% / reading 84% proficiency, ranked #35 of 656 in OH (top 5%) — strong family-tenant draw, lease renewals of 3-5y typical; only 7% free/reduced lunch — higher-income household profile.
- Market conditions: 135 active listings in the ZIP; 3 comparable units currently listed for rent nearby; rentals leasing fast (median 3d on market — plan ~1-2 weeks tenant-placement turnaround); high-income renter base; 196 units permitted in Portage County in 2024 (10 in 5+ unit buildings).
Forward outlook
- Local home prices are declining (-3.0%/yr); year-one equity from $1k of loan paydown is wiped out by about $6k of value loss. Plan a longer hold.
- At projected returns (-3.0% appreciation + 3.0% rent growth), your $52k cash investment doubles in ~6 years — after that, you're playing with house money.
Negotiation context
- Only 8 days on market — expect competitive offers; lowballing is unlikely to land.
- Current owner paid $100k; list at $185k implies a 85% gain — meaningful room to come down on a strong offer.
Risks & watch-outs
- Watch-outs: built in 1900 — expect roof / HVAC / electrical / plumbing capex.
Questions for the listing agent
- Built in 1900 — when were the roof, HVAC, electrical panel, plumbing, and water heater last replaced?
- Is there a deadline driving the sale (1031 exchange, divorce, estate, relocation)? That informs how much negotiation room exists.
- Schools are A-rated — typically a magnet for longer-tenancy family renters. What's the average tenant stay here, and is there a school-zone premium baked into asking?
- What's the average days-on-market for RENTAL listings here right now (not sales)? A rising rental-DOM trend means longer vacancies and softer asking-rent achievability than the comps imply.
- What's the recent tenant-quality profile in this submarket — average credit score on applications, eviction rate, late-payment / NSF rate, and stable-employment percentage? A property-management company in the area should have these aggregated.
- How much new for-sale + rental construction is in the pipeline within 1–3 miles? Heavy new supply typically softens prices + rents 12–24 months out; constrained supply supports both.
Investment metrics
- 1% rule
- 1.49% ✓
- Cap rate
- 12.07%
- Cash-on-cash
- 20.65%
- DSCR
- 1.92
- GRM
- 5.6
CMA / ARV
- ARV (median comp)
- $245,895
- List price
- $185,000
- Delta
- -24.76%
- Verdict
- UNDERPRICED
- Comps
- 20 within 1.0 mi
Show comp detail 12 sales within ~0.75 mi
| Address | Dist | Beds/Ba | Sqft | Sold | Price | $/sf | Match |
|---|---|---|---|---|---|---|---|
| 990 East Blvd | 0.06mi | 3/2.5 (-1) | 1,686 (-5%) | 10mo | $280,000 | $166 | 70 |
| 1177 Moneta Ave | 0.42mi | 4/2.0 | 1,660 (-6%) | 3mo | $283,000 | $170 | 64 |
| 1105 East Blvd | 0.16mi | 3/1.5 (-1) | 1,944 (+10%) | 11mo | $240,000 | $123 | 60 |
| 806 Nautilus Trl | 0.45mi | 4/2.5 | 1,904 (+7%) | 9mo | $485,000 | $255 | 53 |
| 10524 California St | 0.55mi | 3/2.5 (-1) | 1,770 (-0%) | 12mo | $345,000 | $195 | 53 |
| 10488 California St | 0.52mi | 3/2.0 (-1) | 1,634 (-8%) | 4mo | $280,000 | $171 | 51 |
| 10541 Maryland St | 0.65mi | 3/2.0 (-1) | 1,800 (+2%) | 11mo | $410,000 | $228 | 49 |
| 10487 Florida St | 0.54mi | 3/2.0 (-1) | 1,650 (-7%) | 7mo | $315,000 | $191 | 49 |
| 10496 Florida St | 0.59mi | 4/2.0 | 1,920 (+8%) | 9mo | $314,000 | $164 | 47 |
| 843 Nautilus Trl | 0.51mi | 4/3.5 | 1,956 (+10%) | 7mo | $640,000 | $327 | 43 |
| 745 Mcroberts Ave | 0.46mi | 3/3.0 (-1) | 1,608 (-9%) | 11mo | $315,000 | $196 | 41 |
| 3886 Commodore Cv E | 0.64mi | 3/2.5 (-1) | 1,612 (-9%) | 7mo | $330,000 | $205 | 38 |
Match score weights: distance 35% · size 25% · config 20% · recency 20%. Top-matched comps best support the ARV.
Projected returns pro-forma
-3.0% appreciation · 3.0% rent growth · sell at horizon
- IRR
- 13.0%
- Equity multiple
- 1.52×
- Total profit
- $26,837
- Equity at exit
- $27,584
- IRR
- 21.9%
- Equity multiple
- 2.87×
- Total profit
- $96,663
- Equity at exit
- $15,995
Cash invested: $51,800 (down + closing). Projections, not guarantees.
Landlord ↔ Tenant lean methodology
- Overall (STATE)
- 73 Landlord-Friendly
- State Ohio
- 73 Landlord-Friendly · R+6
- County
- — inherits STATE
- City
- — inherits STATE
ZIP-level market 44202
- Active inventory
- 135
- Price-to-rent
- 5.6×
Monthly cashflow live
- Estimated rent
- $2,761 medium interval (Pro) →
- Mortgage (P&I)
- −$970
- Tax from tax record
- −$242 /mo · $2,908/yr
- Insurance
- −$77
- HOA
- −$0
- Vacancy / Maint / Mgmt
- −$580
- Net cashflow
- $891
Break-even live
UW: 25.0% down · 7.5% · 30yr · 1.5% tax · 5.0% vac · 8.0% maint · 8.0% mgmt
Financing live
Cash to close
- Down payment
- $46,250
- Closing costs
- $5,550
- Reserves months
- —
- Total cash needed
- —
Loan-product check · same deal, 3 products live
Conventional
25% down · 7.5% · 30yr
- Down + closing
- —
- Monthly P&I
- —
- Monthly cashflow
- —
- DSCR
- —
- Eligible?
- —
Personal DTI + credit; lowest rate.
DSCR
20% down · 8.5% · 30yr
- Down + closing
- —
- Monthly P&I
- —
- Monthly cashflow
- —
- DSCR
- —
- Eligible?
- —
No personal income docs; deal must DSCR.
Hard money
10% down · 12.0% · 12mo
- Down + closing
- —
- Monthly P&I
- —
- Monthly cashflow
- —
- DSCR
- —
- Eligible?
- —
Short-term bridge; refi at stabilization.
Rent comps 3 comps
| Address | Beds | Baths | Sqft | Rent | $/sqft | DOM | Units | Dist |
|---|---|---|---|---|---|---|---|---|
| 1177 Moneta Ave Aurora, OH | 4.0 | 2.0 | 1660 | $2,500 | $1.51 | 43d | 1 | 0.42mi |
| 7340 Ferris ST Aurora, OH | 3.0 | 1.0–3.0 | 1138 | $3,230 | $2.84 | 1d | 1 | 0.60mi |
| 10188 Anchorage Cv Aurora, OH | 3.0 | 1.5 | 1268 | $2,850 | $2.25 | 3d | 1 | 0.87mi |
Listing history 2 events
-
2026-05-15$185,000 Active 581-char remark
-
2019-06-27soldstatus $100,000
ⓘ Source: listings_history table (triggers on properties + properties_extension) + one-shot
backfill from property_details.listing_events for pre-trigger history.
Tax reassessment forecast OH · Partial reset (capped growth)
- Current annual tax
- $2,908 · $242/mo
- Projected year-2 tax
- $2,908 · $242/mo
- Expected delta
- $0/yr ($0/mo · 0.0%)
ⓘ Screening estimate from a state-policy table — verify with the county assessor before closing.
Climate risk First Street
- Flood 1/10 Low FEMA zone X (unshaded) · 0% chance over 30 yrs
- Wildfire 1/10 Low
- Heat 2/10 Low 7 d/yr ≥96°F today · 17 d/yr by 30 yrs out
- Wind 1/10 Low
- Air quality 3/10 Moderate 2 unhealthy d/yr today · 3 by 30 yrs out
Nearby sold comps map
Loading sold comps map…
Walkable amenities ~0.75 mi
Loading nearby amenities…
Taxation est. · year 1
- Rental income
- $33,127
- − Mortgage interest
- −$10,363
- − Property taxes
- −$2,908
- − Insurance
- −$925
- − Repairs & maintenance
- −$2,650
- − Management
- −$2,650
- − Depreciation
- −$5,382
- Taxable income
- $8,249
- Est. tax owed @ 24.0%
- −$1,980
- After-tax cash flow
- $8,716/yr
For passive investors: Depreciation is non-cash, so a rental often shows a tax loss while cash-flowing — sheltering income. Rental losses are passive: they offset passive income freely, and up to $25,000/yr can offset ordinary (W-2) income if you actively participate and your MAGI is under $100k (phasing out to $0 by $150k); unused losses carry forward. On sale, claimed depreciation is recaptured at up to 25%, and gains may owe capital-gains tax (a 1031 exchange can defer both). Figures are a year-1 estimate at your 24.0% rate — not tax advice; consult a CPA.
Schools (NCES district)
- District
- Aurora City
- NCES district ID
- 3904917
- Math proficiency
- 79% ▼ -7.00%
- Reading proficiency
- 84% ▼ -5.00%
- Median HH income
- $81,791
- Composite
- 71.93/100
- National rank
- #213
- State rank
- #35 of 656 in OH
Livability — Aurora
- Score
- 75/100
- State rank
- #258
- US rank
- #4104
Category grades
Schools grade is shown separately in the Schools card above.
Census & demographics
- Census place
- Aurora, OH
- County
- Portage · 165,699 people
- City population
- 22,857
- Metro
- Akron, OH
- Population (ZIP)
- 22,857
- Household income
- $116,556
- Rent vs Own
- Severe rent burden
- 4.9
Population outlook (Portage County) Hauer SSP2
- Today (2025)
- 166,109 people
- By 2030
- 167,752 · +1.0%
- By 2040
- 168,640 · +1.5%
- By 2050
- 167,469 · +0.8%
- By 2075
- 170,131 · +2.4%
- By 2100
- 167,958 · +1.1%
Race, ethnicity, and origin ACS 2023
- Neighborhood character
- Predominantly White (87%)
- Race & ethnicity
- White 87% Asian 4% Two or more races 4% Black 3%
- Common ancestry
- Romanian 9% Italian 3% Lithuanian 2%
- Foreign-born
- 6% · Canada, China, South Korea
- Languages at home
- 94% English-only · Other Indo-European 2% Other Asian/Pacific 1% Russian/Polish/Slavic 1%
Political lean MEDSL · Portage
- 2024 margin
- R (+15.5) · D 41.8% · R 57.3%
- 2008→2024 swing
- -24.5pp toward R · 2008: 9.0pp · 2024: -15.5pp
- All cycles
- 2024: R+15.5 2020: R+12.5 2016: R+10.2 2012: D+4.9 2008: D+9.0
Not yet ingested
- Civics
- —
Market trends
- HPI YoY
- ▼ -270.23%
- Current HPI
- 186.4919
- Rent YoY
- —
- Metro
- —
- State GDP YoY
- ▲ 1.98%
- F500 in state
- 48
Industry mix (Fortune 500 HQ in OH)
| Industry | F500 HQs | Revenue |
|---|---|---|
| Insurance | 3 | $145B |
|
||
| Industrial Machinery | 3 | $49B |
|
||
| Financial Services | 3 | $24B |
|
||
| Consumer Goods | 2 | $93B |
|
||
| Aerospace / Defense | 2 | $47B |
|
||
| Utilities | 2 | $33B |
|
||
Price history
+85.0% since first listed3 events — show timeline
- 2026-05-24 Pending — MLSNOW
- 2026-05-15 Listed $185,000 MLSNOW
- 2019-06-27 Sold (Public Records) $100,000 Public Records
Property tax history
+6.4%/yrLatest (2025): $2,908 · +1.2% YoY. Source: county tax records.
Cash-flow waterfall
monthlySold comps — $/sqft
last 12 mo · ≤1 miLoading sold comps…