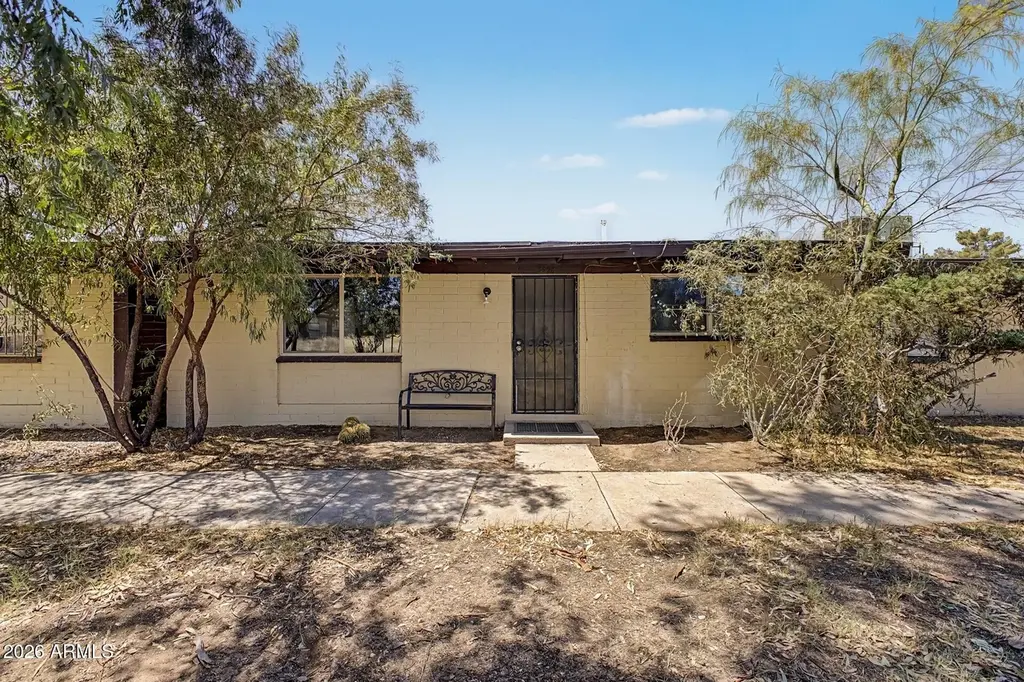
3998 S Evergreen Ave · Tucson, AZ
Flood risk 1/10 · Minimal
- FEMA flood zone
- X (unshaded)
- Chance of flooding over 30 yrs
- 0.0%
- Est. flood insurance / yr
- $507 – $1,088
Fire risk 5/10 · Moderate
- Est. fire insurance / yr
- $610 – $1,132
Heat risk 7/10 · Major
- Hot days now (above 104°F)
- 6 days/yr
- Hot days in 30 yrs
- 17 days/yr
Wind risk 1/10 · Minimal
- Chance of severe wind over 30 yrs
- —
Air-quality risk 1/10 · Minimal
- Unhealthy air days now
- 0 days/yr
- Unhealthy air days in 30 yrs
- 0 days/yr
Risk factors via First Street. Map © Google.
Why this score? — see what drove the D grade
The composite is a weighted blend of 9 inputs, each scored 0–100. Each bar is that input's sub-score; the figure is the points it added to the 100-point composite (weight × sub-score).
- ARV discount +15.0/15.0
- Cash flow +11.7/30.0
- Livability +3.7/5.0
- DSCR +3.4/10.0
- Rent growth +2.5/5.0
- Condition / age +2.5/5.0
- 1% rule +2.2/10.0
- Schools +1.6/10.0
- Appreciation +0.0/10.0
$195,000
🖨 Deal sheet (PDF) 📄 Offer letter ✓ Due diligence
Listing remarks MLS
Welcome home to this charming and spacious single-level residence offering comfortable living and thoughtful updates throughout. Step inside to a bright open floor plan featuring stylish wood-look flooring, neutral tones, and an expansive living area perfect for relaxing or entertaining. The oversized kitchen is a standout with abundant cabinetry, generous counter space, stainless steel appliances, dining area, and a movable center island for added flexibility. Spacious bedrooms offer comfort and versatility, while the updated bath adds a fresh modern touch. Enjoy seamless indoor-outdoor living with French doors leading to a covered patio, private fenced yard, storage shed, and plenty of room to garden, play, or unwind. Conveniently located and move-in ready!
Key facts
- Functional kitchen
- Backyard room
- Bright layout
Tags
Property features AI
Finance
- Other: Lot size reported as 2,364 (source: assessor)
- HOA & community: No association fees
Exterior
- Parking: 1 covered parking space; 1 carport space
- Utilities: City water; Public sewer
- Home design: Single-family residence; Fee simple ownership
- Construction: Stucco and wood-frame construction; Composition roof
- Exterior features: Chain link fencing; Lot features: none
Interior
- Kitchen: Refrigerator; Dishwasher; Garbage disposal
- Bedrooms: 2 bedrooms
- Bathrooms: 2 full bathrooms
- Heating & cooling: Central air conditioning; Heating present
- Interior features: Eat-in kitchen; Primary bedroom with full bathroom
Neighborhood map
What this means for you Summary
Snapshot
- This is a 2-bed/2.0-bath single-family listed at $195k.
Deal economics
- At list price, monthly cash flow is $-57 ($-682/yr) — negative.
- To cash-flow at today's rent, offer at most $185k (5.2% below list).
- To meet the 1% rule (rent ≥ 1% of price), the offer needs to be $140k (28.2% below list).
- Recommended offer: $140k (28.2% below list) — sets the bar for 1% rule.
- Cap rate 5.9% vs local median 3.7% in Tucson — top-decile yield for the area; either an underpriced asset or a hidden risk that comps aren't pricing in. Stress-test before assuming the spread holds.
Location & tenants
- Location reads 74/100 on livability (#17 in AZ, #4,502 nationally) — a middle-class / working-renter tenant base. Strengths: commute A+, cost of living A+, housing A+; Watch: health & safety C-, crime F, employment D-.
- Tucson Unified District (4403) (urban): math 14% / reading 23% proficiency, ranked #190 of 249 in AZ (top 76%) — low school quality limits family demand, transient renter base, plan for 1-2y turnover.
- Zoned schools: Irene Erickson Elementary School (math 8% / reading 17%, grade F, #944 of 1,109 statewide, top 87%, 383 students, 78% FRL); Secrist Middle School (math 2% / reading 17%, grade F, #194 of 218 statewide, top 90%, 304 students, 76% FRL); Santa Rita High School (math 8% / reading 8%, grade F, #358 of 381 statewide, top 94%, 392 students, 63% FRL).
- Market conditions: Rents soft (-0.2%/yr); 198 active listings in the ZIP; 35 comparable units currently listed for rent nearby; rentals at typical pace (median 23d on market — plan ~3-4 weeks tenant-placement turnaround); 5,268 units permitted in Pima County in 2024 (996 in 5+ unit buildings).
Forward outlook
- Local home prices are declining (-3.0%/yr); year-one equity from $1k of loan paydown is wiped out by about $6k of value loss. Plan a longer hold.
- Pima County population projected at +8% by 2050 — modest demand growth; plan on rents tracking national, not racing it.
Negotiation context
- It's been on market 60 days — a 3% lower offer ($189k) is reasonable based on typical stale-listing flexibility.
- 9 sale attempts since 21y ago with the ask held roughly flat each time — persistent listings suggest the price (not the market) is what's stuck; bring a comps-based counter.
- Current owner paid $155k; 26% above their basis — modest negotiation headroom, anchor on the comps not their cost.
Risks & watch-outs
- Climate carrying-cost: moderate wildfire risk; extreme-heat days projected 6→17/yr by 2055 (HVAC capex compounding) — expect insurance premiums to compound above CPI over the hold.
Questions for the listing agent
- What do current leases actually rent for vs. the listed asking? Can we see a recent rent roll and the last 12 months of T-12 income?
- It's been on market 60 days. Have you received any prior offers? Is the seller open to a 28% concession, seller financing, or rate buy-down credit?
- Built in 1972 — when were the roof, HVAC, electrical panel, plumbing, and water heater last replaced?
- Is there a deadline driving the sale (1031 exchange, divorce, estate, relocation)? That informs how much negotiation room exists.
- Schools are D-rated, which usually means shorter tenancies and higher turnover. Who's the typical renter profile here, and what's been the actual vacancy rate?
- Crime grade is F in this area — have there been break-ins, vandalism, or insurance claims at this property in the last 3 years? What carrier currently insures it and at what premium?
- The area grade is low — what's the realistic commute time and amenity access for the typical tenant pool here? Any planned neighborhood developments (good or bad) we should know about?
- What's the average days-on-market for RENTAL listings here right now (not sales)? A rising rental-DOM trend means longer vacancies and softer asking-rent achievability than the comps imply.
- What's the recent tenant-quality profile in this submarket — average credit score on applications, eviction rate, late-payment / NSF rate, and stable-employment percentage? A property-management company in the area should have these aggregated.
- How much new for-sale + rental construction is in the pipeline within 1–3 miles? Heavy new supply typically softens prices + rents 12–24 months out; constrained supply supports both.
Investment metrics
- 1% rule
- 0.72% ✗
- Cap rate
- 5.94%
- Cash-on-cash
- -1.25%
- DSCR
- 0.94
- GRM
- 11.6
CMA / ARV
- ARV (median comp)
- $282,410
- List price
- $195,000
- Delta
- -30.95%
- Verdict
- UNDERPRICED
- Comps
- 20 within 1.0 mi
Show comp detail 12 sales within ~0.75 mi
| Address | Dist | Beds/Ba | Sqft | Sold | Price | $/sf | Match |
|---|---|---|---|---|---|---|---|
| 4702 S Apple Tree Ave | 0.61mi | 3/2.0 (+1) | 1,035 (+0%) | 4mo | $270,000 | $261 | 63 |
| 7870 E Victoria Dr | 0.45mi | 3/1.0 (+1) | 980 (-5%) | 1mo | $241,000 | $246 | 61 |
| 7149 E Freestone Dr | 0.62mi | 3/2.0 (+1) | 1,030 (-0%) | 7mo | $269,500 | $262 | 60 |
| 3911 S Evergreen Ave | 0.09mi | 3/2.0 (+1) | 1,182 (+14%) | 10mo | $274,900 | $233 | 59 |
| 7745 E Pecan St | 0.66mi | 3/2.0 (+1) | 1,034 (0%) | 8mo | $280,000 | $271 | 58 |
| 7361 E Desert Aire Dr | 0.40mi | 3/2.0 (+1) | 1,130 (+9%) | 6mo | $255,000 | $226 | 56 |
| 3710 S Bellingham Pl | 0.57mi | 3/2.0 (+1) | 1,081 (+4%) | 6mo | $260,000 | $241 | 56 |
| 7575 E Apple Tree Dr | 0.68mi | 3/2.0 (+1) | 1,030 (-0%) | 10mo | $275,000 | $267 | 54 |
| 8016 E Victoria Dr | 0.59mi | 3/1.0 (+1) | 1,040 (+1%) | 11mo | $275,000 | $264 | 53 |
| 3402 S Champlain Ave | 0.73mi | 3/2.0 (+1) | 1,038 (+0%) | 12mo | $200,000 | $193 | 50 |
| 3333 S Mead Ave | 0.74mi | 3/2.0 (+1) | 1,088 (+5%) | 8mo | $265,000 | $244 | 46 |
| 3318 S Tahoe Dr | 0.71mi | 3/2.0 (+1) | 1,088 (+5%) | 12mo | $243,000 | $223 | 43 |
Match score weights: distance 35% · size 25% · config 20% · recency 20%. Top-matched comps best support the ARV.
Projected returns pro-forma
-3.0% appreciation · 0.0% rent growth · sell at horizon
- IRR
- -21.3%
- Equity multiple
- 0.28×
- Total profit
- $-39,415
- Equity at exit
- $29,075
- IRR
- -22.5%
- Equity multiple
- -0.01×
- Total profit
- $-55,217
- Equity at exit
- $16,860
Cash invested: $54,600 (down + closing). Projections, not guarantees.
Landlord ↔ Tenant lean methodology
- Overall (STATE)
- 87 Strongly Landlord-Friendly
- State Arizona
- 87 Strongly Landlord-Friendly · R+3
- County
- — inherits STATE
- City
- — inherits STATE
ZIP-level market 85730
- Home prices YoY
- -30.9%
- Rents YoY
- -0.2%
- Active inventory
- 198
- Price-to-rent
- 11.6×
Monthly cashflow live
- Estimated rent
- $1,400 high interval (Pro) →
- Mortgage (P&I)
- −$1,023
- Tax from tax record
- −$59 /mo · $710/yr
- Insurance
- −$81
- HOA
- −$0
- Vacancy / Maint / Mgmt
- −$294
- Net cashflow
- $-57
Break-even live
Sensitivity live
| Price | -10% $54 | -5% $-2 | +0% $-57 | +5% $-112 | +10% $-167 |
|---|---|---|---|---|---|
| Rent | -10% $-167 | -5% $-112 | +0% $-57 | +5% $-2 | +10% $54 |
| Rate | -1.0pp $41 | -0.5pp $-7 | base $-57 | +0.5pp $-107 | +1.0pp $-159 |
UW: 25.0% down · 7.5% · 30yr · 1.5% tax · 5.0% vac · 8.0% maint · 8.0% mgmt
Financing live
Cash to close
- Down payment
- $48,750
- Closing costs
- $5,850
- Reserves months
- —
- Total cash needed
- —
Loan-product check · same deal, 3 products live
Conventional
25% down · 7.5% · 30yr
- Down + closing
- —
- Monthly P&I
- —
- Monthly cashflow
- —
- DSCR
- —
- Eligible?
- —
Personal DTI + credit; lowest rate.
DSCR
20% down · 8.5% · 30yr
- Down + closing
- —
- Monthly P&I
- —
- Monthly cashflow
- —
- DSCR
- —
- Eligible?
- —
No personal income docs; deal must DSCR.
Hard money
10% down · 12.0% · 12mo
- Down + closing
- —
- Monthly P&I
- —
- Monthly cashflow
- —
- DSCR
- —
- Eligible?
- —
Short-term bridge; refi at stabilization.
Rent comps 35 comps
| Address | Beds | Baths | Sqft | Rent | $/sqft | DOM | Units | Dist |
|---|---|---|---|---|---|---|---|---|
| 3892 S Evergreen Ave Tucson, AZ | 2.0 | 1.0 | 730 | $1,295 | $1.77 | 45d | 1 | 0.06mi |
| 4007 S Winter Palm Dr Tucson, AZ | 2.0 | 1.0 | 798 | $1,100 | $1.38 | 25d | 1 | 0.19mi |
| 7467 E Desert Spring Dr Tucson, AZ | 2.0 | 1.0 | 915 | $1,200 | $1.31 | 25d | 1 | 0.26mi |
| 7467 E Desert Spring Dr Tucson, AZ | 2.0 | 1.0 | 915 | $1,200 | $1.31 | 16d | 1 | 0.26mi |
| 7455 E Desert Spring Dr Tucson, AZ | 2.0 | 1.0 | 806 | $1,300 | $1.61 | 5d | 1 | 0.27mi |
| 7431 E Desert Aire Dr Tucson, AZ | 3.0 | 2.0 | 1487 | $1,300 | $0.87 | 45d | 1 | 0.33mi |
| 7983 E Escalante Rd Unit 3 Tucson, AZ | 2.0 | 1.0 | 850 | $1,075 | $1.26 | 16d | 1 | 0.44mi |
| 4550 S Lotus Cir Tucson, AZ | 3.0 | 2.0 | 1127 | $1,680 | $1.49 | 45d | 1 | 0.49mi |
| 3722 S Bellingham Pl Tucson, AZ | 3.0 | 1.0 | 837 | $1,500 | $1.79 | 45d | 1 | 0.53mi |
| 7261 E Chelsie Kaye Ln Tucson, AZ | 3.0 | 2.0 | 1091 | $1,550 | $1.42 | 12d | 1 | 0.53mi |
| 7701 E 45th St Tucson, AZ | 3.0 | 2.0 | 1127 | $1,395 | $1.24 | 13d | 1 | 0.55mi |
| 3410 S Lakeside Pl Tucson, AZ | 3.0 | 2.0 | 1271 | $1,800 | $1.42 | 25d | 1 | 0.58mi |
| 8024 E Victoria Dr Tucson, AZ | 3.0 | 2.0 | 1127 | $1,500 | $1.33 | 25d | 1 | 0.59mi |
| 7421 E Rose Dr Tucson, AZ | 3.0 | 2.0 | 1400 | $1,500 | $1.07 | 23d | 1 | 0.69mi |
| 7950 E Stella Rd Tucson, AZ | 2.0 | 2.0 | 1000 | $1,195 | $1.20 | 23d | 1 | 0.69mi |
| 7950 E Stella Rd Tucson, AZ | 2.0 | 2.0 | 1000 | $1,395 | $1.40 | 5d | 1 | 0.69mi |
| 7309 E Fayette St Tucson, AZ | 3.0 | 2.0 | 1497 | $1,850 | $1.24 | 5d | 1 | 0.71mi |
| 7009 E Strike Eagle Way Tucson, AZ | 3.0 | 2.0 | 1285 | $1,550 | $1.21 | 45d | 1 | 0.85mi |
| 3662 S Fighting Falcon Dr Tucson, AZ | 2.0 | 2.0 | 1145 | $1,495 | $1.31 | 45d | 1 | 0.89mi |
| 8030 E Lakeside Pkwy Tucson, AZ | 2.0 | 2.0 | 880 | $1,308 | $1.49 | 4d | 1 | 1.12mi |
| 7400 E Golf Links Rd Tucson, AZ | 2.0 | 1.0–2.0 | 571 | $1,192 | $2.09 | 3d | 36 | 1.16mi |
| 6759 E Hawk Dr Tucson, AZ | 3.0 | 2.0 | 1255 | $1,850 | $1.47 | 45d | 1 | 1.18mi |
| 8061 E Senate St Tucson, AZ | 2.0 | 2.5 | 1298 | $1,700 | $1.31 | 23d | 1 | 1.19mi |
| 8250 E Golf Links Rd Tucson, AZ | 1.0–3.0 | 1.0–2.0 | 865 | $1,600 | $1.85 | 3d | 22 | 1.24mi |
| 7384 E Cross Ridge Pl Tucson, AZ | 2.0 | 2.0 | 989 | $1,450 | $1.47 | 25d | 1 | 1.24mi |
| 7777 E Golf Links Rd Tucson, AZ | 2.0 | 2.0 | 1113 | $1,162 | $1.04 | 4d | 2 | 1.27mi |
| 7777 E Golf Links Rd #8206 Tucson, AZ | 2.0 | 2.0 | 1113 | $1,050 | $0.94 | 3d | 1 | 1.28mi |
| 3455 S Magda Ave Tucson, AZ | 3.0 | 2.0 | 1500 | $2,000 | $1.33 | 45d | 1 | 1.35mi |
| 3673 S Camino Seco Unit 1 Tucson, AZ | 1.0 | 1.0 | 800 | $945 | $1.18 | 25d | 1 | 1.36mi |
| 2425 S Rose Peak Dr Tucson, AZ | 2.0 | 1.0 | 821 | $1,200 | $1.46 | 18d | 1 | 1.43mi |
| 7001 E Golf Links Rd Tucson, AZ | 2.0–3.0 | 1.0–2.0 | 885 | $1,121 | $1.27 | 4d | 9 | 1.45mi |
| 3551 S Calle Polar Tucson, AZ | 3.0 | 2.0 | 1077 | $1,599 | $1.48 | 21d | 1 | 1.47mi |
| 3551 S Calle Polar Tucson, AZ | 3.0 | 2.0 | 1077 | $1,599 | $1.48 | 45d | 1 | 1.47mi |
| 8829 E Eagle Creek Dr Tucson, AZ | 3.0 | 2.0 | 1280 | $1,830 | $1.43 | 17d | 1 | 1.48mi |
| 4433 S Sunrise Bluff Way Tucson, AZ | 3.0 | 2.0 | 1465 | $1,895 | $1.29 | 25d | 1 | 1.48mi |
Listing history 35 events
-
2026-06-21days on market $195,000 Active 60 DOM
-
2026-06-18days on market $195,000 Active 57 DOM
-
2026-06-17days on market $195,000 Active 56 DOM
-
2026-06-16days on market $195,000 Active 55 DOM
-
2026-06-15days on market $195,000 Active 54 DOM
-
2026-06-13statusdays on market $195,000 Active 52 DOM
-
2026-06-10days on market $195,000 Under Contract Accepting Backups 49 DOM
-
2026-06-09days on market $195,000 Under Contract Accepting Backups 48 DOM
-
2026-06-08days on market $195,000 Under Contract Accepting Backups 47 DOM
-
2026-06-07days on market $195,000 Under Contract Accepting Backups 46 DOM
-
2026-06-05statusdays on market $195,000 Under Contract Accepting Backups 43 DOM
Show marketing remark (769 chars)
Welcome home to this charming and spacious single-level residence offering comfortable living and thoughtful updates throughout. Step inside to a bright open floor plan featuring stylish wood-look flooring, neutral tones, and an expansive living area perfect for relaxing or entertaining. The oversized kitchen is a standout with abundant cabinetry, generous counter space, stainless steel appliances, dining area, and a movable center island for added flexibility. Spacious bedrooms offer comfort and versatility, while the updated bath adds a fresh modern touch. Enjoy seamless indoor-outdoor living with French doors leading to a covered patio, private fenced yard, storage shed, and plenty of room to garden, play, or unwind. Conveniently located and move-in ready!
-
2026-06-03days on market $195,000 Active 42 DOM
-
2026-06-02days on market $195,000 Active 41 DOM
-
2026-06-01days on market $195,000 Active 40 DOM
-
2026-05-31days on market $195,000 Active 39 DOM
-
2026-04-22$195,000 Active 510-char remark
Show marketing remark (769 chars)
Welcome home to this charming and spacious single-level residence offering comfortable living and thoughtful updates throughout. Step inside to a bright open floor plan featuring stylish wood-look flooring, neutral tones, and an expansive living area perfect for relaxing or entertaining. The oversized kitchen is a standout with abundant cabinetry, generous counter space, stainless steel appliances, dining area, and a movable center island for added flexibility. Spacious bedrooms offer comfort and versatility, while the updated bath adds a fresh modern touch. Enjoy seamless indoor-outdoor living with French doors leading to a covered patio, private fenced yard, storage shed, and plenty of room to garden, play, or unwind. Conveniently located and move-in ready!
-
2026-04-22$200,000 Active 769-char remark
Show marketing remark (769 chars)
Welcome home to this charming and spacious single-level residence offering comfortable living and thoughtful updates throughout. Step inside to a bright open floor plan featuring stylish wood-look flooring, neutral tones, and an expansive living area perfect for relaxing or entertaining. The oversized kitchen is a standout with abundant cabinetry, generous counter space, stainless steel appliances, dining area, and a movable center island for added flexibility. Spacious bedrooms offer comfort and versatility, while the updated bath adds a fresh modern touch. Enjoy seamless indoor-outdoor living with French doors leading to a covered patio, private fenced yard, storage shed, and plenty of room to garden, play, or unwind. Conveniently located and move-in ready!
-
2022-10-21soldstatus $155,000 Closed
Show marketing remark (138 chars)
Freshly renovated, quaint townhome, located on the south east side of Tucson. Close to Davis-Monthan Airforce Base, schools, and shopping.
-
2022-10-21soldstatus $155,000
Show marketing remark (138 chars)
Freshly renovated, quaint townhome, located on the south east side of Tucson. Close to Davis-Monthan Airforce Base, schools, and shopping.
-
2022-10-19status Pending
Show marketing remark (138 chars)
Freshly renovated, quaint townhome, located on the south east side of Tucson. Close to Davis-Monthan Airforce Base, schools, and shopping.
-
2022-09-29historical Active Contingent
Show marketing remark (138 chars)
Freshly renovated, quaint townhome, located on the south east side of Tucson. Close to Davis-Monthan Airforce Base, schools, and shopping.
-
2022-09-22$150,000 Active
Show marketing remark (138 chars)
Freshly renovated, quaint townhome, located on the south east side of Tucson. Close to Davis-Monthan Airforce Base, schools, and shopping.
-
2022-06-03soldstatus $72,500
-
2009-08-24soldstatus $30,100
-
2009-06-26$39,900
-
2009-06-23historical
-
2008-12-31$44,900
-
2008-05-19historical
-
2007-11-19$112,000
-
2005-10-03soldstatus $110,100
-
2005-09-30soldstatus $110,000
-
2005-08-22$109,500
-
1990-05-01soldstatus $35,500
-
1986-04-01soldstatus $36,000
-
1978-07-01soldstatus $24,000
ⓘ Source: listings_history table (triggers on properties + properties_extension) + one-shot
backfill from property_details.listing_events for pre-trigger history.
Tax reassessment forecast AZ · Resets to sale price
- Current annual tax
- $710 · $59/mo
- Projected year-2 tax
- $1,287 · $107/mo
- Expected delta
- +$577/yr (+$48/mo · 81.4%)
ⓘ Screening estimate from a state-policy table — verify with the county assessor before closing.
Climate risk First Street
- Flood 1/10 Low FEMA zone X (unshaded) · 0% chance over 30 yrs
- Wildfire 5/10 Major
- Heat 7/10 Severe 6 d/yr ≥104°F today · 17 d/yr by 30 yrs out
- Wind 1/10 Low
- Air quality 1/10 Low 0 unhealthy d/yr today · 0 by 30 yrs out
Nearby sold comps map
Loading sold comps map…
Walkable amenities ~0.75 mi
Loading nearby amenities…
Taxation est. · year 1
- Rental income
- $16,802
- − Mortgage interest
- −$10,923
- − Property taxes
- −$710
- − Insurance
- −$975
- − Repairs & maintenance
- −$1,344
- − Management
- −$1,344
- − Depreciation
- −$5,673
- Taxable loss
- −$4,167
- Est. tax savings @ 24.0%
- +$1,000
- After-tax cash flow
- $318/yr
For passive investors: Depreciation is non-cash, so a rental often shows a tax loss while cash-flowing — sheltering income. Rental losses are passive: they offset passive income freely, and up to $25,000/yr can offset ordinary (W-2) income if you actively participate and your MAGI is under $100k (phasing out to $0 by $150k); unused losses carry forward. On sale, claimed depreciation is recaptured at up to 25%, and gains may owe capital-gains tax (a 1031 exchange can defer both). Figures are a year-1 estimate at your 24.0% rate — not tax advice; consult a CPA.
Schools (NCES district)
- District
- Tucson Unified District (4403)
- NCES district ID
- 0408800
- Math proficiency
- 14% ▼ -17.00%
- Reading proficiency
- 23% ▼ -11.00%
- Median HH income
- $40,962
- Composite
- 15.78/100
- National rank
- #9270
- State rank
- #190 of 249 in AZ
Livability — Tucson
- Score
- 74/100
- State rank
- #17
- US rank
- #4502
Category grades
Schools grade is shown separately in the Schools card above.
Census & demographics
- Census place
- Tucson, AZ
- County
- Pima County · 1,012,107 people
- City population
- 839,336
- Metro
- Tucson, AZ
- Population (ZIP)
- 39,399
- Household income
- $62,090
- Rent vs Own
- Severe rent burden
- 1364.0
Population outlook (Pima County) Hauer SSP2
- Today (2025)
- 1,066,056 people
- By 2030
- 1,086,684 · +1.9%
- By 2040
- 1,117,160 · +4.8%
- By 2050
- 1,149,778 · +7.9%
- By 2075
- 1,271,480 · +19.3%
- By 2100
- 1,321,160 · +23.9%
Race, ethnicity, and origin ACS 2023
- Neighborhood character
- Diverse neighborhood (Simpson 0.62)
- Race & ethnicity
- White 53% Hispanic / Latino 31% Two or more races 16% Black 8% Asian 3% Native American 1%
- Hispanic origin (detail)
- Mexican 28%
- Common ancestry
- Romanian 2% Lithuanian 2% Slovak 2%
- Foreign-born
- 8% · Canada, Vietnam
- Languages at home
- 84% English-only · Spanish 13% Vietnamese 1%
Political lean MEDSL · Pima
- 2024 margin
- D (+15.2) · D 57.0% · R 41.8% · Other 1.2%
- 2008→2024 swing
- +9.1pp toward D · 2008: 6.1pp · 2024: 15.2pp
- All cycles
- 2024: D+15.2 2020: D+18.7 2016: D+13.5 2012: D+5.8 2008: D+6.1
Not yet ingested
- Civics
- —
Market trends
- HPI YoY
- ▼ -136.41%
- Current HPI
- 304.999
- Rent YoY
- ▼ -0.16%
- Metro
- Tucson, AZ
- State GDP YoY
- ▲ 4.54%
- F500 in state
- 20
Industry mix (Fortune 500 HQ in AZ)
| Industry | F500 HQs | Revenue |
|---|---|---|
| Technology | 2 | $13B |
|
||
| Mining / Metals | 1 | $23B |
|
||
| Environmental Services | 1 | $16B |
|
||
| Metals / Steel | 1 | $14B |
|
||
| Technology Distribution | 1 | $9B |
|
||
| Homebuilding | 1 | $8B |
|
||
Price history
+712.5% since first listed25 events — show timeline
- 2026-06-12 Relisted — MLSSAZ
- 2026-06-12 Price Changed $195,000 MLSSAZ
- 2026-06-12 Relisted — ARMLS
- 2026-06-05 Pending — MLSSAZ
- 2026-06-05 Contingent — ARMLS
- 2026-04-22 Listed $195,000 ARMLS
- 2026-04-22 Listed $200,000 MLSSAZ
- 2022-10-21 Sold (Public Records) $155,000 Public Records
- 2022-10-21 Sold (MLS) $155,000 MLSSAZ
- 2022-10-19 Pending — MLSSAZ
- 2022-09-29 Contingent — MLSSAZ
- 2022-09-22 Listed $150,000 MLSSAZ
- 2022-06-03 Sold (Public Records) $72,500 Public Records
- 2009-08-24 Sold (MLS) $30,100 MLSSAZ
- 2009-06-26 Listed $39,900 MLSSAZ
- 2009-06-23 Listing Removed — MLSSAZ
- 2008-12-31 Listed $44,900 MLSSAZ
- 2008-05-19 Listing Removed — MLSSAZ
- 2007-11-19 Listed $112,000 MLSSAZ
- 2005-10-03 Sold (Public Records) $110,100 Public Records
- 2005-09-30 Sold (MLS) $110,000 MLSSAZ
- 2005-08-22 Listed $109,500 MLSSAZ
- 1990-05-01 Sold (Public Records) $35,500 Public Records
- 1986-04-01 Sold (Public Records) $36,000 Public Records
- 1978-07-01 Sold (Public Records) $24,000 Public Records
Property tax history
+0.1%/yrLatest (2025): $710 · +4.4% YoY. Source: county tax records.
Cash-flow waterfall
monthlySold comps — $/sqft
last 12 mo · ≤1 miLoading sold comps…