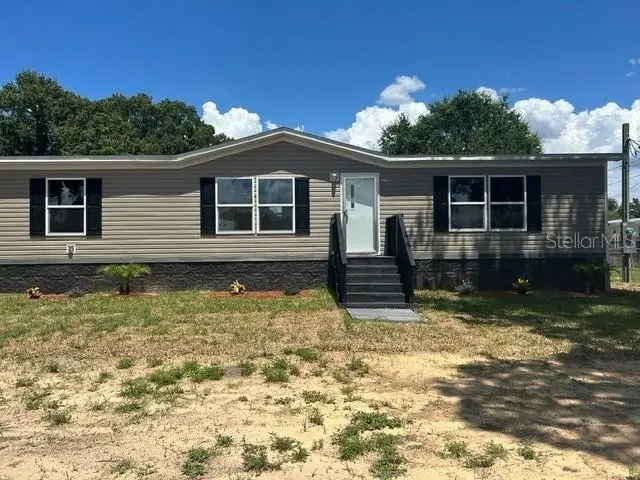
270 Old Bartow Lake Wales · Alturas, FL
Flood risk 1/10 · Minimal
- FEMA flood zone
- X (unshaded)
- Chance of flooding over 30 yrs
- 0.0%
- Est. flood insurance / yr
- $507 – $1,088
Fire risk 5/10 · Moderate
- Est. fire insurance / yr
- $947 – $1,759
Heat risk 8/10 · Major
- Hot days now (above 108°F)
- 7 days/yr
- Hot days in 30 yrs
- 24 days/yr
Wind risk 10/10 · Severe
- Chance of severe wind over 30 yrs
- 99.0%
Air-quality risk 2/10 · Minimal
- Unhealthy air days now
- 2 days/yr
- Unhealthy air days in 30 yrs
- 2 days/yr
Risk factors via First Street. Map © Google.
Why this score? — see what drove the F grade
The composite is a weighted blend of 9 inputs, each scored 0–100. Each bar is that input's sub-score; the figure is the points it added to the 100-point composite (weight × sub-score).
- ARV discount +7.5/15.0
- Cash flow +5.7/30.0
- Schools +3.5/10.0
- Rent growth +3.2/5.0
- Livability +3.2/5.0
- Condition / age +2.5/5.0
- DSCR +0.1/10.0
- 1% rule +0.0/10.0
- Appreciation +0.0/10.0
$295,000
🖨 Deal sheet (PDF) 📄 Offer letter ✓ Due diligence
Listing remarks
Welcome to this beautiful property featuring A new 2025 manufactured home situated on a spacious lot. This move-in-ready home offers a bright open floor plan. modern finishes and comfortable living spaces designed for today's lifestyle. The kitchen features ample cabinetry, generous counter space and island. A open layout that flows seamlessly into the living and dining room, making it perfect for everyday living and entertaining. The primary suite provides a private retreat with a spacious bedroom and en-suite bath, while 3 additional bedrooms give flexibility for family, guests or home office. The property offers plently of outdoor space for gardening, recreation, pets or futurei improve
Key facts
- 0.42 acre lot
- Built 2025
- Listed 9 days
Property features AI
Finance
- Other: Homestead exempt; Total living area approximately 1920 square feet; Lot about 0.41 acre (0.25–0.5 acre range)
- Financial info: No lease restrictions
- HOA & community: No association; Pets allowed (cats and dogs)
Exterior
- Parking: Public maintained road access
- Security: Smoke detectors
- Utilities: Well water; Septic tank; Electricity connected; Water connected; Sewer connected; Cable available
- Home design: Manufactured double-wide home; One story; Faces east; Completed condition; Made by Clayton
- Construction: Metal siding; Shingle roof; Pillar/Post/Pier foundation
- Exterior features: Balcony; Sliding doors; Wood fencing; Cleared lot; Paved and asphalt access; Located in county (not city)
Interior
- Kitchen: Dishwasher; Microwave; Range; Range hood; Refrigerator; Electric water heater; Exhaust fan
- Bedrooms: 4 bedrooms
- Flooring: Laminate
- Bathrooms: 2 full bathrooms
- Heating & cooling: Central heating; Central air
- Interior features: Ceiling fans; Eat-in kitchen; Kitchen/family room combo; Open floorplan; Split bedroom layout; Thermostat; Walk-in closets; Family room
- Laundry & utility: Inside laundry room; Electric dryer hookup
Neighborhood map
What this means for you Summary
Snapshot
- This is a 2-bed/1.0-bath single-family listed at $295k.
Deal economics
- At list price, monthly cash flow is $-606 ($-7k/yr) — negative.
- To cash-flow at today's rent, offer at most $188k (36.3% below list).
- To meet the 1% rule (rent ≥ 1% of price), the offer needs to be $142k (51.7% below list).
- Recommended offer: $142k (51.7% below list) — sets the bar for 1% rule.
Location & tenants
- Location reads 64/100 on livability (#678 in FL) — a middle-class / working-renter tenant base. Strengths: cost of living A+, housing A+, crime A; Watch: amenities F, commute F, employment D-.
- Polk (suburban): math 39% / reading 43% proficiency, ranked #62 of 73 in FL (top 85%) — families likely to look elsewhere, expect single-tenant / working-renter base with shorter leases.
- Zoned schools: Alturas Elementary School (math 57% / reading 47%, grade C-, #990 of 2,144 statewide, top 48%, 350 students, 61% FRL); Bartow Middle School (math 33% / reading 36%, grade F, #421 of 571 statewide, top 74%, 1,046 students, 63% FRL); Bartow Senior High School (math 26% / reading 46%, grade F, #359 of 667 statewide, top 55%, 2,125 students, 44% FRL) — zoned schools at 56% FRL track the district average.
- Market conditions: Rents rising (+2.7%/yr); 392 active listings in the ZIP; 10,384 units permitted in Polk County in 2024 (1,716 in 5+ unit buildings).
Forward outlook
- Local home prices are declining (-3.0%/yr); year-one equity from $2k of loan paydown is wiped out by about $9k of value loss. Plan a longer hold.
- Polk County population projected at +33% by 2050 — long-run rental-demand tailwind backs the buy-and-hold thesis.
Negotiation context
- Only 9 days on market — expect competitive offers; lowballing is unlikely to land.
- Current owner paid $65k; list at $295k implies a 354% gain — meaningful room to come down on a strong offer.
Risks & watch-outs
- Climate carrying-cost: severe wind risk, 99% chance of damaging wind over 30y; moderate wildfire risk; extreme-heat days projected 7→24/yr by 2055 (HVAC capex compounding) — expect insurance premiums to compound above CPI over the hold.
Questions for the listing agent
- What do current leases actually rent for vs. the listed asking? Can we see a recent rent roll and the last 12 months of T-12 income?
- Is there a deadline driving the sale (1031 exchange, divorce, estate, relocation)? That informs how much negotiation room exists.
- The area grade is low — what's the realistic commute time and amenity access for the typical tenant pool here? Any planned neighborhood developments (good or bad) we should know about?
- What's the average days-on-market for RENTAL listings here right now (not sales)? A rising rental-DOM trend means longer vacancies and softer asking-rent achievability than the comps imply.
- What's the recent tenant-quality profile in this submarket — average credit score on applications, eviction rate, late-payment / NSF rate, and stable-employment percentage? A property-management company in the area should have these aggregated.
- How much new for-sale + rental construction is in the pipeline within 1–3 miles? Heavy new supply typically softens prices + rents 12–24 months out; constrained supply supports both.
Investment metrics
- 1% rule
- 0.48% ✗
- Cap rate
- 3.83%
- Cash-on-cash
- -8.81%
- DSCR
- 0.61
- GRM
- 17.3
CMA / ARV
No comps found within radius.
Projected returns pro-forma
-3.0% appreciation · 2.72% rent growth · sell at horizon
- IRR
- -32.3%
- Equity multiple
- -0.05×
- Total profit
- $-86,994
- Equity at exit
- $43,985
- IRR
- -39.2%
- Equity multiple
- -0.55×
- Total profit
- $-127,799
- Equity at exit
- $25,506
Cash invested: $82,600 (down + closing). Projections, not guarantees.
Landlord ↔ Tenant lean methodology
- Overall (STATE)
- 87 Strongly Landlord-Friendly
- State Florida
- 87 Strongly Landlord-Friendly · R+3
- County
- — inherits STATE
- City
- — inherits STATE
ZIP-level market 33830
- Home prices YoY
- -19.8%
- Rents YoY
- 2.7%
- Active inventory
- 392
- Price-to-rent
- 17.3×
Monthly cashflow live
- Estimated rent
- $1,424 medium interval (Pro) →
- Mortgage (P&I)
- −$1,547
- Tax from tax record
- −$62 /mo · $739/yr
- Insurance
- −$123
- HOA
- −$0
- Vacancy / Maint / Mgmt
- −$299
- Net cashflow
- $-606
Break-even live
Sensitivity live
| Price | -10% $-439 | -5% $-523 | +0% $-606 | +5% $-690 | +10% $-773 |
|---|---|---|---|---|---|
| Rent | -10% $-719 | -5% $-663 | +0% $-606 | +5% $-550 | +10% $-494 |
| Rate | -1.0pp $-458 | -0.5pp $-531 | base $-606 | +0.5pp $-683 | +1.0pp $-761 |
UW: 25.0% down · 7.5% · 30yr · 1.5% tax · 5.0% vac · 8.0% maint · 8.0% mgmt
Financing live
Cash to close
- Down payment
- $73,750
- Closing costs
- $8,850
- Reserves months
- —
- Total cash needed
- —
Loan-product check · same deal, 3 products live
Conventional
25% down · 7.5% · 30yr
- Down + closing
- —
- Monthly P&I
- —
- Monthly cashflow
- —
- DSCR
- —
- Eligible?
- —
Personal DTI + credit; lowest rate.
DSCR
20% down · 8.5% · 30yr
- Down + closing
- —
- Monthly P&I
- —
- Monthly cashflow
- —
- DSCR
- —
- Eligible?
- —
No personal income docs; deal must DSCR.
Hard money
10% down · 12.0% · 12mo
- Down + closing
- —
- Monthly P&I
- —
- Monthly cashflow
- —
- DSCR
- —
- Eligible?
- —
Short-term bridge; refi at stabilization.
Listing history 7 events
-
2026-06-22days on market $295,000 Active 9 DOM
-
2026-06-18days on market $295,000 Active 6 DOM
-
2026-06-17days on market $295,000 Active 5 DOM
-
2026-06-16days on market $295,000 Active 4 DOM
-
2026-06-15days on market $295,000 Active 3 DOM
-
2026-06-13remarks 699-char remark
-
2026-06-13$295,000 Active 1 DOM
ⓘ Source: listings_history table (triggers on properties + properties_extension) + one-shot
backfill from property_details.listing_events for pre-trigger history.
Tax reassessment forecast FL · Resets to sale price
- Current annual tax
- $739 · $62/mo
- Projected year-2 tax
- $2,448 · $204/mo
- Expected delta
- +$1,709/yr (+$142/mo · 231.3%)
ⓘ Screening estimate from a state-policy table — verify with the county assessor before closing.
Climate risk First Street
- Flood 1/10 Low FEMA zone X (unshaded) · 0% chance over 30 yrs
- Wildfire 5/10 Major
- Heat 8/10 Severe 7 d/yr ≥108°F today · 24 d/yr by 30 yrs out
- Wind 10/10 Extreme 99% chance of damaging wind over 30 yrs
- Air quality 2/10 Low 2 unhealthy d/yr today · 2 by 30 yrs out
Nearby sold comps map
Loading sold comps map…
Walkable amenities ~0.75 mi
Loading nearby amenities…
Taxation est. · year 1
- Rental income
- $17,090
- − Mortgage interest
- −$16,525
- − Property taxes
- −$739
- − Insurance
- −$1,475
- − Repairs & maintenance
- −$1,367
- − Management
- −$1,367
- − Depreciation
- −$8,582
- Taxable loss
- −$12,965
- Est. tax savings @ 24.0%
- +$3,112
- After-tax cash flow
- $-4,166/yr
For passive investors: Depreciation is non-cash, so a rental often shows a tax loss while cash-flowing — sheltering income. Rental losses are passive: they offset passive income freely, and up to $25,000/yr can offset ordinary (W-2) income if you actively participate and your MAGI is under $100k (phasing out to $0 by $150k); unused losses carry forward. On sale, claimed depreciation is recaptured at up to 25%, and gains may owe capital-gains tax (a 1031 exchange can defer both). Figures are a year-1 estimate at your 24.0% rate — not tax advice; consult a CPA.
Schools (NCES district)
- District
- Polk
- NCES district ID
- 1201590
- Math proficiency
- 39% ▼ -11.00%
- Reading proficiency
- 43% ▼ -4.00%
- Median HH income
- $43,979
- Composite
- 34.74/100
- National rank
- #5132
- State rank
- #62 of 73 in FL
Livability — Alturas
- Score
- 64/100
- State rank
- #678
- US rank
- #14100
Category grades
Schools grade is shown separately in the Schools card above.
Census & demographics
- Census place
- Alturas, FL
- County
- Polk County · 740,051 people
- Metro
- Lakeland-Winter Haven, FL
- Population (ZIP)
- 33,740
- Household income
- $63,918
- Rent vs Own
- Severe rent burden
- 681.0
Population outlook (Polk County) Hauer SSP2
- Today (2025)
- 752,975 people
- By 2030
- 804,621 · +6.9%
- By 2040
- 906,117 · +20.3%
- By 2050
- 1,000,476 · +32.9%
- By 2075
- 1,197,520 · +59.0%
- By 2100
- 1,271,518 · +68.9%
Race, ethnicity, and origin ACS 2023
- Neighborhood character
- Diverse neighborhood (Simpson 0.62)
- Race & ethnicity
- White 55% Hispanic / Latino 22% Black 18% Two or more races 13% Asian 2%
- Hispanic origin (detail)
- Mexican 13% Puerto Rican 5%
- Common ancestry
- Italian 3% Slovak 1% Lithuanian 1%
- Foreign-born
- 8% · Canada
- Languages at home
- 81% English-only · Spanish 17% Other Indo-European 1% Other Asian/Pacific 1%
Political lean MEDSL · Polk
- 2024 margin
- Strong R (+20.7) · D 39.2% · R 59.9%
- 2008→2024 swing
- -14.6pp toward R · 2008: -6.1pp · 2024: -20.7pp
- All cycles
- 2024: R+20.7 2020: R+14.4 2016: R+14.1 2012: R+6.8 2008: R+6.1
Not yet ingested
- Civics
- —
Market trends
- HPI YoY
- ▼ -82.47%
- Current HPI
- 333.3392
- Rent YoY
- ▲ 2.72%
- Metro
- Lakeland-Winter Haven, FL
- State GDP YoY
- ▲ 3.28%
- F500 in state
- 36
Industry mix (Fortune 500 HQ in FL)
| Industry | F500 HQs | Revenue |
|---|---|---|
| Industrial Technology | 2 | $29B |
|
||
| Insurance | 2 | $17B |
|
||
| Retail | 1 | $60B |
|
||
| Technology Distribution | 1 | $58B |
|
||
| Homebuilding | 1 | $35B |
|
||
| Technology Manufacturing | 1 | $35B |
|
||
Price history
+353.8% since first listed2 events — show timeline
- 2026-06-12 Listed $295,000 Stellar MLS as Distributed by MLS Grid
- 2025-08-18 Sold (Public Records) $65,000 Public Records
Property tax history
+7.2%/yrLatest (2025): $739 · +19.5% YoY. Source: county tax records.
Cash-flow waterfall
monthlySold comps — $/sqft
last 12 mo · ≤1 miLoading sold comps…