1420 Goodale Ave · Toledo, OH
Flood risk 1/10 · Minimal
- FEMA flood zone
- X (unshaded)
- Chance of flooding over 30 yrs
- 0.0%
- Est. flood insurance / yr
- $473 – $860
Fire risk 1/10 · Minimal
- Est. fire insurance / yr
- $713 – $1,323
Heat risk 3/10 · Minor
- Hot days now (above 101°F)
- 7 days/yr
- Hot days in 30 yrs
- 16 days/yr
Wind risk 2/10 · Minimal
- Chance of severe wind over 30 yrs
- —
Air-quality risk 2/10 · Minimal
- Unhealthy air days now
- 1 days/yr
- Unhealthy air days in 30 yrs
- 3 days/yr
Risk factors via First Street. Map © Google.
Why this score? — see what drove the D grade
The composite is a weighted blend of 9 inputs, each scored 0–100. Each bar is that input's sub-score; the figure is the points it added to the 100-point composite (weight × sub-score).
- Cash flow +15.0/30.0
- ARV discount +7.5/15.0
- 1% rule +5.0/10.0
- DSCR +5.0/10.0
- Livability +3.3/5.0
- Rent growth +3.1/5.0
- Condition / age +2.5/5.0
- Schools +1.6/10.0
- Appreciation +0.0/10.0
$24,900
🖨 Deal sheet 📄 Offer letter ✓ Due diligence
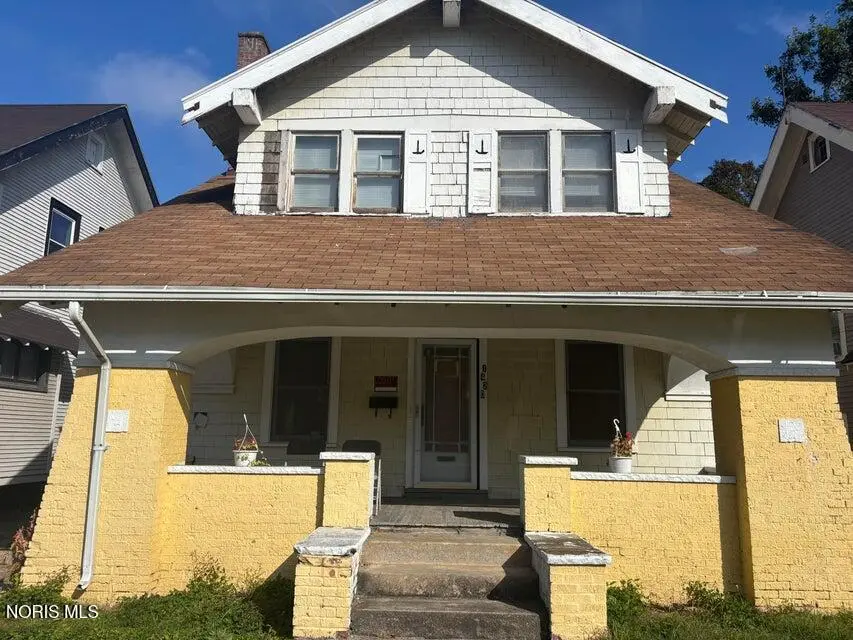
Listing remarks
Perfect home for an investor looking to add to their portfolio. Bring your vision, tools and get to work giving this home some much needed TLC. This home has 3 bedrooms, 1 bath and basement for more opportunity. Priced to sell, bring an offer!
Key facts
- 4,400 sq ft lot
- Parking
- Built 1919
Property features AI
Exterior
- Parking: Driveway parking (1 space)
- Utilities: Electricity connected with circuit breakers; Natural gas connected; Public water; Public sewer
- Home design: Single-family residence; House with one and one-half levels; Not attached to other structures; No common walls
- Construction: Brick and wood siding exterior; Block foundation with crawl space; Built as a house (residential)
- Exterior features: Front porch; Enclosed porch; Shingle roof
Interior
- Kitchen: Main-level kitchen (approx. 10' x 10')
- Bedrooms: Upper-level bedrooms (two bedrooms approx. 10' x 10' and 9' x 9')
- Flooring: Hardwood floors
- Bathrooms: 1 full bathroom
- Heating & cooling: Forced air heating
- Interior features: 6 total rooms; Hardwood flooring; Has basement; Enclosed living room fireplace
- Laundry & utility: Laundry located in basement
Neighborhood map
What this means for you Summary
Snapshot
- This is a 3-bed/1.0-bath single-family listed at $25k.
Deal economics
- At list price, monthly cash flow is $700 ($8k/yr) — positive.
- The deal already cash-flows at list — no discount required.
- Meets the 1% rule at list price ($1k rent vs $25k).
- Recommended offer: $24k (3.0% below list) — sets the bar for market timing.
- Cap rate 40.0% vs local median 7.6% in Toledo — top-decile yield for the area; either an underpriced asset or a hidden risk that comps aren't pricing in. Stress-test before assuming the spread holds.
Location & tenants
- Location reads 66/100 on livability (#645 in OH) — a middle-class / working-renter tenant base. Strengths: cost of living A+, housing A+, health & safety A+; Watch: amenities C-, crime F, commute F.
- Toledo City (urban): math 15% / reading 24% proficiency, ranked #634 of 656 in OH (top 97%) — low school quality limits family demand, transient renter base, plan for 1-2y turnover; 72% free/reduced lunch — lower-income household profile, screen leases tightly.
- Zoned schools: Mckinley Stemm Academy (math 2% / reading 12%, grade F, #1,527 of 1,584 statewide, top 98%, 279 students, 0% FRL); Start High School (math 11% / reading 33%, grade F, #672 of 781 statewide, top 86%, 1,242 students, 50% FRL) — zoned schools average 25% FRL vs 72% district-wide (47 pts lower); this property's tenant base skews higher-income than the district average.
- Market conditions: Rents rising (+2.3%/yr); 93 active listings in the ZIP; 40 comparable units currently listed for rent nearby; rentals lingering (median 44d on market — plan ~5-8 weeks vacancy on turnover, expect pricing pressure); 50% of comp listings sitting > 30 days — soft ceiling on asking rent; 415 units permitted in Lucas County in 2024 (122 in 5+ unit buildings).
Forward outlook
- Local home prices are declining (-3.0%/yr); year-one equity from $172 of loan paydown is wiped out by about $747 of value loss. Plan a longer hold.
- Lucas County population projected at -16% by 2050 — secular population decline; favor cash flow + early exit over multi-decade hold.
- At projected returns (-3.0% appreciation + 2.3% rent growth), your $7k cash investment doubles in ~1 year — after that, you're playing with house money.
Negotiation context
- It's been on market 35 days — a 3% lower offer ($24k) is reasonable based on typical stale-listing flexibility.
- 3 sale attempts; this cycle's ask has dropped $5k (17%) from the opening price — seller is motivated, your offer sets the floor, not the list.
Risks & watch-outs
- Watch-outs: property tax is 4.0% of price; built in 1919 — expect roof / HVAC / electrical / plumbing capex.
Questions for the listing agent
- It's been on market 35 days. Have you received any prior offers? Is the seller open to a 3% concession, seller financing, or rate buy-down credit?
- Built in 1919 — when were the roof, HVAC, electrical panel, plumbing, and water heater last replaced?
- Property tax is high relative to price — has the assessment been appealed recently, and will the sale trigger a re-assessment?
- Is there a deadline driving the sale (1031 exchange, divorce, estate, relocation)? That informs how much negotiation room exists.
- Schools are D-rated, which usually means shorter tenancies and higher turnover. Who's the typical renter profile here, and what's been the actual vacancy rate?
- Crime grade is F in this area — have there been break-ins, vandalism, or insurance claims at this property in the last 3 years? What carrier currently insures it and at what premium?
- The area grade is low — what's the realistic commute time and amenity access for the typical tenant pool here? Any planned neighborhood developments (good or bad) we should know about?
- What's the average days-on-market for RENTAL listings here right now (not sales)? A rising rental-DOM trend means longer vacancies and softer asking-rent achievability than the comps imply.
- What's the recent tenant-quality profile in this submarket — average credit score on applications, eviction rate, late-payment / NSF rate, and stable-employment percentage? A property-management company in the area should have these aggregated.
- How much new for-sale + rental construction is in the pipeline within 1–3 miles? Heavy new supply typically softens prices + rents 12–24 months out; constrained supply supports both.
Investment metrics
- 1% rule
- 4.70% ✓
- Cap rate
- 40.04%
- Cash-on-cash
- 120.52%
- DSCR
- 6.36
- GRM
- 1.8
CMA / ARV
- ARV (median comp)
- $64,018
- List price
- $24,900
- Delta
- -61.10%
- Verdict
- UNDERPRICED
- Comps
- 20 within 1.0 mi
Show comp detail 12 sales within ~0.75 mi
| Address | Dist | Beds/Ba | Sqft | Sold | Price | $/sf | Match |
|---|---|---|---|---|---|---|---|
| 2458 Lawton Ave | 0.51mi | 3/1.0 | 1,285 (-4%) | 2mo | $60,000 | $47 | 68 |
| 1623 W Central Ave | 0.53mi | 3/1.0 | 1,348 (+0%) | 9mo | $55,000 | $41 | 67 |
| 1827 Jermain Dr | 0.63mi | 3/1.0 | 1,375 (+2%) | 1mo | $95,000 | $69 | 66 |
| 2242 Auburn Ave | 0.49mi | 3/1.0 | 1,241 (-8%) | 3mo | $85,000 | $68 | 62 |
| 2741 Bryn Mawr Dr | 0.68mi | 3/1.0 | 1,345 (+0%) | 7mo | $115,000 | $86 | 62 |
| 2465 Lawton Ave | 0.49mi | 3/1.0 | 1,238 (-8%) | 7mo | $27,000 | $22 | 59 |
| 1748 Freeman St | 0.63mi | 3/1.5 | 1,263 (-6%) | 2mo | $83,000 | $66 | 58 |
| 2272 Rosedale Ave | 0.50mi | 3/1.5 | 1,436 (+7%) | 6mo | $92,500 | $64 | 58 |
| 2334 Torrey Hill Dr | 0.75mi | 3/1.0 | 1,238 (-8%) | 5mo | $76,000 | $61 | 48 |
| 1942 Wellesley Dr | 0.75mi | 3/1.5 | 1,436 (+7%) | 4mo | $111,000 | $77 | 48 |
| 2534 Maplewood Ave | 0.73mi | 3/2.0 | 1,480 (+10%) | 1mo | $75,000 | $51 | 44 |
| 1308 Grand Ave | 0.70mi | 4/1.5 (+1) | 1,468 (+10%) | 6mo | $27,500 | $19 | 39 |
Match score weights: distance 35% · size 25% · config 20% · recency 20%. Top-matched comps best support the ARV.
Projected returns pro-forma
-3.0% appreciation · 2.29% rent growth · sell at horizon
- IRR
- —
- Equity multiple
- 6.71×
- Total profit
- $39,783
- Equity at exit
- $3,713
- IRR
- —
- Equity multiple
- 13.75×
- Total profit
- $88,914
- Equity at exit
- $2,153
Cash invested: $6,972 (down + closing). Projections, not guarantees.
Landlord ↔ Tenant lean methodology
- Overall (STATE)
- 73 Landlord-Friendly
- State Ohio
- 73 Landlord-Friendly · R+6
- County
- — inherits STATE
- City
- — inherits STATE
ZIP-level market 43606
- Home prices YoY
- -15.5%
- Rents YoY
- 2.3%
- Active inventory
- 93
- Price-to-rent
- 1.8×
Monthly cashflow live
- Estimated rent
- $1,171 high interval (Pro) →
- Mortgage (P&I)
- −$131
- Tax from tax record
- −$84 /mo · $1,004/yr
- Insurance
- −$10
- HOA
- −$0
- Vacancy / Maint / Mgmt
- −$246
- Net cashflow
- $700
Break-even live
UW: 25.0% down · 7.5% · 30yr · 1.5% tax · 5.0% vac · 8.0% maint · 8.0% mgmt
Financing live
Cash to close
- Down payment
- $6,225
- Closing costs
- $747
- Reserves months
- —
- Total cash needed
- —
Loan-product check · same deal, 3 products live
Conventional
25% down · 7.5% · 30yr
- Down + closing
- —
- Monthly P&I
- —
- Monthly cashflow
- —
- DSCR
- —
- Eligible?
- —
Personal DTI + credit; lowest rate.
DSCR
20% down · 8.5% · 30yr
- Down + closing
- —
- Monthly P&I
- —
- Monthly cashflow
- —
- DSCR
- —
- Eligible?
- —
No personal income docs; deal must DSCR.
Hard money
10% down · 12.0% · 12mo
- Down + closing
- —
- Monthly P&I
- —
- Monthly cashflow
- —
- DSCR
- —
- Eligible?
- —
Short-term bridge; refi at stabilization.
Rent comps 40 comps
| Address | Beds | Baths | Sqft | Rent | $/sqft | DOM | Units | Dist |
|---|---|---|---|---|---|---|---|---|
| 1436 Palmetto Ave Toledo, OH | 3.0 | 1.0 | 1678 | $1,400 | $0.83 | 23d | 1 | 0.04mi |
| 1573 Jermain Dr Toledo, OH | 3.0 | 1.0 | 1254 | $1,195 | $0.95 | 13d | 1 | 0.40mi |
| 1738 Milburn Ave Toledo, OH | 2.0 | 1.0 | 1016 | $650 | $0.64 | 23d | 1 | 0.50mi |
| 960 W Delaware Ave Toledo, OH | 3.0 | 1.0 | 1224 | $1,050 | $0.86 | 23d | 1 | 0.56mi |
| 2322 Upton Ave Toledo, OH | 3.0 | 1.0 | 1000 | $1,300 | $1.30 | 43d | 1 | 0.64mi |
| 1718 Giant St Toledo, OH | 3.0 | 1.0 | 1080 | $1,395 | $1.29 | 13d | 1 | 0.65mi |
| 1919 Ottawa Dr Unit 7 Toledo, OH | 2.0 | 1.0 | 900 | $800 | $0.89 | 43d | 1 | 0.66mi |
| 1804 Bigelow St Toledo, OH | 3.0 | 1.0 | 995 | $937 | $0.94 | 43d | 1 | 0.66mi |
| 3803 Monroe St Toledo, OH | 2.0 | 1.0 | 942 | $850 | $0.90 | 43d | 1 | 0.69mi |
| 2356 Torrey Hill Dr Unit 11 Toledo, OH | 2.0 | 1.0 | 1050 | $800 | $0.76 | 43d | 1 | 0.72mi |
| 2447 Maplewood Ave Toledo, OH | 2.0 | 1.0 | 1538 | $897 | $0.58 | 43d | 1 | 0.75mi |
| 1838 Giant St Toledo, OH | 3.0 | 1.0 | 962 | $1,200 | $1.25 | 13d | 1 | 0.75mi |
| 2117 Clinton St Toledo, OH | 3.0 | 1.0 | 1256 | $1,115 | $0.89 | 43d | 1 | 0.76mi |
| 3835 Monroe St Toledo, OH | 2.0 | 1.0 | 1002 | $950 | $0.95 | 43d | 1 | 0.76mi |
| 3606 Revere Dr Toledo, OH | 4.0 | 1.0 | 1320 | $1,500 | $1.14 | 43d | 1 | 1.00mi |
| 1731 Mansfield Rd Toledo, OH | 3.0 | 1.0 | 1138 | $1,195 | $1.05 | 23d | 1 | 1.01mi |
| 3541 Willys Pkwy Toledo, OH | 3.0 | 1.0 | 1113 | $1,400 | $1.26 | 43d | 1 | 1.03mi |
| 2907 Rockwood Pl Toledo, OH | 3.0 | 1.0 | 1494 | $1,100 | $0.74 | 13d | 1 | 1.05mi |
| 625 Virginia St Toledo, OH | 2.0 | 1.0 | 1000 | $800 | $0.80 | 43d | 1 | 1.11mi |
| 625 Virginia St Toledo, OH | 2.0 | 1.0 | 1000 | $850 | $0.85 | 13d | 1 | 1.11mi |
| 3713 Hazelhurst Ave Toledo, OH | 3.0 | 1.5 | 1352 | $1,700 | $1.26 | 43d | 1 | 1.13mi |
| 2632 Algonquin Pkwy Toledo, OH | 3.0 | 1.5 | 1568 | $800 | $0.51 | 23d | 1 | 1.13mi |
| 1846 Loxley Rd Toledo, OH | 2.0 | 1.0 | 876 | $900 | $1.03 | 43d | 1 | 1.14mi |
| 1489 Berdan Ave Toledo, OH | 3.0 | 1.0 | 1068 | $1,250 | $1.17 | 43d | 1 | 1.15mi |
| 3725 Hoiles Ave Toledo, OH | 3.0 | 1.0 | 1180 | $1,245 | $1.06 | 23d | 1 | 1.17mi |
| 1026 Oakwood Ave Toledo, OH | 2.0 | 1.0 | 1100 | $850 | $0.77 | 43d | 1 | 1.19mi |
| 3805 Hoiles Ave Toledo, OH | 3.0 | 1.0 | 1370 | $1,025 | $0.75 | 23d | 1 | 1.19mi |
| 3683 Upton Ave Toledo, OH | 3.0 | 1.0 | 1119 | $1,100 | $0.98 | 43d | 1 | 1.20mi |
| 3615 Berkeley Dr Toledo, OH | 3.0 | 1.0 | 1096 | $1,400 | $1.28 | 13d | 1 | 1.21mi |
| 2734 Powhattan Pkwy Toledo, OH | 2.0 | 1.0 | 1144 | $900 | $0.79 | 43d | 1 | 1.21mi |
| 614 Cadillac Ct Toledo, OH | 3.0 | 1.0 | 1581 | $1,075 | $0.68 | 23d | 1 | 1.23mi |
| 610 Cadillac Ct Toledo, OH | 3.0 | 1.0 | 1409 | $1,050 | $0.75 | 23d | 1 | 1.23mi |
| 425 Boston Pl Unit A Toledo, OH | 2.0 | 1.0 | 1200 | $895 | $0.75 | 23d | 1 | 1.25mi |
| 1140 Palmwood Ave Toledo, OH | 3.0 | 1.0 | 1292 | $1,500 | $1.16 | 43d | 1 | 1.29mi |
| 1014 Berdan Ave Toledo, OH | 3.0 | 1.0 | 1215 | $1,200 | $0.99 | 43d | 1 | 1.33mi |
| 3915 Willys Pkwy Unit 3915 Toledo, OH | 3.0 | 1.0 | 1080 | $800 | $0.74 | 21d | 1 | 1.34mi |
| 1477 W Sylvania Ave Toledo, OH | 3.0 | 1.0 | 1570 | $1,250 | $0.80 | 43d | 1 | 1.39mi |
| 401 W Bancroft St Toledo, OH | 4.0 | 1.0 | 927 | $865 | $0.93 | 23d | 1 | 1.42mi |
| 3430 Anderson Pkwy Toledo, OH | 3.0 | 2.0 | 1372 | $1,650 | $1.20 | 23d | 1 | 1.47mi |
| 1122 Pinewood Ave Toledo, OH | 3.0 | 1.0 | 1559 | $1,150 | $0.74 | 13d | 1 | 1.48mi |
Listing history 20 events
-
2026-06-18days on market $24,900 Active 35 DOM
-
2026-06-17days on market $24,900 Active 34 DOM
-
2026-06-16days on market $24,900 Active 33 DOM
-
2026-06-15days on market $24,900 Active 32 DOM
-
2026-06-14days on market $24,900 Active 30 DOM
-
2026-06-10days on market $24,900 Active 27 DOM
-
2026-06-09days on market $24,900 Active 26 DOM
-
2026-06-08days on market $24,900 Active 25 DOM
-
2026-06-07days on market $24,900 Active 24 DOM
-
2026-06-05days on market $24,900 Active 21 DOM
-
2026-06-03days on market $24,900 Active 20 DOM
-
2026-06-02days on market $24,900 Active 19 DOM
-
2026-06-01days on market $24,900 Active 18 DOM
-
2026-05-31pricedays on market $24,900 Active 17 DOM
-
2026-05-30days on market $29,900 Active 16 DOM
-
2026-05-14$29,900 Active 243-char remark
-
2026-01-06status Active
-
2025-10-16status Pending
-
2025-10-16historical
-
2025-10-14$29,900 Active
ⓘ Source: listings_history table (triggers on properties + properties_extension) + one-shot
backfill from property_details.listing_events for pre-trigger history.
Tax reassessment forecast OH · Partial reset (capped growth)
- Current annual tax
- $1,004 · $84/mo
- Projected year-2 tax
- $1,004 · $84/mo
- Expected delta
- $0/yr ($0/mo · 0.0%)
ⓘ Screening estimate from a state-policy table — verify with the county assessor before closing.
Climate risk First Street
- Flood 1/10 Low FEMA zone X (unshaded) · 0% chance over 30 yrs
- Wildfire 1/10 Low
- Heat 3/10 Moderate 7 d/yr ≥101°F today · 16 d/yr by 30 yrs out
- Wind 2/10 Low
- Air quality 2/10 Low 1 unhealthy d/yr today · 3 by 30 yrs out
Nearby sold comps map
Loading sold comps map…
Walkable amenities ~0.75 mi
Loading nearby amenities…
Taxation est. · year 1
- Rental income
- $14,048
- − Mortgage interest
- −$1,395
- − Property taxes
- −$1,004
- − Insurance
- −$124
- − Repairs & maintenance
- −$1,124
- − Management
- −$1,124
- − Depreciation
- −$724
- Taxable income
- $8,553
- Est. tax owed @ 24.0%
- −$2,053
- After-tax cash flow
- $6,350/yr
For passive investors: Depreciation is non-cash, so a rental often shows a tax loss while cash-flowing — sheltering income. Rental losses are passive: they offset passive income freely, and up to $25,000/yr can offset ordinary (W-2) income if you actively participate and your MAGI is under $100k (phasing out to $0 by $150k); unused losses carry forward. On sale, claimed depreciation is recaptured at up to 25%, and gains may owe capital-gains tax (a 1031 exchange can defer both). Figures are a year-1 estimate at your 24.0% rate — not tax advice; consult a CPA.
Schools (NCES district)
- District
- Toledo City
- NCES district ID
- 3904490
- Math proficiency
- 15% ▼ -16.00%
- Reading proficiency
- 24% ▼ -13.00%
- Median HH income
- $32,137
- Composite
- 15.76/100
- National rank
- #9276
- State rank
- #634 of 656 in OH
Livability — Toledo
- Score
- 66/100
- State rank
- #645
- US rank
- #11442
Category grades
Schools grade is shown separately in the Schools card above.
Census & demographics
- Census place
- Toledo, OH
- County
- Lucas County · 380,724 people
- City population
- 280,811
- Metro
- Toledo, OH
- Population (ZIP)
- 24,898
- Household income
- $66,917
- Rent vs Own
- Severe rent burden
- 843.0
Population outlook (Lucas County) Hauer SSP2
- Today (2025)
- 420,751 people
- By 2030
- 410,187 · -2.5%
- By 2040
- 384,019 · -8.7%
- By 2050
- 355,125 · -15.6%
- By 2075
- 291,683 · -30.7%
- By 2100
- 233,670 · -44.5%
Race, ethnicity, and origin ACS 2023
- Neighborhood character
- Diverse neighborhood (Simpson 0.57)
- Race & ethnicity
- White 59% Black 29% Two or more races 7% Hispanic / Latino 4% Asian 3%
- Common ancestry
- Romanian 6% Italian 2% Lithuanian 1%
- Foreign-born
- 7% · Canada, China, South Korea
- Languages at home
- 92% English-only · Arabic 2% Other Indo-European 2% Spanish 1%
Political lean MEDSL · Lucas
- 2024 margin
- D (+12.6) · D 55.8% · R 43.2%
- 2008→2024 swing
- -18.9pp toward R · 2008: 31.4pp · 2024: 12.6pp
- All cycles
- 2024: D+12.6 2020: D+16.8 2016: D+17.4 2012: D+30.4 2008: D+31.4
Not yet ingested
- Civics
- —
Market trends
- HPI YoY
- ▼ -41.19%
- Current HPI
- 224.695
- Rent YoY
- ▲ 2.29%
- Metro
- Toledo, OH
- State GDP YoY
- ▲ 1.98%
- F500 in state
- 48
Industry mix (Fortune 500 HQ in OH)
| Industry | F500 HQs | Revenue |
|---|---|---|
| Insurance | 3 | $145B |
|
||
| Industrial Machinery | 3 | $49B |
|
||
| Financial Services | 3 | $24B |
|
||
| Consumer Goods | 2 | $93B |
|
||
| Aerospace / Defense | 2 | $47B |
|
||
| Utilities | 2 | $33B |
|
||
Price history
-16.7% since first listed6 events — show timeline
- 2026-05-31 Price Changed $24,900 NORIS
- 2026-05-14 Listed $29,900 NORIS
- 2026-01-06 Relisted — NORIS
- 2025-10-16 Pending — NORIS
- 2025-10-16 Listing Removed — NORIS
- 2025-10-14 Listed $29,900 NORIS
Property tax history
+20.1%/yrLatest (2025): $1,004 · +1.3% YoY. Source: county tax records.
Cash-flow waterfall
monthlySold comps — $/sqft
last 12 mo · ≤1 miLoading sold comps…