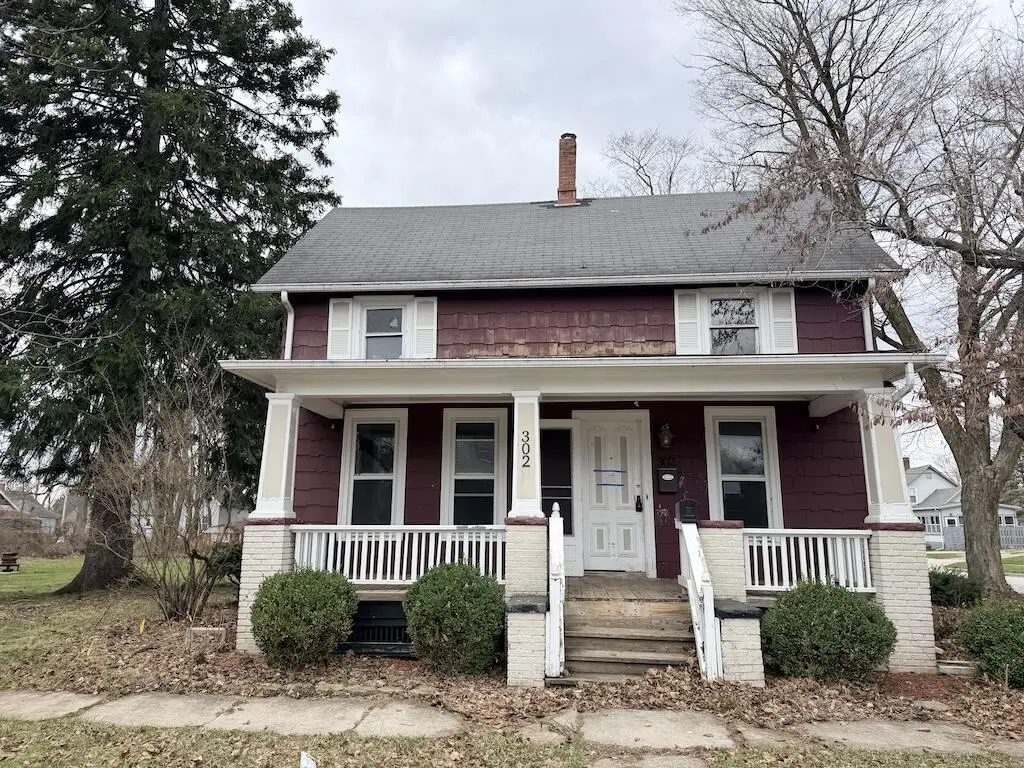
302 G St · La Porte, IN
Flood risk 1/10 · Minimal
- FEMA flood zone
- X (unshaded)
- Chance of flooding over 30 yrs
- 0.0%
- Est. flood insurance / yr
- $473 – $860
Fire risk 1/10 · Minimal
- Est. fire insurance / yr
- $717 – $1,331
Heat risk 2/10 · Minimal
- Hot days now (above 99°F)
- 7 days/yr
- Hot days in 30 yrs
- 15 days/yr
Wind risk 2/10 · Minimal
- Chance of severe wind over 30 yrs
- —
Air-quality risk 2/10 · Minimal
- Unhealthy air days now
- 2 days/yr
- Unhealthy air days in 30 yrs
- 2 days/yr
Risk factors via First Street. Map © Google.
Why this score? — see what drove the B+ grade
The composite is a weighted blend of 9 inputs, each scored 0–100. Each bar is that input's sub-score; the figure is the points it added to the 100-point composite (weight × sub-score).
- Cash flow +30.0/30.0
- ARV discount +15.0/15.0
- DSCR +10.0/10.0
- 1% rule +9.5/10.0
- Livability +3.7/5.0
- Schools +3.5/10.0
- Rent growth +2.5/5.0
- Condition / age +2.5/5.0
- Appreciation +0.0/10.0
$115,000
🖨 Deal sheet 📄 Offer letter ✓ Due diligence
Listing remarks MLS
Quaint 2-story home located on a nice corner lot in LaPorte, IN. Large fenced in yard. Have some coffee, read a book, or just simply sit on your large covered front porch and enjoy your views. This home features a nice working kitchen with large center island, tiled back splash, wood beam ceilings and more! Lots of old world charm can still be found throughout this home as well as some modern updates. Unique built-ins can be found showcased in the home. Outside the yard is nicely landscaped with matured trees and plenty of room or entertaining. This home won't last long. .. .. Priced to sell!
Key facts
- Enclosed side porch
- Basement
- Front porch
Tags
Property features AI
Finance
- Other: Occupant status: Vacant
Exterior
- Parking: Detached garage; 1 garage space
- Utilities: Public water; Public sewer
- Home design: Two-story residence; Built in 1865
- Construction: Has basement (unfinished)
- Exterior features: Neighborhood view; Public water; Public sewer
Interior
- Kitchen: No appliances included
- Bedrooms: Primary bedroom; Bedroom 2; Bedroom 3; Bedroom 4; Bedroom 5
- Bathrooms: 2 full bathrooms
- Heating & cooling: Natural gas heating; No cooling system
- Interior features: Ceiling fan(s); Unfinished basement
- Laundry & utility: Washer/Dryer not listed
Neighborhood map
What this means for you Summary
Snapshot
- This is a 5-bed/2.0-bath single-family listed at $115k.
Deal economics
- At list price, monthly cash flow is $535 ($6k/yr) — positive.
- The deal already cash-flows at list — no discount required.
- Meets the 1% rule at list price ($2k rent vs $115k).
- Recommended offer: $113k (1.5% below list) — sets the bar for market timing.
- Cap rate 11.9% vs local median 3.7% in La Porte — top-decile yield for the area; either an underpriced asset or a hidden risk that comps aren't pricing in. Stress-test before assuming the spread holds.
Location & tenants
- Location reads 74/100 on livability (#81 in IN, #4,852 nationally) — a middle-class / working-renter tenant base. Strengths: amenities A+, cost of living A+, housing A+; Watch: schools C-, commute F, employment F.
- Laporte Community School Corporation (urban): math 37% / reading 44% proficiency, ranked #139 of 301 in IN (top 46%) — families likely to look elsewhere, expect single-tenant / working-renter base with shorter leases.
- Market conditions: 260 active listings in the ZIP; 216 units permitted in LaPorte County in 2024 (75 in 5+ unit buildings).
Forward outlook
- Local home prices are declining (-3.0%/yr); year-one equity from $795 of loan paydown is wiped out by about $3k of value loss. Plan a longer hold.
- LaPorte County population projected to shrink 7% by 2050 — rents likely to lag national; underwrite the cash flow, not the appreciation.
- At projected returns (-3.0% appreciation + 3.0% rent growth), your $32k cash investment doubles in ~7 years — after that, you're playing with house money.
Negotiation context
- It's been on market 19 days — a 2% lower offer ($113k) is reasonable based on typical stale-listing flexibility.
- 7 sale attempts since 25y ago with the ask held roughly flat each time — persistent listings suggest the price (not the market) is what's stuck; bring a comps-based counter.
Risks & watch-outs
- Watch-outs: built in 1865 — expect roof / HVAC / electrical / plumbing capex.
Questions for the listing agent
- Built in 1865 — when were the roof, HVAC, electrical panel, plumbing, and water heater last replaced?
- Is there a deadline driving the sale (1031 exchange, divorce, estate, relocation)? That informs how much negotiation room exists.
- What's the average days-on-market for RENTAL listings here right now (not sales)? A rising rental-DOM trend means longer vacancies and softer asking-rent achievability than the comps imply.
- What's the recent tenant-quality profile in this submarket — average credit score on applications, eviction rate, late-payment / NSF rate, and stable-employment percentage? A property-management company in the area should have these aggregated.
- How much new for-sale + rental construction is in the pipeline within 1–3 miles? Heavy new supply typically softens prices + rents 12–24 months out; constrained supply supports both.
Investment metrics
- 1% rule
- 1.45% ✓
- Cap rate
- 11.87%
- Cash-on-cash
- 19.92%
- DSCR
- 1.89
- GRM
- 5.7
CMA / ARV
- ARV (on-the-fly)
- $193,536
- Comps found
- 10
Show comp detail 10 sales within ~0.75 mi
| Address | Dist | Beds/Ba | Sqft | Sold | Price | $/sf | Match |
|---|---|---|---|---|---|---|---|
| 302 G St | 0.00mi | 5/2.0 | 1,728 (0%) | 0mo | $114,000 | $66 | 100 |
| 501 C St | 0.31mi | 4/2.0 (-1) | 1,858 (+8%) | 1mo | $179,000 | $96 | 67 |
| 411 E St | 0.18mi | 4/2.0 (-1) | 1,958 (+13%) | 1mo | $240,000 | $123 | 64 |
| 816 E St | 0.37mi | 4/1.0 (-1) | 1,752 (+1%) | 16mo | $164,900 | $94 | 58 |
| 1011 Jackson St | 0.68mi | 4/2.0 (-1) | 1,800 (+4%) | 1mo | $128,000 | $71 | 55 |
| 815 F St | 0.36mi | 4/2.0 (-1) | 1,856 (+7%) | 19mo | $240,000 | $129 | 50 |
| 421 Kenwood St | 0.74mi | 4/1.5 (-1) | 1,606 (-7%) | 4mo | $235,000 | $146 | 44 |
| 823 Eason Ct | 0.65mi | 4/1.5 (-1) | 1,568 (-9%) | 8mo | $256,900 | $164 | 40 |
| 1532 2nd St | 0.73mi | 4/2.0 (-1) | 1,787 (+3%) | 22mo | $200,000 | $112 | 37 |
| 403 Wabash Ave | 0.47mi | 5/4.0 | 1,976 (+14%) | 14mo | $199,000 | $101 | 35 |
Match score weights: distance 35% · size 25% · config 20% · recency 20%. Top-matched comps best support the ARV.
Projected returns pro-forma
-3.0% appreciation · 3.0% rent growth · sell at horizon
- IRR
- 12.1%
- Equity multiple
- 1.48×
- Total profit
- $15,433
- Equity at exit
- $17,147
- IRR
- 21.0%
- Equity multiple
- 2.78×
- Total profit
- $57,363
- Equity at exit
- $9,943
Cash invested: $32,200 (down + closing). Projections, not guarantees.
Landlord ↔ Tenant lean methodology
- Overall (STATE)
- 90 Strongly Landlord-Friendly
- State Indiana
- 90 Strongly Landlord-Friendly · R+11
- County
- — inherits STATE
- City
- — inherits STATE
ZIP-level market 46350
- Active inventory
- 260
- Price-to-rent
- 5.7×
Monthly cashflow live
- Estimated rent
- $1,672 medium interval (Pro) →
- Mortgage (P&I)
- −$603
- Tax from tax record
- −$135 /mo · $1,620/yr
- Insurance
- −$48
- HOA
- −$0
- Vacancy / Maint / Mgmt
- −$351
- Net cashflow
- $535
Break-even live
UW: 25.0% down · 7.5% · 30yr · 1.5% tax · 5.0% vac · 8.0% maint · 8.0% mgmt
Financing live
Cash to close
- Down payment
- $28,750
- Closing costs
- $3,450
- Reserves months
- —
- Total cash needed
- —
Loan-product check · same deal, 3 products live
Conventional
25% down · 7.5% · 30yr
- Down + closing
- —
- Monthly P&I
- —
- Monthly cashflow
- —
- DSCR
- —
- Eligible?
- —
Personal DTI + credit; lowest rate.
DSCR
20% down · 8.5% · 30yr
- Down + closing
- —
- Monthly P&I
- —
- Monthly cashflow
- —
- DSCR
- —
- Eligible?
- —
No personal income docs; deal must DSCR.
Hard money
10% down · 12.0% · 12mo
- Down + closing
- —
- Monthly P&I
- —
- Monthly cashflow
- —
- DSCR
- —
- Eligible?
- —
Short-term bridge; refi at stabilization.
Listing history 14 events
-
2026-04-29status Pending
-
2026-04-10$115,000 Active
-
2019-10-23soldstatus $145,350 599-char remark
Show marketing remark (599 chars)
Quaint 2-story home located on a nice corner lot in LaPorte, IN. Large fenced in yard. Have some coffee, read a book, or just simply sit on your large covered front porch and enjoy your views. This home features a nice working kitchen with large center island, tiled back splash, wood beam ceilings and more! Lots of old world charm can still be found throughout this home as well as some modern updates. Unique built-ins can be found showcased in the home. Outside the yard is nicely landscaped with matured trees and plenty of room or entertaining. This home won't last long. .. .. Priced to sell!
-
2019-09-14$145,822 599-char remark
Show marketing remark (599 chars)
Quaint 2-story home located on a nice corner lot in LaPorte, IN. Large fenced in yard. Have some coffee, read a book, or just simply sit on your large covered front porch and enjoy your views. This home features a nice working kitchen with large center island, tiled back splash, wood beam ceilings and more! Lots of old world charm can still be found throughout this home as well as some modern updates. Unique built-ins can be found showcased in the home. Outside the yard is nicely landscaped with matured trees and plenty of room or entertaining. This home won't last long. .. .. Priced to sell!
-
2015-07-28soldstatus $99,900 370-char remark
Show marketing remark (370 chars)
Looking for a 5 bedroom charmer with 2 bathrooms, look no more! Updated kitchen and baths. Open Concept Living and Dining Room. Basement Rec Room for more storage and entertainment area. Enclosed porch for your entertainment. 2 car detached garage and separate fenced in yard. Come and see for yourself! (Multiple Offers Best and Final Due by 5/24/15 5PM Central Time).
-
2015-05-18$99,900 370-char remark
Show marketing remark (370 chars)
Looking for a 5 bedroom charmer with 2 bathrooms, look no more! Updated kitchen and baths. Open Concept Living and Dining Room. Basement Rec Room for more storage and entertainment area. Enclosed porch for your entertainment. 2 car detached garage and separate fenced in yard. Come and see for yourself! (Multiple Offers Best and Final Due by 5/24/15 5PM Central Time).
-
2013-01-18soldstatus $42,000
-
2012-10-11$44,900
-
2009-12-10historical
-
2008-12-09$105,900
-
2007-11-21historical
-
2006-11-02$118,500
-
2001-09-07historical
-
2001-05-05$109,900
ⓘ Source: listings_history table (triggers on properties + properties_extension) + one-shot
backfill from property_details.listing_events for pre-trigger history.
Tax reassessment forecast IN · Partial reset (capped growth)
- Current annual tax
- $1,620 · $135/mo
- Projected year-2 tax
- $1,620 · $135/mo
- Expected delta
- $0/yr ($0/mo · 0.0%)
ⓘ Screening estimate from a state-policy table — verify with the county assessor before closing.
Climate risk First Street
- Flood 1/10 Low FEMA zone X (unshaded) · 0% chance over 30 yrs
- Wildfire 1/10 Low
- Heat 2/10 Low 7 d/yr ≥99°F today · 15 d/yr by 30 yrs out
- Wind 2/10 Low
- Air quality 2/10 Low 2 unhealthy d/yr today · 2 by 30 yrs out
Nearby sold comps map
Loading sold comps map…
Walkable amenities ~0.75 mi
Loading nearby amenities…
Taxation est. · year 1
- Rental income
- $20,060
- − Mortgage interest
- −$6,442
- − Property taxes
- −$1,620
- − Insurance
- −$575
- − Repairs & maintenance
- −$1,605
- − Management
- −$1,605
- − Depreciation
- −$3,345
- Taxable income
- $4,868
- Est. tax owed @ 24.0%
- −$1,168
- After-tax cash flow
- $5,247/yr
For passive investors: Depreciation is non-cash, so a rental often shows a tax loss while cash-flowing — sheltering income. Rental losses are passive: they offset passive income freely, and up to $25,000/yr can offset ordinary (W-2) income if you actively participate and your MAGI is under $100k (phasing out to $0 by $150k); unused losses carry forward. On sale, claimed depreciation is recaptured at up to 25%, and gains may owe capital-gains tax (a 1031 exchange can defer both). Figures are a year-1 estimate at your 24.0% rate — not tax advice; consult a CPA.
Schools (NCES district)
- District
- Laporte Community School Corporation
- NCES district ID
- 1805580
- Math proficiency
- 37% ▼ -13.00%
- Reading proficiency
- 44% ▼ -11.00%
- Median HH income
- $46,761
- Composite
- 34.58/100
- National rank
- #5162
- State rank
- #139 of 301 in IN
Livability — La Porte
- Score
- 74/100
- State rank
- #81
- US rank
- #4852
Category grades
Schools grade is shown separately in the Schools card above.
Census & demographics
- Census place
- La Porte, IN
- County
- La Porte County · 88,580 people
- City population
- 44,763
- Metro
- Michigan City-La Porte, IN
- Population (ZIP)
- 44,763
- Household income
- $74,307
- Rent vs Own
- Severe rent burden
- 835.0
Population outlook (LaPorte County) Hauer SSP2
- Today (2025)
- 109,757 people
- By 2030
- 108,288 · -1.3%
- By 2040
- 105,070 · -4.3%
- By 2050
- 102,330 · -6.8%
- By 2075
- 97,009 · -11.6%
- By 2100
- 86,459 · -21.2%
Race, ethnicity, and origin ACS 2023
- Neighborhood character
- Predominantly White (82%)
- Race & ethnicity
- White 82% Two or more races 8% Hispanic / Latino 8% Black 3%
- Hispanic origin (detail)
- Mexican 6%
- Common ancestry
- Romanian 11% Iranian 3% Italian 2%
- Foreign-born
- 4% · Canada
- Languages at home
- 93% English-only · Spanish 4% Russian/Polish/Slavic 1% German/W. Germanic 1%
Political lean MEDSL · LaPorte
- 2024 margin
- R (+14.1) · D 42.1% · R 56.2% · Other 1.7%
- 2008→2024 swing
- -19.1pp toward R · 2008: 5.0pp · 2024: -14.1pp
- All cycles
- 2024: R+14.1 2020: R+7.2 2016: R+6.4 2012: D+12.6 2008: D+5.0
Not yet ingested
- Civics
- —
Market trends
- HPI YoY
- ▼ -142.94%
- Current HPI
- 209.2564
- Rent YoY
- —
- Metro
- Michigan City-La Porte, IN
- State GDP YoY
- ▲ 2.90%
- F500 in state
- 18
Industry mix (Fortune 500 HQ in IN)
| Industry | F500 HQs | Revenue |
|---|---|---|
| Industrial Machinery | 2 | $37B |
|
||
| Healthcare | 1 | $177B |
|
||
| Pharmaceuticals | 1 | $45B |
|
||
| Metals / Steel | 1 | $18B |
|
||
| Agriculture | 1 | $17B |
|
||
| Packaging | 1 | $12B |
|
||
Price history
+4.6% since first listed14 events — show timeline
- 2026-04-29 Pending — NIRA MLS as Distributed by MLS Grid
- 2026-04-10 Listed $115,000 NIRA MLS as Distributed by MLS Grid
- 2019-10-23 Sold (MLS) $145,350 NIRA MLS as Distributed by MLS Grid
- 2019-09-14 Listed $145,822 NIRA MLS as Distributed by MLS Grid
- 2015-07-28 Sold (MLS) $99,900 NIRA MLS as Distributed by MLS Grid
- 2015-05-18 Listed $99,900 NIRA MLS as Distributed by MLS Grid
- 2013-01-18 Sold (MLS) $42,000 NIRA MLS as Distributed by MLS Grid
- 2012-10-11 Listed $44,900 NIRA MLS as Distributed by MLS Grid
- 2009-12-10 Listing Removed — NIRA MLS as Distributed by MLS Grid
- 2008-12-09 Listed $105,900 NIRA MLS as Distributed by MLS Grid
- 2007-11-21 Listing Removed — NIRA MLS as Distributed by MLS Grid
- 2006-11-02 Listed $118,500 NIRA MLS as Distributed by MLS Grid
- 2001-09-07 Listing Removed — NIRA MLS as Distributed by MLS Grid
- 2001-05-05 Listed $109,900 NIRA MLS as Distributed by MLS Grid
Property tax history
-0.1%/yrLatest (2024): $1,620 · +13.4% YoY. Source: county tax records.
Cash-flow waterfall
monthlySold comps — $/sqft
last 12 mo · ≤1 miLoading sold comps…