 🏗️ New Construction
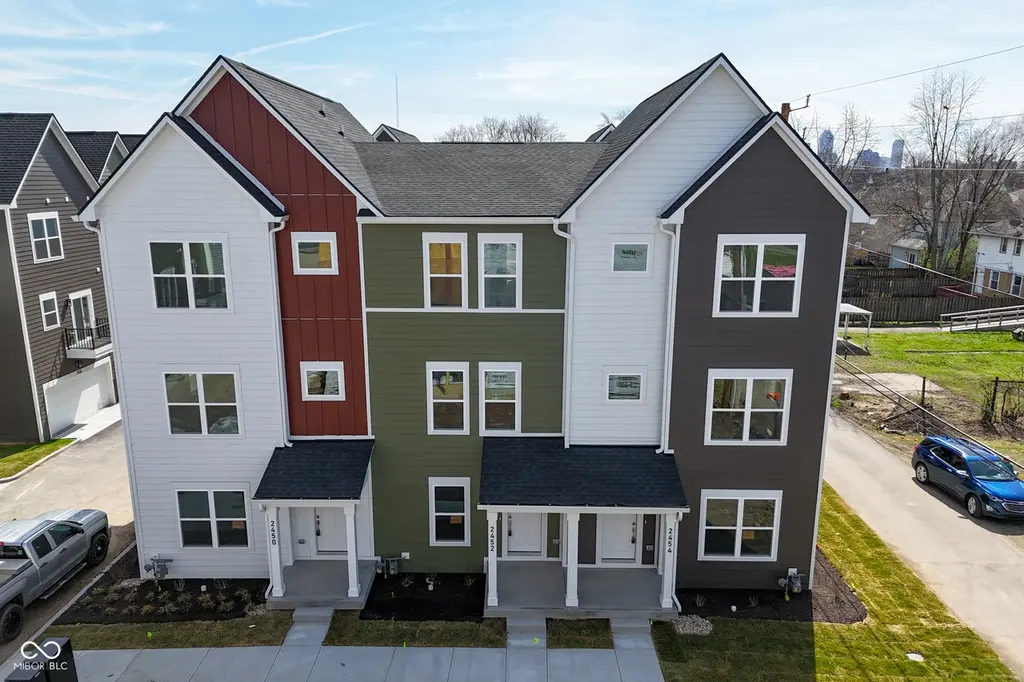
2436 Winthrop Ave · Indianapolis city (balance), IN
Flood risk No data
- FEMA flood zone
- —
- Chance of flooding over 30 yrs
- —
- Est. flood insurance / yr
- —
Fire risk No data
- Est. fire insurance / yr
- —
Heat risk No data
- Hot days now (above threshold)
- —
- Hot days in 30 yrs
- —
Wind risk No data
- Chance of severe wind over 30 yrs
- —
Air-quality risk No data
- Unhealthy air days now
- —
- Unhealthy air days in 30 yrs
- —
Risk factors via First Street. Map © Google.
Why this score? — see what drove the F grade
The composite is a weighted blend of 9 inputs, each scored 0–100. Each bar is that input's sub-score; the figure is the points it added to the 100-point composite (weight × sub-score).
- ARV discount +7.5/15.0
- Rent growth +4.1/5.0
- Condition / age +4.0/5.0
- Cash flow +2.7/30.0
- Livability +2.5/5.0
- Schools +1.4/10.0
- 1% rule +0.0/10.0
- DSCR +0.0/10.0
- Appreciation +0.0/10.0
$165,000
🖨 Deal sheet 📄 Offer letter ✓ Due diligence
Listing remarks
This thoughtfully designed townhome blends modern elegance with everyday functionality. This end unit features luxury fixtures and charm. The main level has a two car garage and a versatile bonus room - perfect for a home office or playroom. The open concept living space is on the second level and has abundant natural light. The kitchen has sleek quartz countertops, stainless steel appliances, and a large center island. The third level hosts the primary suite with a walk in closet and deluxe private bathroom. The additional bedroom, full bathroom, and laundry closet are also on the third level for added convenience. Income restrictions apply. Home must be owner occupied. Finishes in unit ma
Key facts
- Quartz countertops
- Large center island
- Two car garage
Tags
Property features AI
Finance
- Other: Green features: Low/No VOC materials; Energy-efficient windows (low energy windows); Green building verification (HERS Index score, Resnet)
- HOA & community: HOA with monthly fee of $150; HOA includes maintenance and management; Covenants & restrictions and rental restrictions apply
Exterior
- Parking: Attached garage (1 car), garage faces rear; Finished garage with garage door opener
- Utilities: Public water; Municipal sewer connected; Solid waste service available
- Home design: Attached townhouse; New construction; Three or more levels; Low-maintenance lifestyle; Mandatory fee ownership with party wall agreement
- Construction: Cement siding; Slab foundation; Completed construction; Built by Onyx & East
- Exterior features: Covered patio/porch; Balcony; No fence
Interior
- Kitchen: Dishwasher; Microwave with hood; Electric oven; Refrigerator
- Bedrooms: 2 bedrooms on upper level; Primary bedroom with walk-in closet
- Bathrooms: 2 full bathrooms; 1 half bathroom; Primary bathroom with full shower stall and double sinks
- Heating & cooling: Forced air heating (natural gas); Central air conditioning
- Interior features: Kitchen island; Eat-in kitchen; Pantry; Smart thermostat; Walk-in closet(s); Breakfast bar; Living room (upper); Bonus room (main)
- Laundry & utility: Laundry closet on upper level
Neighborhood map
What this means for you Summary
Snapshot
- This is a 2-bed/2.5-bath townhouse listed at $165k. Condition is rated good.
Deal economics
- At list price, monthly cash flow is $-1k ($-14k/yr) — negative.
- The deal already cash-flows at list — no discount required.
- Meets the 1% rule at list price ($2k rent vs $165k).
- Recommended offer: $160k (3.0% below list) — sets the bar for market timing.
- Cap rate 2.3% vs local median 4.4% in Indianapolis city (balance) — below-typical yield; the buyer is paying a premium for something (appreciation thesis, condition, location) that the cap rate doesn't capture.
Location & tenants
- Location reads: area grade F — affects rentability + tenant quality, not the cash-flow math above.
- Indianapolis Public Schools (urban): math 14% / reading 20% proficiency, ranked #286 of 301 in IN (top 95%) — low school quality limits family demand, transient renter base, plan for 1-2y turnover; 77% free/reduced lunch — lower-income household profile, screen leases tightly.
- Market conditions: Rents rising fast (+6.2%/yr); 314 active listings in the ZIP; 40 comparable units currently listed for rent nearby; rentals at typical pace (median 24d on market — plan ~3-4 weeks tenant-placement turnaround); 48% of comp listings sitting > 30 days — soft ceiling on asking rent; 1,906 units permitted in Marion County in 2024 (621 in 5+ unit buildings).
Forward outlook
- Local home prices are declining (-3.0%/yr); year-one equity from $2k of loan paydown is wiped out by about $11k of value loss. Plan a longer hold.
- Marion County population projected at +18% by 2050 — long-run rental-demand tailwind backs the buy-and-hold thesis.
Negotiation context
- It's been on market 48 days — a 3% lower offer ($160k) is reasonable based on typical stale-listing flexibility.
Risks & watch-outs
- Watch-outs: property tax is 3.2% of price.
Questions for the listing agent
- What do current leases actually rent for vs. the listed asking? Can we see a recent rent roll and the last 12 months of T-12 income?
- It's been on market 48 days. Have you received any prior offers? Is the seller open to a 3% concession, seller financing, or rate buy-down credit?
- Property tax is high relative to price — has the assessment been appealed recently, and will the sale trigger a re-assessment?
- What does the HOA fee cover, when was the last increase, and are there any pending special assessments or reserve-fund shortfalls?
- Is there a deadline driving the sale (1031 exchange, divorce, estate, relocation)? That informs how much negotiation room exists.
- The area grade is low — what's the realistic commute time and amenity access for the typical tenant pool here? Any planned neighborhood developments (good or bad) we should know about?
- What's the average days-on-market for RENTAL listings here right now (not sales)? A rising rental-DOM trend means longer vacancies and softer asking-rent achievability than the comps imply.
- What's the recent tenant-quality profile in this submarket — average credit score on applications, eviction rate, late-payment / NSF rate, and stable-employment percentage? A property-management company in the area should have these aggregated.
- How much new for-sale + rental construction is in the pipeline within 1–3 miles? Heavy new supply typically softens prices + rents 12–24 months out; constrained supply supports both.
Investment metrics
- 1% rule
- 0.50% ✗
- Cap rate
- 2.26%
- Cash-on-cash
- -14.39%
- DSCR
- 0.36
- GRM
- 16.5
CMA / ARV
- ARV (median comp)
- $350,327
- List price
- $165,000
- Delta
- -52.90%
- Verdict
- UNDERPRICED
- Comps
- 20 within 1.0 mi
Show comp detail 12 sales within ~0.75 mi
| Address | Dist | Beds/Ba | Sqft | Sold | Price | $/sf | Match |
|---|---|---|---|---|---|---|---|
| 2428 Winthrop Ave | 0.02mi | 2/2.5 | 1,318 (0%) | 10mo | $350,000 | $266 | 90 |
| 2430 Winthrop Ave | 0.02mi | 2/2.5 | 1,318 (0%) | 10mo | $350,000 | $266 | 90 |
| 2420 Winthrop Ave | 0.03mi | 2/2.5 | 1,318 (0%) | 11mo | $350,000 | $266 | 90 |
| 926 E 24th St | 0.05mi | 2/2.5 | 1,318 (0%) | 12mo | $350,000 | $266 | 87 |
| 920 E 24th St | 0.06mi | 2/2.5 | 1,318 (0%) | 12mo | $350,000 | $266 | 87 |
| 2418 Winthrop Ave | 0.04mi | 2/4.5 | 1,318 (0%) | 11mo | $350,000 | $266 | 82 |
| 2413 N Park Ave | 0.36mi | 2/2.5 | 1,408 (+7%) | 4mo | $250,000 | $178 | 69 |
| 530 Sutherland Ave Unit B | 0.44mi | 2/1.0 | 1,428 (+8%) | 2mo | $210,000 | $147 | 58 |
| 530 Sutherland Ave Unit A | 0.44mi | 2/1.0 | 1,428 (+8%) | 2mo | $205,000 | $144 | 57 |
| 530 Sutherland Ave Unit E | 0.45mi | 2/1.0 | 1,428 (+8%) | 3mo | $215,000 | $151 | 56 |
| 2260 Central Ave | 0.52mi | 2/2.5 | 1,197 (-9%) | 9mo | $235,000 | $196 | 53 |
| 2033 Carrollton Ave | 0.52mi | 3/2.5 (+1) | 1,400 (+6%) | 10mo | $110,000 | $79 | 52 |
Match score weights: distance 35% · size 25% · config 20% · recency 20%. Top-matched comps best support the ARV.
Projected returns pro-forma
-3.0% appreciation · 6.21% rent growth · sell at horizon
- IRR
- -40.0%
- Equity multiple
- -0.28×
- Total profit
- $-125,688
- Equity at exit
- $52,235
- IRR
- -41.8%
- Equity multiple
- -0.83×
- Total profit
- $-179,643
- Equity at exit
- $30,290
Cash invested: $98,092 (down + closing). Projections, not guarantees.
Landlord ↔ Tenant lean methodology
- Overall (STATE)
- 90 Strongly Landlord-Friendly
- State Indiana
- 90 Strongly Landlord-Friendly · R+11
- County
- — inherits STATE
- City
- — inherits STATE
ZIP-level market 46205
- Rents YoY
- 6.2%
- Active inventory
- 314
- Price-to-rent
- 7.8×
Monthly cashflow live
- Estimated rent
- $1,765 high interval (Pro) →
- Mortgage (P&I)
- −$1,837
- Tax est. 1.5%
- −$438 /mo · $5,255/yr
- Insurance
- −$146
- HOA
- −$150
- Vacancy / Maint / Mgmt
- −$371
- Net cashflow
- $-1,176
Break-even live
UW: 25.0% down · 7.5% · 30yr · 1.5% tax · 5.0% vac · 8.0% maint · 8.0% mgmt
Financing live
Cash to close
- Down payment
- $87,582
- Closing costs
- $10,510
- Reserves months
- —
- Total cash needed
- —
Loan-product check · same deal, 3 products live
Conventional
25% down · 7.5% · 30yr
- Down + closing
- —
- Monthly P&I
- —
- Monthly cashflow
- —
- DSCR
- —
- Eligible?
- —
Personal DTI + credit; lowest rate.
DSCR
20% down · 8.5% · 30yr
- Down + closing
- —
- Monthly P&I
- —
- Monthly cashflow
- —
- DSCR
- —
- Eligible?
- —
No personal income docs; deal must DSCR.
Hard money
10% down · 12.0% · 12mo
- Down + closing
- —
- Monthly P&I
- —
- Monthly cashflow
- —
- DSCR
- —
- Eligible?
- —
Short-term bridge; refi at stabilization.
Rent comps 40 comps
| Address | Beds | Baths | Sqft | Rent | $/sqft | DOM | Units | Dist |
|---|---|---|---|---|---|---|---|---|
| 2529 Guilford Ave Unit A Indianapolis, IN | 2.0 | 1.5 | 1000 | $1,495 | $1.50 | 44d | 1 | 0.14mi |
| 2519 N College Ave Unit 1 Indianapolis, IN | 3.0 | 2.5 | 1416 | $1,850 | $1.31 | 44d | 1 | 0.21mi |
| 2340 Columbia Ave Unit 2340-B Indianapolis, IN | 3.0 | 2.0 | 1350 | $1,650 | $1.22 | 44d | 1 | 0.23mi |
| 2221 Bellefontaine St Indianapolis, IN | 3.0 | 2.5 | 1712 | $2,349 | $1.37 | 24d | 1 | 0.25mi |
| 2711 Guilford Ave Indianapolis, IN | 3.0 | 2.0 | 1250 | $1,695 | $1.36 | 24d | 1 | 0.27mi |
| 717 E 27th St Indianapolis, IN | 1.0 | 1.5 | 1322 | $2,600 | $1.97 | 44d | 1 | 0.28mi |
| 2549 Columbia Ave Unit 1332865P Indianapolis, IN | 3.0 | 2.0 | 893 | $2,274 | $2.55 | 2d | 1 | 0.30mi |
| 2553 Columbia Ave Unit 2553-B Indianapolis, IN | 3.0 | 2.0 | 1350 | $1,525 | $1.13 | 44d | 1 | 0.31mi |
| 2157 Bellefontaine St Unit 2157 Indianapolis, IN | 2.0 | 1.0 | 1200 | $1,200 | $1.00 | 24d | 1 | 0.31mi |
| 2707 N College Ave Indianapolis, IN | 3.0 | 2.0 | 1500 | $2,200 | $1.47 | 18d | 1 | 0.31mi |
| 2709 N College Ave Indianapolis, IN | 3.0 | 2.0 | 1500 | $2,200 | $1.47 | 24d | 1 | 0.32mi |
| 2168 Carrollton Ave Indianapolis, IN | 3.0 | 1.5 | 1300 | $1,799 | $1.38 | 3d | 1 | 0.33mi |
| 2751 Guilford Ave Unit Aunit Indianapolis, IN | 3.0 | 2.0 | 1250 | $1,750 | $1.40 | 44d | 1 | 0.35mi |
| 2751 Guilford Ave Unit B Indianapolis, IN | 3.0 | 2.0 | 1250 | $1,750 | $1.40 | 14d | 1 | 0.35mi |
| 2145 Coretta Way Indianapolis, IN | 3.0 | 3.0 | 1430 | $2,600 | $1.82 | 44d | 1 | 0.36mi |
| 1313 E 22nd St Indianapolis, IN | 2.0 | 2.5 | 1325 | $2,750 | $2.08 | 18d | 1 | 0.39mi |
| 2117 Coretta Way Indianapolis, IN | 3.0 | 3.5 | 1409 | $2,300 | $1.63 | 44d | 1 | 0.39mi |
| 2757 Columbia Ave Unit 2757-B Indianapolis, IN | 3.0 | 2.0 | 1350 | $1,525 | $1.13 | 44d | 1 | 0.41mi |
| 2056 N College Ave Indianapolis, IN | 3.0 | 2.0 | 900 | $1,650 | $1.83 | 3d | 1 | 0.49mi |
| 2203 Sheldon St Unit B Indianapolis, IN | 3.0 | 2.0 | 1350 | $1,500 | $1.11 | 44d | 1 | 0.51mi |
| 2830 N Park Ave Indianapolis, IN | 2.0 | 3.0 | 1500 | $1,600 | $1.07 | 44d | 1 | 0.54mi |
| 2318 N New Jersey St Unit 1364144P Indianapolis, IN | 3.0 | 2.0 | 1593 | $3,330 | $2.09 | 12d | 1 | 0.55mi |
| 2950 Winthrop Ave Indianapolis, IN | 3.0 | 2.0 | 1224 | $1,449 | $1.18 | 44d | 1 | 0.56mi |
| 2136 Central Ave Indianapolis, IN | 3.0 | 1.0–2.0 | 1325 | $2,766 | $2.09 | 2d | 33 | 0.60mi |
| 2920 Ruckle St Indianapolis, IN | 3.0 | 1.5 | 1272 | $1,700 | $1.34 | 8d | 1 | 0.64mi |
| 2958 N Park Ave Unit 2958 Indianapolis, IN | 3.0 | 1.5 | 1350 | $1,450 | $1.07 | 3d | 1 | 0.66mi |
| 2960 N Park Ave Indianapolis, IN | 3.0 | 1.5 | 1400 | $1,550 | $1.11 | 24d | 1 | 0.66mi |
| 2960 N Park Ave Indianapolis, IN | 3.0 | 2.0 | 1400 | $1,595 | $1.14 | 44d | 1 | 0.66mi |
| 2950 Ruckle St Indianapolis, IN | 3.0 | 1.0 | 1450 | $1,300 | $0.90 | 44d | 1 | 0.68mi |
| 2205 N Delaware St Indianapolis, IN | 2.0 | 1.0–2.0 | 946 | $1,950 | $2.06 | 11d | 5 | 0.70mi |
| 3110 Guilford Ave Indianapolis, IN | 3.0 | 1.5 | 1250 | $1,295 | $1.04 | 24d | 1 | 0.71mi |
| 3106 N College Ave Indianapolis, IN | 3.0 | 1.5 | 1400 | $1,700 | $1.21 | 8d | 1 | 0.75mi |
| 2437 N Pennsylvania St Indianapolis, IN | 3.0 | 2.0 | 1400 | $1,650 | $1.18 | 24d | 1 | 0.76mi |
| 2805 N Talbott St Indianapolis, IN | 3.0 | 2.0 | 1296 | $1,800 | $1.39 | 44d | 1 | 0.76mi |
| 3139 Guilford Ave Indianapolis, IN | 3.0 | 1.0 | 1068 | $1,345 | $1.26 | 44d | 1 | 0.76mi |
| 2809 N Talbott St Indianapolis, IN | 3.0 | 2.0 | 1250 | $1,750 | $1.40 | 44d | 1 | 0.77mi |
| 2813 N Talbott St Indianapolis, IN | 3.0 | 2.0 | 1297 | $1,800 | $1.39 | 44d | 1 | 0.77mi |
| 2801 N Talbott St Unit A Indianapolis, IN | 3.0 | 2.0 | 1296 | $1,850 | $1.43 | 44d | 1 | 0.77mi |
| 2372 Beckwith Dr Indianapolis, IN | 4.0 | 1.0–1.5 | 779 | $1,064 | $1.36 | 2d | 32 | 0.77mi |
| 3203 Sutherland Ave Unit 1310761P Indianapolis, IN | 2.0 | 1.0 | 1097 | $3,668 | $3.34 | 2d | 1 | 0.79mi |
HOA detail
- Monthly dues
- $150 · $1,800/yr
Listing history 14 events
-
2026-06-18days on market $165,000 Active 48 DOM
-
2026-06-17days on market $165,000 Active 47 DOM
-
2026-06-16days on market $165,000 Active 46 DOM
-
2026-06-15days on market $165,000 Active 45 DOM
-
2026-06-13days on market $165,000 Active 43 DOM
-
2026-06-13days on market $165,000 Active 42 DOM
-
2026-06-09days on market $165,000 Active 39 DOM
-
2026-06-08days on market $165,000 Active 38 DOM
-
2026-06-07days on market $165,000 Active 37 DOM
-
2026-06-03days on market $165,000 Active 33 DOM
-
2026-06-02days on market $165,000 Active 32 DOM
-
2026-06-01days on market $165,000 Active 31 DOM
-
2026-05-31days on market $165,000 Active 30 DOM
-
2026-04-30$165,000 Active 720-char remark
ⓘ Source: listings_history table (triggers on properties + properties_extension) + one-shot
backfill from property_details.listing_events for pre-trigger history.
Nearby sold comps map
Loading sold comps map…
Walkable amenities ~0.75 mi
Loading nearby amenities…
Taxation est. · year 1
- Rental income
- $21,185
- − Mortgage interest
- −$19,624
- − Property taxes
- −$5,255
- − Insurance
- −$1,752
- − Repairs & maintenance
- −$1,695
- − Management
- −$1,695
- − HOA
- −$1,800
- − Depreciation
- −$10,191
- Taxable loss
- −$20,826
- Est. tax savings @ 24.0%
- +$4,998
- After-tax cash flow
- $-9,118/yr
For passive investors: Depreciation is non-cash, so a rental often shows a tax loss while cash-flowing — sheltering income. Rental losses are passive: they offset passive income freely, and up to $25,000/yr can offset ordinary (W-2) income if you actively participate and your MAGI is under $100k (phasing out to $0 by $150k); unused losses carry forward. On sale, claimed depreciation is recaptured at up to 25%, and gains may owe capital-gains tax (a 1031 exchange can defer both). Figures are a year-1 estimate at your 24.0% rate — not tax advice; consult a CPA.
Condition & rehab AI · 12 photos
This thoughtfully designed townhome is in excellent condition with modern fixtures and charm. It is move-in ready and offers a great value for both resale and rental.
Value-add opportunities
- Both Painting the exterior and interior walls — Fresh paint enhances curb appeal and interior aesthetics.
- Both Landscaping improvements — Enhances curb appeal and adds value to the property.
- Both Adding smart home features — Improves convenience and adds value to the property.
- Both Upgrading the kitchen appliances — Modernizes the kitchen and adds value to the property.
Renovation cost estimate screening
Value-add ROI direction
- Both Painting the exterior and interior walls — Fresh paint enhances curb appeal and interior aesthetics. ↑
- Both Landscaping improvements — Enhances curb appeal and adds value to the property. ↑
- Both Adding smart home features — Improves convenience and adds value to the property. ↑
- Both Upgrading the kitchen appliances — Modernizes the kitchen and adds value to the property. ↑
ⓘ Cost ranges are severity-bucket heuristics (US national rule-of-thumb). Get contractor quotes + a written scope before underwriting a rehab budget.
Schools (NCES district)
- District
- Indianapolis Public Schools
- NCES district ID
- 1804770
- Math proficiency
- 14% ▼ -7.00%
- Reading proficiency
- 20% ▼ -3.00%
- Median HH income
- $32,034
- Composite
- 13.69/100
- National rank
- #9499
- State rank
- #286 of 301 in IN
Livability — Indianapolis city (balance)
No livability data for this city. (Only ~50 U.S. cities are tracked.)
Census & demographics
- Census place
- Indianapolis city (balance), IN
- County
- Marion County · 998,460 people
- City population
- 881,119
- Metro
- Indianapolis-Carmel-Anderson, IN
- Population (ZIP)
- 28,259
- Household income
- $72,417
- Rent vs Own
- Severe rent burden
- 1149.0
Population outlook (Marion County) Hauer SSP2
- Today (2025)
- 1,025,572 people
- By 2030
- 1,065,727 · +3.9%
- By 2040
- 1,141,577 · +11.3%
- By 2050
- 1,208,920 · +17.9%
- By 2075
- 1,367,288 · +33.3%
- By 2100
- 1,438,201 · +40.2%
Race, ethnicity, and origin ACS 2023
- Neighborhood character
- Diverse neighborhood (Simpson 0.64)
- Race & ethnicity
- White 50% Black 32% Two or more races 10% Hispanic / Latino 7% Asian 3%
- Hispanic origin (detail)
- Mexican 4%
- Common ancestry
- Italian 3% Slovak 2% Romanian 2%
- Foreign-born
- 5% · Canada
- Languages at home
- 89% English-only · Spanish 6% Other Indo-European 2% German/W. Germanic 1%
Political lean MEDSL · Marion
- 2024 margin
- Strong D (+27.7) · D 63.0% · R 35.3% · Other 1.7%
- 2008→2024 swing
- -0.7pp no change · 2008: 28.4pp · 2024: 27.7pp
- All cycles
- 2024: D+27.7 2020: D+29.1 2016: D+22.8 2012: D+22.2 2008: D+28.4
Not yet ingested
- Civics
- —
Market trends
- HPI YoY
- ▼ -322.77%
- Current HPI
- 380.5407
- Rent YoY
- ▲ 6.21%
- Metro
- Indianapolis-Carmel-Anderson, IN
- State GDP YoY
- ▲ 2.90%
- F500 in state
- 18
Industry mix (Fortune 500 HQ in IN)
| Industry | F500 HQs | Revenue |
|---|---|---|
| Industrial Machinery | 2 | $37B |
|
||
| Healthcare | 1 | $177B |
|
||
| Pharmaceuticals | 1 | $45B |
|
||
| Metals / Steel | 1 | $18B |
|
||
| Agriculture | 1 | $17B |
|
||
| Packaging | 1 | $12B |
|
||
Price history
1 event — show timeline
- 2026-04-30 Listed $165,000 MIBOR as Distributed by MLS Grid
Cash-flow waterfall
monthlySold comps — $/sqft
last 12 mo · ≤1 miLoading sold comps…