4295 W Taral Terrace Dr · Sims, MI
Flood risk 1/10 · Minimal
- FEMA flood zone
- X (unshaded)
- Chance of flooding over 30 yrs
- 0.0%
- Est. flood insurance / yr
- $507 – $1,088
Fire risk 1/10 · Minimal
- Est. fire insurance / yr
- $784 – $1,456
Heat risk 1/10 · Minimal
- Hot days now (above 93°F)
- 7 days/yr
- Hot days in 30 yrs
- 13 days/yr
Wind risk 1/10 · Minimal
- Chance of severe wind over 30 yrs
- —
Air-quality risk 2/10 · Minimal
- Unhealthy air days now
- 1 days/yr
- Unhealthy air days in 30 yrs
- 1 days/yr
Risk factors via First Street. Map © Google.
Why this score? — see what drove the C- grade
The composite is a weighted blend of 9 inputs, each scored 0–100. Each bar is that input's sub-score; the figure is the points it added to the 100-point composite (weight × sub-score).
- Cash flow +17.9/30.0
- ARV discount +15.0/15.0
- DSCR +5.6/10.0
- 1% rule +4.8/10.0
- Schools +3.6/10.0
- Rent growth +2.5/5.0
- Livability +2.5/5.0
- Condition / age +2.5/5.0
- Appreciation +0.0/10.0
$115,000
🖨 Deal sheet 📄 Offer letter ✓ Due diligence
Listing remarks
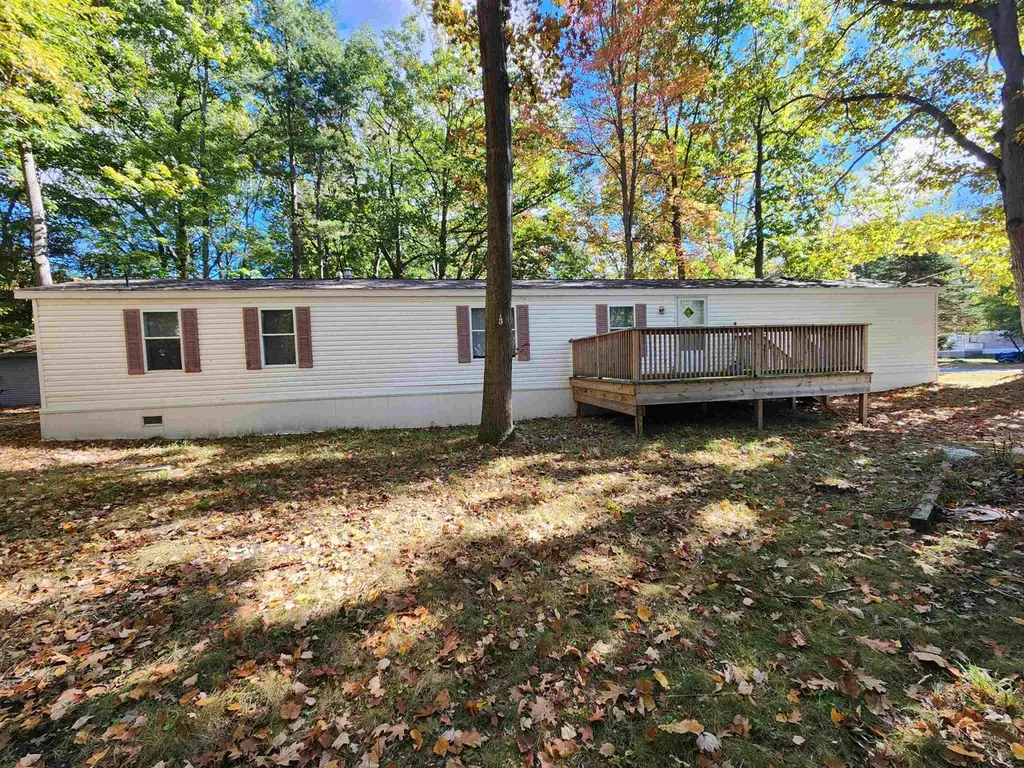
Beautiful, fully furnished, 3 bed, 2 full bath home on a half acre lot. Affidavit of Affixture has been approved and recorded. Newer furnace and hot water heater, two wall a/c units. Also, on the property are 3 sheds, one shed is approximately 10x25 in like new condition, with metal roof. BONUS! Property comes with access to two private beaches on beautiful Lake Huron and is located close to Northport Marina. Get your boat in a slip, and start living the good life in Au Gres! This property is a great opportunity for a primary home, vacation home, or investment property. Schedule a showing today!
Key facts
- Metal roof
- Newer furnace
- Hot water heater
Tags
Property features AI
Finance
- HOA & community: Community amenities include a park, playground, and beach area; There is an association fee of $35 paid yearly
Exterior
- Parking: Driveway (street is a paved drive)
- Utilities: Public water; Septic system; Natural gas heat and gas water heater; Electric power (implied)
- Home design: Manufactured single-wide home; One-story structure; Built in 1996
- Construction: Crawl foundation
- Exterior features: Vinyl siding; Deck; Wooded lot; Beach access to Lake Huron/Saginaw Bay; Great Lake frontage (legal water access); Paved street frontage
Interior
- Kitchen: Kitchen on the main level (20 x 8); Dishwasher; Range/Oven; Refrigerator
- Bedrooms: Primary bedroom on the main level (12 x 14) with carpet; Second bedroom on the main level (9 x 11) with carpet; Third bedroom on the main level (approx. 14' width) with carpet
- Flooring: Carpet in bedrooms; Vinyl in living, dining, kitchen, and bathrooms
- Bathrooms: Two full bathrooms; Main-level bathrooms with vinyl flooring
- Heating & cooling: Forced air heating; Wall/window air conditioning; Gas water heater
- Interior features: 9 total rooms; Deck
- Laundry & utility: Washer; Dryer
Neighborhood map
What this means for you Summary
Snapshot
- This is a 3-bed/1.0-bath single-family listed at $115k.
Deal economics
- At list price, monthly cash flow is $97 ($1k/yr) — positive.
- The deal already cash-flows at list — no discount required.
- To meet the 1% rule (rent ≥ 1% of price), the offer needs to be $113k (2.1% below list).
- Recommended offer: $112k (3.0% below list) — sets the bar for market timing.
Location & tenants
- Location reads: area grade C — affects rentability + tenant quality, not the cash-flow math above.
- Au Gres-Sims School District (rural): math 29% / reading 52% proficiency, ranked #376 of 760 in MI (top 50%) — families likely to look elsewhere, expect single-tenant / working-renter base with shorter leases.
- Market conditions: 100 active listings in the ZIP; 30 units permitted in Arenac County in 2024 (0 in 5+ unit buildings).
Forward outlook
- Local home prices are declining (-3.0%/yr); year-one equity from $795 of loan paydown is wiped out by about $3k of value loss. Plan a longer hold.
- Arenac County population projected at -32% by 2050 — secular population decline; favor cash flow + early exit over multi-decade hold.
Negotiation context
- It's been on market 42 days — a 3% lower offer ($112k) is reasonable based on typical stale-listing flexibility.
- 2 sale attempts with the ask held roughly flat each time — persistent listings suggest the price (not the market) is what's stuck; bring a comps-based counter.
- Current owner paid $32k; list at $115k implies a 259% gain — meaningful room to come down on a strong offer.
Questions for the listing agent
- It's been on market 42 days. Have you received any prior offers? Is the seller open to a 3% concession, seller financing, or rate buy-down credit?
- What does the HOA fee cover, when was the last increase, and are there any pending special assessments or reserve-fund shortfalls?
- Is there a deadline driving the sale (1031 exchange, divorce, estate, relocation)? That informs how much negotiation room exists.
- What's the average days-on-market for RENTAL listings here right now (not sales)? A rising rental-DOM trend means longer vacancies and softer asking-rent achievability than the comps imply.
- What's the recent tenant-quality profile in this submarket — average credit score on applications, eviction rate, late-payment / NSF rate, and stable-employment percentage? A property-management company in the area should have these aggregated.
- How much new for-sale + rental construction is in the pipeline within 1–3 miles? Heavy new supply typically softens prices + rents 12–24 months out; constrained supply supports both.
Investment metrics
- 1% rule
- 0.98% ✗
- Cap rate
- 7.31%
- Cash-on-cash
- 3.63%
- DSCR
- 1.16
- GRM
- 8.5
CMA / ARV
- ARV (median comp)
- $181,072
- List price
- $115,000
- Delta
- -36.49%
- Verdict
- UNDERPRICED
- Comps
- 9 within 1.0 mi
Show comp detail 1 sale within ~0.75 mi
| Address | Dist | Beds/Ba | Sqft | Sold | Price | $/sf | Match |
|---|---|---|---|---|---|---|---|
| 4175 W Taral Terrace Dr | 0.29mi | 2/1.0 (-1) | 1,248 (+3%) | 6mo | $185,000 | $148 | 72 |
Match score weights: distance 35% · size 25% · config 20% · recency 20%. Top-matched comps best support the ARV.
Projected returns pro-forma
-3.0% appreciation · 3.0% rent growth · sell at horizon
- IRR
- -10.6%
- Equity multiple
- 0.61×
- Total profit
- $-12,410
- Equity at exit
- $17,147
- IRR
- -1.2%
- Equity multiple
- 0.91×
- Total profit
- $-2,749
- Equity at exit
- $9,943
Cash invested: $32,200 (down + closing). Projections, not guarantees.
Landlord ↔ Tenant lean methodology
- Overall (STATE)
- 62 Landlord-Friendly
- State Michigan
- 62 Landlord-Friendly · EVEN
- County
- — inherits STATE
- City
- — inherits STATE
ZIP-level market 48703
- Home prices YoY
- -34.3%
- Active inventory
- 100
- Price-to-rent
- 8.5×
Monthly cashflow live
- Estimated rent
- $1,126 medium interval (Pro) →
- Mortgage (P&I)
- −$603
- Tax from tax record
- −$138 /mo · $1,653/yr
- Insurance
- −$48
- HOA
- −$3
- Vacancy / Maint / Mgmt
- −$236
- Net cashflow
- $97
Break-even live
UW: 25.0% down · 7.5% · 30yr · 1.5% tax · 5.0% vac · 8.0% maint · 8.0% mgmt
Financing live
Cash to close
- Down payment
- $28,750
- Closing costs
- $3,450
- Reserves months
- —
- Total cash needed
- —
Loan-product check · same deal, 3 products live
Conventional
25% down · 7.5% · 30yr
- Down + closing
- —
- Monthly P&I
- —
- Monthly cashflow
- —
- DSCR
- —
- Eligible?
- —
Personal DTI + credit; lowest rate.
DSCR
20% down · 8.5% · 30yr
- Down + closing
- —
- Monthly P&I
- —
- Monthly cashflow
- —
- DSCR
- —
- Eligible?
- —
No personal income docs; deal must DSCR.
Hard money
10% down · 12.0% · 12mo
- Down + closing
- —
- Monthly P&I
- —
- Monthly cashflow
- —
- DSCR
- —
- Eligible?
- —
Short-term bridge; refi at stabilization.
HOA detail
- Monthly dues
- $3 · $36/yr
- Likely covers
- water
Listing history 19 events
-
2026-06-18days on market $115,000 Active 42 DOM
-
2026-06-17days on market $115,000 Active 41 DOM
-
2026-06-16days on market $115,000 Active 40 DOM
-
2026-06-15days on market $115,000 Active 39 DOM
-
2026-06-13days on market $115,000 Active 37 DOM
-
2026-06-12days on market $115,000 Active 36 DOM
-
2026-06-09days on market $115,000 Active 33 DOM
-
2026-06-08days on market $115,000 Active 32 DOM
-
2026-06-07days on market $115,000 Active 31 DOM
-
2026-06-07days on market $115,000 Active 30 DOM
-
2026-06-04days on market $115,000 Active 27 DOM
-
2026-06-02days on market $115,000 Active 26 DOM
-
2026-06-01days on market $115,000 Active 25 DOM
-
2026-05-31days on market $115,000 Active 24 DOM
-
2026-05-31days on market $115,000 Active 23 DOM
-
2026-05-07$115,000 Active 604-char remark
-
2025-10-16historical
-
2025-10-13$120,000 Active
-
2005-06-09soldstatus $32,000
ⓘ Source: listings_history table (triggers on properties + properties_extension) + one-shot
backfill from property_details.listing_events for pre-trigger history.
Tax reassessment forecast MI · Partial reset (capped growth)
- Current annual tax
- $1,653 · $138/mo
- Projected year-2 tax
- $1,712 · $143/mo
- Expected delta
- +$59/yr (+$5/mo · 3.6%)
ⓘ Screening estimate from a state-policy table — verify with the county assessor before closing.
Climate risk First Street
- Flood 1/10 Low FEMA zone X (unshaded) · 0% chance over 30 yrs
- Wildfire 1/10 Low
- Heat 1/10 Low 7 d/yr ≥93°F today · 13 d/yr by 30 yrs out
- Wind 1/10 Low
- Air quality 2/10 Low 1 unhealthy d/yr today · 1 by 30 yrs out
Nearby sold comps map
Loading sold comps map…
Walkable amenities ~0.75 mi
Loading nearby amenities…
Taxation est. · year 1
- Rental income
- $13,507
- − Mortgage interest
- −$6,442
- − Property taxes
- −$1,653
- − Insurance
- −$575
- − Repairs & maintenance
- −$1,081
- − Management
- −$1,081
- − HOA
- −$36
- − Depreciation
- −$3,345
- Taxable loss
- −$705
- Est. tax savings @ 24.0%
- +$169
- After-tax cash flow
- $1,339/yr
For passive investors: Depreciation is non-cash, so a rental often shows a tax loss while cash-flowing — sheltering income. Rental losses are passive: they offset passive income freely, and up to $25,000/yr can offset ordinary (W-2) income if you actively participate and your MAGI is under $100k (phasing out to $0 by $150k); unused losses carry forward. On sale, claimed depreciation is recaptured at up to 25%, and gains may owe capital-gains tax (a 1031 exchange can defer both). Figures are a year-1 estimate at your 24.0% rate — not tax advice; consult a CPA.
Schools (NCES district)
- District
- Au Gres-Sims School District
- NCES district ID
- 2603600
- Math proficiency
- 29% ▬ 0.00%
- Reading proficiency
- 52% ▲ 18.00%
- Median HH income
- $37,262
- Composite
- 36.05/100
- National rank
- #9513
- State rank
- #376 of 760 in MI
Livability — Sims
No livability data for this city. (Only ~50 U.S. cities are tracked.)
Census & demographics
- Population (ZIP)
- 2,940
Population outlook (Arenac County) Hauer SSP2
- Today (2025)
- 14,036 people
- By 2030
- 13,189 · -6.0%
- By 2040
- 11,309 · -19.4%
- By 2050
- 9,616 · -31.5%
- By 2075
- 6,776 · -51.7%
- By 2100
- 4,997 · -64.4%
Race, ethnicity, and origin ACS 2023
- Neighborhood character
- Predominantly White (95%)
- Race & ethnicity
- White 95% Two or more races 4%
- Common ancestry
- Romanian 11% Lithuanian 8% Slovak 4%
- Foreign-born
- 1% · Canada
- Languages at home
- 98% English-only · German/W. Germanic 1%
Political lean MEDSL · Arenac
- 2024 margin
- Solid R (+40.6) · D 29.1% · R 69.7% · Other 1.3%
- 2008→2024 swing
- -44.9pp toward R · 2008: 4.3pp · 2024: -40.6pp
- All cycles
- 2024: R+40.6 2020: R+35.7 2016: R+33.1 2012: R+4.9 2008: D+4.3
Not yet ingested
- Civics
- —
Market trends
- HPI YoY
- ▼ -81.91%
- Current HPI
- 157.0897
- Rent YoY
- —
- Metro
- —
- State GDP YoY
- ▲ 1.37%
- F500 in state
- 28
Industry mix (Fortune 500 HQ in MI)
| Industry | F500 HQs | Revenue |
|---|---|---|
| Automotive Parts | 3 | $48B |
|
||
| Automotive | 2 | $372B |
|
||
| Chemicals | 1 | $45B |
|
||
| Automotive Retail | 1 | $29B |
|
||
| Healthcare / Medical Devices | 1 | $23B |
|
||
| Automotive Technology | 1 | $20B |
|
||
Price history
+259.4% since first listed4 events — show timeline
- 2026-05-07 Listed $115,000 MiRealSource-MiMLS
- 2025-10-16 Listing Removed — MiRealSource-MiMLS
- 2025-10-13 Listed $120,000 MiRealSource-MiMLS
- 2005-06-09 Sold (Public Records) $32,000 Public Records
Property tax history
+7.4%/yrLatest (2025): $1,653 · +0.1% YoY. Source: county tax records.
Cash-flow waterfall
monthlySold comps — $/sqft
last 12 mo · ≤1 miLoading sold comps…