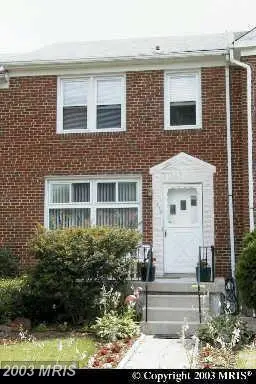
1713 Stella Ct · Woodlawn, MD
Flood risk No data
- FEMA flood zone
- —
- Chance of flooding over 30 yrs
- —
- Est. flood insurance / yr
- —
Fire risk No data
- Est. fire insurance / yr
- —
Heat risk No data
- Hot days now (above threshold)
- —
- Hot days in 30 yrs
- —
Wind risk No data
- Chance of severe wind over 30 yrs
- —
Air-quality risk No data
- Unhealthy air days now
- —
- Unhealthy air days in 30 yrs
- —
Risk factors via First Street. Map © Google.
Why this score? — see what drove the D grade
The composite is a weighted blend of 9 inputs, each scored 0–100. Each bar is that input's sub-score; the figure is the points it added to the 100-point composite (weight × sub-score).
- Appreciation +9.8/10.0
- Cash flow +7.7/30.0
- ARV discount +7.4/15.0
- Livability +3.9/5.0
- Rent growth +3.8/5.0
- Condition / age +2.5/5.0
- 1% rule +2.3/10.0
- Schools +2.3/10.0
- DSCR +1.8/10.0
$275,000
🖨 Deal sheet 📄 Offer letter ✓ Due diligence
Listing remarks
Welcome to 1713 Stella Court in Gwynn Oak, a spacious townhome offering a functional layout and comfortable living spaces across three finished levels. The upper level features 2 generously sized bedrooms and 2 full bathrooms, providing privacy and convenience for everyday living. The main level includes a convenient half bath along with inviting living and dining spaces perfect for relaxing or entertaining. The finished lower level adds valuable flexibility with an additional bedroom and full bathroom, ideal for guests, a home office, or extended living space. Conveniently located near shopping, dining, parks, and major commuter routes including I-695 and I-70, this home offers easy access
Key facts
- Built 1955
- Listed 21 days
Property features AI
Finance
- Financial info: List price $275,000
Exterior
- Home design: Townhouse; Built in 1955
- Construction: Lot size about 1,926 sq ft
Interior
- Bedrooms: 3 bedrooms
- Bathrooms: 3.5 bathrooms
- Interior features: Has view
Neighborhood map
What this means for you Summary
Snapshot
- This is a 3-bed/3.5-bath townhouse listed at $275k.
Deal economics
- At list price, monthly cash flow is $-321 ($-4k/yr) — negative.
- To cash-flow at today's rent, offer at most $229k (16.9% below list).
- To meet the 1% rule (rent ≥ 1% of price), the offer needs to be $200k (27.3% below list).
- Recommended offer: $200k (27.3% below list) — sets the bar for 1% rule.
Location & tenants
- Location reads 77/100 on livability (#78 in MD, #2,926 nationally) — a middle-class / working-renter tenant base. Strengths: commute A+, housing A+, employment A-; Watch: amenities D+, crime F.
- Baltimore County Public Schools (suburban): math 15% / reading 34% proficiency, ranked #11 of 24 in MD (top 46%) — low school quality limits family demand, transient renter base, plan for 1-2y turnover.
- Market conditions: Rents rising fast (+5.2%/yr); 126 active listings in the ZIP; 16 comparable units currently listed for rent nearby; rentals leasing fast (median 11d on market — plan ~1-2 weeks tenant-placement turnaround); 1,511 units permitted in Baltimore County in 2024 (643 in 5+ unit buildings).
- This rent runs 36% of the median local income ($67k/yr) — at the standard rent-burdened threshold; future hikes will face affordability resistance.
Forward outlook
- In year one you build about $28k of equity ($2k loan paydown + $26k appreciation (9.5% local appreciation)).
- Baltimore County population projected at +12% by 2050 — modest demand growth; plan on rents tracking national, not racing it.
- By year 2, paydown + projected appreciation supports a ~$45k cash-out refi (75% LTV) — recoverable capital for the next deal without selling this one.
Negotiation context
- It's been on market 21 days — a 2% lower offer ($271k) is reasonable based on typical stale-listing flexibility.
Risks & watch-outs
- Watch-outs: built in 1955 — expect roof / HVAC / electrical / plumbing capex.
Questions for the listing agent
- What do current leases actually rent for vs. the listed asking? Can we see a recent rent roll and the last 12 months of T-12 income?
- Built in 1955 — when were the roof, HVAC, electrical panel, plumbing, and water heater last replaced?
- Is there a deadline driving the sale (1031 exchange, divorce, estate, relocation)? That informs how much negotiation room exists.
- Schools are B-rated — typically a magnet for longer-tenancy family renters. What's the average tenant stay here, and is there a school-zone premium baked into asking?
- Crime grade is F in this area — have there been break-ins, vandalism, or insurance claims at this property in the last 3 years? What carrier currently insures it and at what premium?
- The area grade is low — what's the realistic commute time and amenity access for the typical tenant pool here? Any planned neighborhood developments (good or bad) we should know about?
- What's the average days-on-market for RENTAL listings here right now (not sales)? A rising rental-DOM trend means longer vacancies and softer asking-rent achievability than the comps imply.
- What's the recent tenant-quality profile in this submarket — average credit score on applications, eviction rate, late-payment / NSF rate, and stable-employment percentage? A property-management company in the area should have these aggregated.
- How much new for-sale + rental construction is in the pipeline within 1–3 miles? Heavy new supply typically softens prices + rents 12–24 months out; constrained supply supports both.
Investment metrics
- 1% rule
- 0.73% ✗
- Cap rate
- 4.89%
- Cash-on-cash
- -5.00%
- DSCR
- 0.78
- GRM
- 11.5
CMA / ARV
- ARV (on-the-fly)
- $274,160
- Comps found
- 12
Show comp detail 12 sales within ~0.75 mi
| Address | Dist | Beds/Ba | Sqft | Sold | Price | $/sf | Match |
|---|---|---|---|---|---|---|---|
| 1719 Stella Ct | 0.01mi | 3/2.0 | 1,590 (+7%) | 2mo | $300,000 | $189 | 80 |
| 1230 Stamford Rd | 0.18mi | 4/2.0 (+1) | 1,520 (+2%) | 5mo | $319,000 | $210 | 73 |
| 1531 Clairidge Rd | 0.32mi | 3/2.0 | 1,440 (-3%) | 3mo | $320,000 | $222 | 71 |
| 1664 Kirkwood Rd | 0.13mi | 3/2.0 | 1,672 (+12%) | 2mo | $325,000 | $194 | 66 |
| 1523 Clairidge Rd | 0.33mi | 3/1.5 | 1,440 (-3%) | 8mo | $208,000 | $144 | 64 |
| 1420 Clairidge Rd | 0.52mi | 3/1.5 | 1,440 (-3%) | 2mo | $314,000 | $218 | 61 |
| 970 St Agnes Ln | 0.53mi | 3/2.0 | 1,530 (+3%) | 5mo | $275,000 | $180 | 61 |
| 5413 Channing Rd | 0.58mi | 3/1.0 | 1,459 (-2%) | 3mo | $239,000 | $164 | 57 |
| 1224 Harwall Rd | 0.42mi | 3/2.0 | 1,602 (+8%) | 9mo | $295,000 | $184 | 54 |
| 1529 Clairidge Rd | 0.32mi | 3/2.0 | 1,692 (+14%) | 5mo | $298,000 | $176 | 53 |
| 5408 Addington Rd | 0.65mi | 3/1.5 | 1,600 (+7%) | 8mo | $223,333 | $140 | 42 |
| 1020 Wedgewood Rd | 0.47mi | 3/1.0 | 1,274 (-14%) | 9mo | $145,000 | $114 | 36 |
Match score weights: distance 35% · size 25% · config 20% · recency 20%. Top-matched comps best support the ARV.
Projected returns pro-forma
9.5% appreciation · 5.23% rent growth · sell at horizon
- IRR
- 20.3%
- Equity multiple
- 2.62×
- Total profit
- $124,590
- Equity at exit
- $237,767
- IRR
- 19.1%
- Equity multiple
- 6.08×
- Total profit
- $390,957
- Equity at exit
- $502,498
Cash invested: $77,000 (down + closing). Projections, not guarantees.
Landlord ↔ Tenant lean methodology
- Overall (STATE)
- 27 Tenant-Leaning
- State Maryland
- 27 Tenant-Leaning · D+14
- County
- — inherits STATE
- City
- — inherits STATE
ZIP-level market 21207
- Home prices YoY
- 1.1%
- Rents YoY
- 5.2%
- Active inventory
- 126
- Price-to-rent
- 11.5×
Monthly cashflow live
- Estimated rent
- $2,000 high interval (Pro) →
- Mortgage (P&I)
- −$1,442
- Tax est. 1.5%
- −$344 /mo · $4,125/yr
- Insurance
- −$115
- HOA
- −$0
- Vacancy / Maint / Mgmt
- −$420
- Net cashflow
- $-321
Break-even live
UW: 25.0% down · 7.5% · 30yr · 1.5% tax · 5.0% vac · 8.0% maint · 8.0% mgmt
Financing live
Cash to close
- Down payment
- $68,750
- Closing costs
- $8,250
- Reserves months
- —
- Total cash needed
- —
Loan-product check · same deal, 3 products live
Conventional
25% down · 7.5% · 30yr
- Down + closing
- —
- Monthly P&I
- —
- Monthly cashflow
- —
- DSCR
- —
- Eligible?
- —
Personal DTI + credit; lowest rate.
DSCR
20% down · 8.5% · 30yr
- Down + closing
- —
- Monthly P&I
- —
- Monthly cashflow
- —
- DSCR
- —
- Eligible?
- —
No personal income docs; deal must DSCR.
Hard money
10% down · 12.0% · 12mo
- Down + closing
- —
- Monthly P&I
- —
- Monthly cashflow
- —
- DSCR
- —
- Eligible?
- —
Short-term bridge; refi at stabilization.
Rent comps 16 comps
| Address | Beds | Baths | Sqft | Rent | $/sqft | DOM | Units | Dist |
|---|---|---|---|---|---|---|---|---|
| 1530 Kirkwood Rd Gwynn Oak, MD | 3.0 | 1.5 | 1424 | $2,100 | $1.47 | 10d | 1 | 0.30mi |
| 930 Masefield Rd Unit 1 Woodlawn, MD | 3.0 | 1.5 | 1080 | $2,650 | $2.45 | 2d | 1 | 0.55mi |
| 945 Saint Agnes Ln Gwynn Oak, MD | 4.0 | 2.0 | 1500 | $1,985 | $1.32 | 17d | 1 | 0.60mi |
| 5215 Muth Ave Gwynn Oak, MD | 3.0 | 3.0 | 1205 | $2,700 | $2.24 | 14d | 1 | 0.77mi |
| 5136 Oaklawn Rd Gwynn Oak, MD | 1.0–3.0 | 1.0 | 896 | $1,710 | $1.91 | 1d | 22 | 0.83mi |
| 603 Braeside Rd Baltimore, MD | 3.0 | 2.0 | 1416 | $2,400 | $1.69 | 43d | 1 | 0.92mi |
| 2 Walden Birch Ct Woodlawn, MD | 3.0 | 1.5 | 1022 | $1,792 | $1.75 | 4d | 1 | 0.97mi |
| 1 Janper Ct Baltimore, MD | 2.0 | 1.5 | 950 | $1,500 | $1.58 | 3d | 1 | 1.01mi |
| 408 Shade Tree Pl Catonsville, MD | 1.0–2.0 | 1.0–2.0 | 805 | $1,812 | $2.25 | 4d | 1 | 1.03mi |
| 5006 Windsor Mill Rd Baltimore, MD | 1.0–3.0 | 1.0–2.0 | 776 | $1,899 | $2.45 | 2d | 18 | 1.04mi |
| 5364 Jamestowne Ct Baltimore, MD | 3.0 | 1.0–1.5 | 787 | $1,905 | $2.42 | 4d | 13 | 1.38mi |
| 311 Harlem Ln Catonsville, MD | 3.0 | 2.0 | 1152 | $2,300 | $2.00 | 4d | 1 | 1.40mi |
| 131 N Bend Rd Unit 131-1B Baltimore, MD | 2.0 | 1.5 | 910 | $1,225 | $1.35 | 21d | 1 | 1.43mi |
| 220 Stonecroft Rd Unit 232-I Baltimore, MD | 2.0 | 1.5 | 900 | $1,295 | $1.44 | 17d | 1 | 1.46mi |
| 220 Stonecroft Rd Unit 230-D Baltimore, MD | 2.0 | 1.5 | 900 | $1,395 | $1.55 | 21d | 1 | 1.46mi |
| 4520 Scarlet Oak Ln Baltimore, MD | 2.0 | 1.0 | 1025 | $1,500 | $1.46 | 43d | 1 | 1.47mi |
Listing history 13 events
-
2026-06-18days on market $275,000 Coming Soon 21 DOM
-
2026-06-17days on market $275,000 Coming Soon 20 DOM
-
2026-06-16days on market $275,000 Coming Soon 19 DOM
-
2026-06-15days on market $275,000 Coming Soon 18 DOM
-
2026-06-13days on market $275,000 Coming Soon 16 DOM
-
2026-06-09days on market $275,000 Coming Soon 12 DOM
-
2026-06-08days on market $275,000 Coming Soon 11 DOM
-
2026-06-07days on market $275,000 Coming Soon 10 DOM
-
2026-06-04days on market $275,000 Coming Soon 7 DOM
-
2026-06-03days on market $275,000 Coming Soon 6 DOM
-
2026-06-02days on market $275,000 Coming Soon 5 DOM
-
2026-06-01days on market $275,000 Coming Soon 4 DOM
-
2026-05-31days on market $275,000 Coming Soon 3 DOM
ⓘ Source: listings_history table (triggers on properties + properties_extension) + one-shot
backfill from property_details.listing_events for pre-trigger history.
Nearby sold comps map
Loading sold comps map…
Walkable amenities ~0.75 mi
Loading nearby amenities…
Taxation est. · year 1
- Rental income
- $23,997
- − Mortgage interest
- −$15,404
- − Property taxes
- −$4,125
- − Insurance
- −$1,375
- − Repairs & maintenance
- −$1,920
- − Management
- −$1,920
- − Depreciation
- −$8,000
- Taxable loss
- −$8,747
- Est. tax savings @ 24.0%
- +$2,099
- After-tax cash flow
- $-1,749/yr
For passive investors: Depreciation is non-cash, so a rental often shows a tax loss while cash-flowing — sheltering income. Rental losses are passive: they offset passive income freely, and up to $25,000/yr can offset ordinary (W-2) income if you actively participate and your MAGI is under $100k (phasing out to $0 by $150k); unused losses carry forward. On sale, claimed depreciation is recaptured at up to 25%, and gains may owe capital-gains tax (a 1031 exchange can defer both). Figures are a year-1 estimate at your 24.0% rate — not tax advice; consult a CPA.
Schools (NCES district)
- District
- Baltimore County Public Schools
- NCES district ID
- 2400120
- Math proficiency
- 15% ▼ -16.00%
- Reading proficiency
- 34% ▼ -5.00%
- Median HH income
- $66,746
- Composite
- 23.17/100
- National rank
- #7948
- State rank
- #11 of 24 in MD
Livability — Woodlawn
- Score
- 77/100
- State rank
- #78
- US rank
- #2926
Category grades
Schools grade is shown separately in the Schools card above.
Census & demographics
- Census place
- Woodlawn, MD
- County
- Baltimore County · 769,527 people
- City population
- 49,599
- Metro
- Baltimore-Columbia-Towson, MD
- Population (ZIP)
- 47,099
- Household income
- $67,060
- Rent vs Own
- Severe rent burden
- 2139.0
Population outlook (Baltimore County) Hauer SSP2
- Today (2025)
- 885,518 people
- By 2030
- 909,272 · +2.7%
- By 2040
- 951,547 · +7.5%
- By 2050
- 990,955 · +11.9%
- By 2075
- 1,086,411 · +22.7%
- By 2100
- 1,135,078 · +28.2%
Race, ethnicity, and origin ACS 2023
- Neighborhood character
- Predominantly Black (78%)
- Race & ethnicity
- Black 78% White 8% Hispanic / Latino 7% Two or more races 5% Asian 3%
- Hispanic origin (detail)
- Puerto Rican 1%
- Common ancestry
- Swedish 1%
- Foreign-born
- 13% · Canada, Philippines, South Korea
- Languages at home
- 86% English-only · Spanish 4% French/Haitian/Cajun 1% Other Asian/Pacific 1%
Political lean MEDSL · Baltimore
- 2024 margin
- Strong D (+24.5) · D 61.0% · R 36.5% · Other 2.5%
- 2008→2024 swing
- +9.9pp toward D · 2008: 14.6pp · 2024: 24.5pp
- All cycles
- 2024: D+24.5 2020: D+27.0 2016: D+17.4 2012: D+16.4 2008: D+14.6
Not yet ingested
- Civics
- —
Market trends
- HPI YoY
- ▲ 9.50%
- Current HPI
- 843.63
- Rent YoY
- ▲ 5.23%
- Metro
- Baltimore-Columbia-Towson, MD
- State GDP YoY
- ▲ 2.97%
- F500 in state
- 12
Industry mix (Fortune 500 HQ in MD)
| Industry | F500 HQs | Revenue |
|---|---|---|
| Aerospace / Defense | 1 | $71B |
|
||
| Utilities | 1 | $25B |
|
||
| Hotels | 1 | $24B |
|
||
| Consumer Goods | 1 | $7B |
|
||
| Real Estate | 1 | $6B |
|
||
| Chemicals | 1 | $2B |
|
||
Cash-flow waterfall
monthlySold comps — $/sqft
last 12 mo · ≤1 miLoading sold comps…