 Duplex
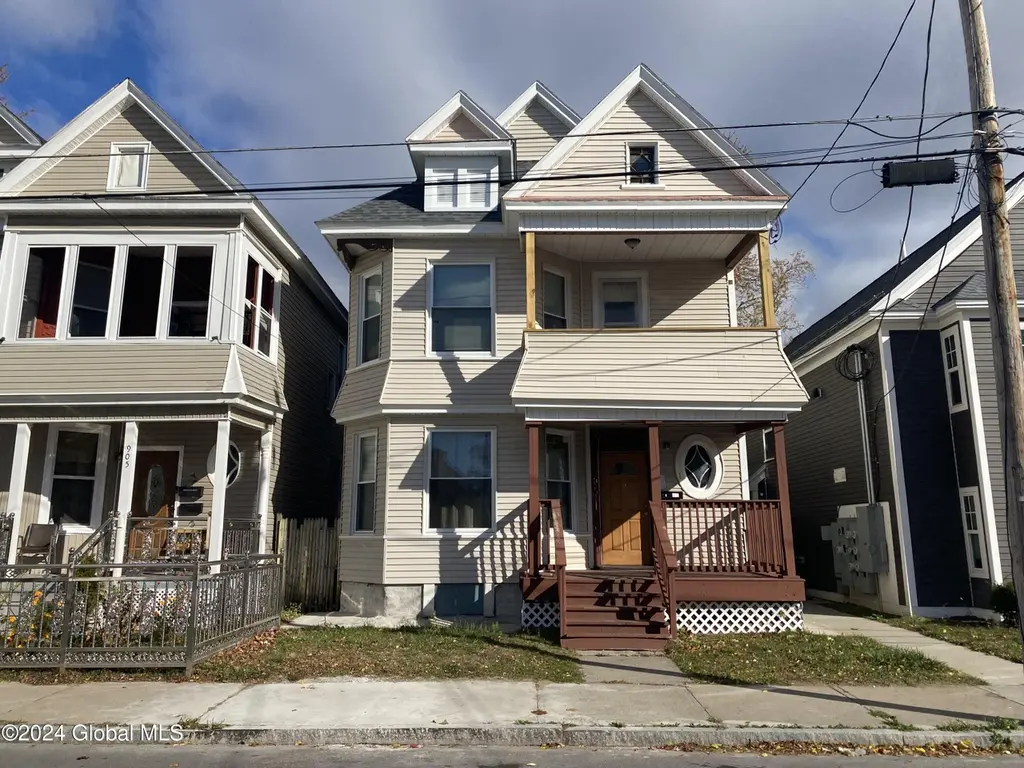
907 Delamont Ave · Schenectady, NY
Flood risk 1/10 · Minimal
- FEMA flood zone
- X (unshaded)
- Chance of flooding over 30 yrs
- 0.0%
- Est. flood insurance / yr
- $473 – $860
Fire risk 1/10 · Minimal
- Est. fire insurance / yr
- $691 – $1,283
Heat risk 4/10 · Minor
- Hot days now (above 96°F)
- 7 days/yr
- Hot days in 30 yrs
- 16 days/yr
Wind risk 2/10 · Minimal
- Chance of severe wind over 30 yrs
- 4.0%
Air-quality risk 1/10 · Minimal
- Unhealthy air days now
- 0 days/yr
- Unhealthy air days in 30 yrs
- 0 days/yr
Risk factors via First Street. Map © Google.
Why this score? — see what drove the B- grade
The composite is a weighted blend of 9 inputs, each scored 0–100. Each bar is that input's sub-score; the figure is the points it added to the 100-point composite (weight × sub-score).
- Cash flow +18.2/30.0
- ARV discount +15.0/15.0
- Appreciation +10.0/10.0
- DSCR +5.7/10.0
- 1% rule +5.0/10.0
- Livability +3.9/5.0
- Schools +3.0/10.0
- Rent growth +2.5/5.0
- Condition / age +2.5/5.0
$309,900
🖨 Deal sheet 📄 Offer letter ✓ Due diligence
Multi-family units
County records classify this as Multi-Family (2-4 Unit). Listing-text estimate: 2 units. confirmed
Listing remarks MLS
FIRST FLOOR NOW VACANT AND READY FOR YOU TO MOVE RIGHT IN! Excellent Opportunity to own a Large, 2 Family House in the thriving City of Schenectady. Great for Owner Occupied or Investment. Many new updates throughout. 3 Bedrooms over 3 Bedrooms. Close to State Street, Downtown, Restaurants, Shopping, Bus Line and more. Don't miss out on this one!
Key facts
- Close to restaurants
- Large 2 family house
- Close to shopping
Tags
Neighborhood map
What this means for you Summary
Snapshot
- This is a 2 × 3-bed/1.0-bath units multifamily listed at $310k.
Deal economics
- At list price, monthly cash flow is $281 ($3k/yr) — positive. Per door: $140/mo.
- The deal already cash-flows at list — no discount required.
- To meet the 1% rule (rent ≥ 1% of price), the offer needs to be $310k (0.1% below list).
- Recommended offer: $291k (6.0% below list) — sets the bar for market timing.
Location & tenants
- Location reads 78/100 on livability (#167 in NY, #2,597 nationally) — a middle-class / working-renter tenant base. Strengths: commute A+, health & safety A+, cost of living A; Watch: schools C-, employment D+, crime F.
- Schenectady City School District (urban): math 38% / reading 34% proficiency, ranked #556 of 590 in NY (top 94%) — families likely to look elsewhere, expect single-tenant / working-renter base with shorter leases; 65% free/reduced lunch — lower-income household profile, screen leases tightly.
- Market conditions: 33 active listings in the ZIP; 154 units permitted in Schenectady County in 2024 (54 in 5+ unit buildings).
Forward outlook
- In year one you build about $33k of equity ($2k loan paydown + $31k appreciation (10.0% local appreciation)).
- Schenectady County population projected to shrink 4% by 2050 — rents likely to lag national; underwrite the cash flow, not the appreciation.
- At projected returns (10.0% appreciation + 3.0% rent growth), your $87k cash investment doubles in ~3 years — after that, you're playing with house money.
- By year 2, paydown + projected appreciation supports a ~$53k cash-out refi (75% LTV) — recoverable capital for the next deal without selling this one.
Negotiation context
- It's been on market 86 days — a 6% lower offer ($291k) is reasonable based on typical stale-listing flexibility.
- 6 sale attempts since 22y ago with the ask held roughly flat each time — persistent listings suggest the price (not the market) is what's stuck; bring a comps-based counter.
- Current owner paid $180k; list at $310k implies a 72% gain — meaningful room to come down on a strong offer.
Risks & watch-outs
- Watch-outs: built in 1900 — expect roof / HVAC / electrical / plumbing capex.
Questions for the listing agent
- It's been on market 86 days. Have you received any prior offers? Is the seller open to a 6% concession, seller financing, or rate buy-down credit?
- Can we see the unit-by-unit rent roll, current vacancy, and any below-market leases? What's the average tenancy length?
- What capital expenditures (roof, boiler, parking lot, exteriors) have been made in the last 5 years, and what's planned in the next 2?
- Built in 1900 — when were the roof, HVAC, electrical panel, plumbing, and water heater last replaced?
- Why hasn't it sold? Are there any deal-killer items the seller is aware of (foundation, flood, title, zoning, code violations)?
- Is there a deadline driving the sale (1031 exchange, divorce, estate, relocation)? That informs how much negotiation room exists.
- Crime grade is F in this area — have there been break-ins, vandalism, or insurance claims at this property in the last 3 years? What carrier currently insures it and at what premium?
- What's the average days-on-market for RENTAL listings here right now (not sales)? A rising rental-DOM trend means longer vacancies and softer asking-rent achievability than the comps imply.
- What's the recent tenant-quality profile in this submarket — average credit score on applications, eviction rate, late-payment / NSF rate, and stable-employment percentage? A property-management company in the area should have these aggregated.
- How much new apartment / multifamily construction is in the pipeline within 1–3 miles? Heavy new supply (>2% of stock underway) typically softens rents 12–24 months out; light construction supports rent growth.
Investment metrics
- 1% rule
- 1.00% ✗
- Cap rate
- 7.38%
- Cash-on-cash
- 3.88%
- DSCR
- 1.17
- GRM
- 8.3
CMA / ARV
- ARV (median comp)
- $384,529
- List price
- $309,900
- Delta
- -19.41%
- Verdict
- UNDERPRICED
- Comps
- 20 within 1.0 mi
Show comp detail 12 sales within ~0.75 mi
| Address | Dist | Beds/Ba | Sqft | Sold | Price | $/sf | Match |
|---|---|---|---|---|---|---|---|
| 1013 Delamont Ave | 0.13mi | 6/2.0 | 2,576 (+5%) | 1mo | $111,500 | $43 | 85 |
| 510 Mumford St | 0.28mi | 6/2.0 | 2,544 (+3%) | 2mo | $15,000 | $6 | 80 |
| 1 Chestnut St | 0.30mi | 6/3.0 | 2,406 (-2%) | 2mo | $290,000 | $121 | 77 |
| 421 Summit Ave | 0.27mi | 6/2.0 | 2,600 (+6%) | 2mo | $308,000 | $118 | 76 |
| 222 Duane Ave | 0.22mi | 6/2.0 | 2,700 (+10%) | 1mo | $329,900 | $122 | 73 |
| 25 Steuben St | 0.22mi | 6/3.0 | 2,640 (+7%) | 1mo | $265,000 | $100 | 72 |
| 16 Hawk St | 0.45mi | 6/2.0 | 2,584 (+5%) | 0mo | $370,000 | $143 | 70 |
| 5 Hawk St | 0.45mi | 6/2.0 | 2,294 (-7%) | 1mo | $325,000 | $142 | 67 |
| 21 Hawk St | 0.49mi | 6/2.0 | 2,294 (-7%) | 0mo | $334,750 | $146 | 66 |
| 316 Georgetta Dix Plz | 0.32mi | 6/4.0 | 2,664 (+8%) | 4mo | $262,500 | $99 | 60 |
| 762 Eastern Ave | 0.70mi | 6/2.0 | 2,205 (-10%) | 3mo | $269,900 | $122 | 48 |
| 318 Georgetta Dix Plz | 0.32mi | 7/4.0 (+1) | 2,806 (+14%) | 4mo | $200,000 | $71 | 45 |
Match score weights: distance 35% · size 25% · config 20% · recency 20%. Top-matched comps best support the ARV.
Projected returns pro-forma
10.0% appreciation · 3.0% rent growth · sell at horizon
- IRR
- 27.1%
- Equity multiple
- 3.15×
- Total profit
- $186,724
- Equity at exit
- $279,182
- IRR
- 23.7%
- Equity multiple
- 7.18×
- Total profit
- $535,930
- Equity at exit
- $602,068
Cash invested: $86,772 (down + closing). Projections, not guarantees.
Landlord ↔ Tenant lean methodology
- Overall (STATE)
- 15 Strongly Tenant-Friendly
- State New York
- 15 Strongly Tenant-Friendly · D+10
- County
- — inherits STATE
- City
- — inherits STATE
ZIP-level market 12307
- Home prices YoY
- 3.3%
- Active inventory
- 33
- Price-to-rent
- 16.7×
Monthly cashflow live
- Estimated rent
- $3,097 high interval (Pro) →
- Mortgage (P&I)
- −$1,625
- Tax from tax record
- −$412 /mo · $4,939/yr
- Insurance
- −$129
- HOA
- −$0
- Vacancy / Maint / Mgmt
- −$650
- Net cashflow
- $281
Break-even live
2-unit breakdown (identical units grouped — click to expand)
| Units | Beds | Baths | Est. rent |
|---|---|---|---|
| 2× units | 3 | 1 | $3,098 |
| #1 | 3 | 1 | $1,549 |
| #2 | 3 | 1 | $1,549 |
| Total (2 units) | $3,097 | ||
UW: 25.0% down · 7.5% · 30yr · 1.5% tax · 5.0% vac · 8.0% maint · 8.0% mgmt
Financing live
Cash to close
- Down payment
- $77,475
- Closing costs
- $9,297
- Reserves months
- —
- Total cash needed
- —
Loan-product check · same deal, 3 products live
Conventional
25% down · 7.5% · 30yr
- Down + closing
- —
- Monthly P&I
- —
- Monthly cashflow
- —
- DSCR
- —
- Eligible?
- —
Personal DTI + credit; lowest rate.
DSCR
20% down · 8.5% · 30yr
- Down + closing
- —
- Monthly P&I
- —
- Monthly cashflow
- —
- DSCR
- —
- Eligible?
- —
No personal income docs; deal must DSCR.
Hard money
10% down · 12.0% · 12mo
- Down + closing
- —
- Monthly P&I
- —
- Monthly cashflow
- —
- DSCR
- —
- Eligible?
- —
Short-term bridge; refi at stabilization.
Listing history 33 events
-
2026-06-18days on market $309,900 Active 86 DOM
-
2026-06-17days on market $309,900 Active 85 DOM
-
2026-06-16days on market $309,900 Active 84 DOM
-
2026-06-15days on market $309,900 Active 83 DOM
-
2026-06-14days on market $309,900 Active 81 DOM
-
2026-06-13days on market $309,900 Active 80 DOM
-
2026-06-10days on market $309,900 Active 78 DOM
-
2026-06-09days on market $309,900 Active 77 DOM
-
2026-06-08days on market $309,900 Active 76 DOM
-
2026-06-07days on market $309,900 Active 75 DOM
-
2026-06-03days on market $309,900 Active 71 DOM
-
2026-06-02days on market $309,900 Active 70 DOM
-
2026-06-01days on market $309,900 Active 69 DOM
-
2026-05-31days on market $309,900 Active 68 DOM
-
2026-05-31days on market $309,900 Active 67 DOM
-
2026-05-07price $309,900 354-char remark
Show marketing remark (354 chars)
FIRST FLOOR NOW VACANT AND READY FOR YOU TO MOVE RIGHT IN! Excellent Opportunity to own a Large, 2 Family House in the thriving City of Schenectady. Great for Owner Occupied or Investment. Many new updates throughout. 3 Bedrooms over 3 Bedrooms. Close to State Street, Downtown, Restaurants, Shopping, Bus Line and more. Don't miss out on this one!
-
2026-04-20price $314,900 354-char remark
Show marketing remark (354 chars)
FIRST FLOOR NOW VACANT AND READY FOR YOU TO MOVE RIGHT IN! Excellent Opportunity to own a Large, 2 Family House in the thriving City of Schenectady. Great for Owner Occupied or Investment. Many new updates throughout. 3 Bedrooms over 3 Bedrooms. Close to State Street, Downtown, Restaurants, Shopping, Bus Line and more. Don't miss out on this one!
-
2026-03-24$319,900 Active 354-char remark
Show marketing remark (354 chars)
FIRST FLOOR NOW VACANT AND READY FOR YOU TO MOVE RIGHT IN! Excellent Opportunity to own a Large, 2 Family House in the thriving City of Schenectady. Great for Owner Occupied or Investment. Many new updates throughout. 3 Bedrooms over 3 Bedrooms. Close to State Street, Downtown, Restaurants, Shopping, Bus Line and more. Don't miss out on this one!
-
2024-08-15soldstatus $180,000
-
2021-01-26soldstatus $92,500
-
2016-09-01historical
-
2016-08-04status Extended
-
2016-08-01historical
-
2016-06-01$72,900 New
-
2016-06-01historical
-
2015-11-25$72,900 Active
-
2010-10-11historical
-
2009-11-10$97,900
-
2005-03-11soldstatus $34,900
-
2005-03-02soldstatus $34,900
-
2005-01-17historical
-
2004-12-28$34,900
-
1999-03-05soldstatus $57,900
ⓘ Source: listings_history table (triggers on properties + properties_extension) + one-shot
backfill from property_details.listing_events for pre-trigger history.
Tax reassessment forecast NY · Partial reset (capped growth)
- Current annual tax
- $4,939 · $412/mo
- Projected year-2 tax
- $5,088 · $424/mo
- Expected delta
- +$149/yr (+$12/mo · 3.0%)
ⓘ Screening estimate from a state-policy table — verify with the county assessor before closing.
Climate risk First Street
- Flood 1/10 Low FEMA zone X (unshaded) · 0% chance over 30 yrs
- Wildfire 1/10 Low
- Heat 4/10 Moderate 7 d/yr ≥96°F today · 16 d/yr by 30 yrs out
- Wind 2/10 Low 4% chance of damaging wind over 30 yrs
- Air quality 1/10 Low 0 unhealthy d/yr today · 0 by 30 yrs out
Nearby sold comps map
Loading sold comps map…
Walkable amenities ~0.75 mi
Loading nearby amenities…
Taxation est. · year 1
- Rental income
- $37,164
- − Mortgage interest
- −$17,359
- − Property taxes
- −$4,939
- − Insurance
- −$1,550
- − Repairs & maintenance
- −$2,973
- − Management
- −$2,973
- − Depreciation
- −$9,015
- Taxable loss
- −$1,645
- Est. tax savings @ 24.0%
- +$395
- After-tax cash flow
- $3,764/yr
For passive investors: Depreciation is non-cash, so a rental often shows a tax loss while cash-flowing — sheltering income. Rental losses are passive: they offset passive income freely, and up to $25,000/yr can offset ordinary (W-2) income if you actively participate and your MAGI is under $100k (phasing out to $0 by $150k); unused losses carry forward. On sale, claimed depreciation is recaptured at up to 25%, and gains may owe capital-gains tax (a 1031 exchange can defer both). Figures are a year-1 estimate at your 24.0% rate — not tax advice; consult a CPA.
Schools (NCES district)
- District
- Schenectady City School District
- NCES district ID
- 3626010
- Math proficiency
- 38% ▲ 12.00%
- Reading proficiency
- 34% ▲ 2.00%
- Median HH income
- $39,453
- Composite
- 30.2/100
- National rank
- #6309
- State rank
- #556 of 590 in NY
Livability — Schenectady
- Score
- 78/100
- State rank
- #167
- US rank
- #2597
Category grades
Schools grade is shown separately in the Schools card above.
Census & demographics
- Census place
- Schenectady, NY
- City population
- 141,369
- Population (ZIP)
- 7,977
Population outlook (Schenectady County) Hauer SSP2
- Today (2025)
- 155,046 people
- By 2030
- 154,322 · -0.5%
- By 2040
- 151,796 · -2.1%
- By 2050
- 148,621 · -4.1%
- By 2075
- 141,229 · -8.9%
- By 2100
- 126,014 · -18.7%
Race, ethnicity, and origin ACS 2023
- Neighborhood character
- Highly diverse neighborhood (Simpson 0.81)
- Race & ethnicity
- Black 28% Hispanic / Latino 25% White 19% Two or more races 16% Asian 11% Native American 3%
- Hispanic origin (detail)
- Mexican 5% Puerto Rican 14% Dominican 3%
- Common ancestry
- Lithuanian 3% Ukrainian 3% Romanian 1%
- Foreign-born
- 32% · Canada, Jamaica, South Korea
- Languages at home
- 79% English-only · Spanish 12% Arabic 2% Other Asian/Pacific 1%
Political lean MEDSL · Schenectady
- 2024 margin
- D (+10.8) · D 55.4% · R 44.6%
- 2008→2024 swing
- -1.8pp toward R · 2008: 12.7pp · 2024: 10.8pp
- All cycles
- 2024: D+10.8 2020: D+15.7 2016: D+5.8 2012: D+15.4 2008: D+12.7
Not yet ingested
- Civics
- —
Market trends
- HPI YoY
- ▲ 12.60%
- Current HPI
- 398.0252
- Rent YoY
- —
- Metro
- —
- State GDP YoY
- ▲ 2.60%
- F500 in state
- 92
Industry mix (Fortune 500 HQ in NY)
| Industry | F500 HQs | Revenue |
|---|---|---|
| Financial Services | 10 | $950B |
|
||
| Consumer Goods | 9 | $162B |
|
||
| Insurance | 4 | $225B |
|
||
| Telecommunications | 2 | $144B |
|
||
| Pharmaceuticals | 2 | $112B |
|
||
| Media / Entertainment | 2 | $69B |
|
||
Price history
+435.2% since first listed18 events — show timeline
- 2026-05-07 Price Changed $309,900 Global MLS
- 2026-04-20 Price Changed $314,900 Global MLS
- 2026-03-24 Listed $319,900 Global MLS
- 2024-08-15 Sold (Public Records) $180,000 Public Records
- 2021-01-26 Sold (Public Records) $92,500 Public Records
- 2016-09-01 Listing Removed — Global MLS
- 2016-08-04 Relisted — Global MLS
- 2016-08-01 Listing Removed — Global MLS
- 2016-06-01 Listed $72,900 Global MLS
- 2016-06-01 Listing Removed — Global MLS
- 2015-11-25 Listed $72,900 Global MLS
- 2010-10-11 Listing Removed — Global MLS
- 2009-11-10 Listed $97,900 Global MLS
- 2005-03-11 Sold (MLS) $34,900 Global MLS
- 2005-03-02 Sold (Public Records) $34,900 Public Records
- 2005-01-17 Listing Removed — Global MLS
- 2004-12-28 Listed $34,900 Global MLS
- 1999-03-05 Sold (Public Records) $57,900 Public Records
Property tax history
+1.2%/yrLatest (2025): $4,939 · +5.4% YoY. Source: county tax records.
Cash-flow waterfall
monthlySold comps — $/sqft
last 12 mo · ≤1 miLoading sold comps…