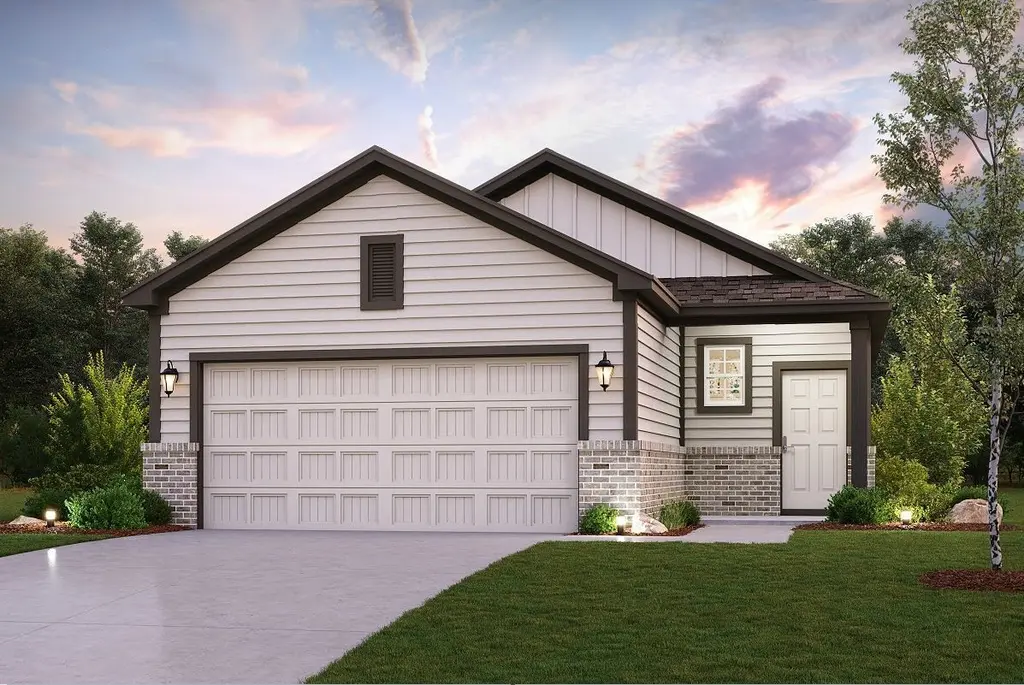
17863 Lionheart Rd · Deerwood, TX
Flood risk No data
- FEMA flood zone
- —
- Chance of flooding over 30 yrs
- —
- Est. flood insurance / yr
- —
Fire risk No data
- Est. fire insurance / yr
- —
Heat risk No data
- Hot days now (above threshold)
- —
- Hot days in 30 yrs
- —
Wind risk No data
- Chance of severe wind over 30 yrs
- —
Air-quality risk No data
- Unhealthy air days now
- —
- Unhealthy air days in 30 yrs
- —
Risk factors via First Street. Map © Google.
Why this score? — see what drove the D grade
The composite is a weighted blend of 9 inputs, each scored 0–100. Each bar is that input's sub-score; the figure is the points it added to the 100-point composite (weight × sub-score).
- Cash flow +14.4/30.0
- ARV discount +7.2/15.0
- Schools +5.1/10.0
- DSCR +4.4/10.0
- 1% rule +2.9/10.0
- Rent growth +2.5/5.0
- Livability +2.5/5.0
- Condition / age +2.5/5.0
- Appreciation +0.0/10.0
$234,900
🖨 Deal sheet (PDF) 📄 Offer letter ✓ Due diligence
Listing remarks MLS
The attractive Aspen plan centers around a large open kitchen, complete with an island and a built-in pantry. An airy great room—ideal for relaxing and entertaining—is steps away, as is a dining area. There are three spacious bedrooms, including a primary suite with a walk-in closet and a private bath with dual vanities and a walk-in shower.
Key facts
- Tiled walk-in shower
- Microwave oven
- Dishwasher
Tags
Neighborhood map
What this means for you Summary
Snapshot
- This is a 3-bed/2.0-bath land listed at $235k.
Deal economics
- At list price, monthly cash flow is $49 ($582/yr) — positive.
- The deal already cash-flows at list — no discount required.
- To meet the 1% rule (rent ≥ 1% of price), the offer needs to be $186k (20.9% below list).
- Recommended offer: $186k (20.9% below list) — sets the bar for 1% rule.
- Cap rate 6.5% vs local median 5.4% in Deerwood — meaningfully above typical; check what's discounted (condition, days-on-market, listing class) to confirm the premium yield is real.
Location & tenants
- Location reads: area grade D — affects rentability + tenant quality, not the cash-flow math above.
- Conroe ISD (other): math 57% / reading 57% proficiency, ranked #69 of 826 in TX (top 8%) — acceptable for families but not a draw, mixed tenant base, ~2y average lease.
- Zoned schools: Creighton El (math 31% / reading 27%, grade F, #2,668 of 4,322 statewide, top 63%, 940 students, 92% FRL); Moorhead J H (math 35% / reading 42%, grade F, #704 of 1,662 statewide, top 43%, 1,391 students, 82% FRL); Conroe H S (math 32% / reading 51%, grade F, #767 of 1,632 statewide, top 47%, 4,915 students, 61% FRL) — zoned schools average 78% FRL vs 34% district-wide (44 pts higher); higher-poverty schools than district average — tighter screening recommended.
- Zoned-school proficiency averages 36% at this address vs 57% district-wide (-21 pts) — the specific schools serving this property underperform the Conroe ISD average; the district grade overstates school quality for this exact location.
- Market conditions: 416 active listings in the ZIP; 4 comparable units currently listed for rent nearby; rentals lingering (median 46d on market — plan ~5-8 weeks vacancy on turnover, expect pricing pressure); 50% of comp listings sitting > 30 days — soft ceiling on asking rent; solid renter incomes; 13,259 units permitted in Montgomery County in 2024 (1,402 in 5+ unit buildings).
Forward outlook
- Local home prices are declining (-3.0%/yr); year-one equity from $2k of loan paydown is wiped out by about $7k of value loss. Plan a longer hold.
- Montgomery County population projected at +65% by 2050 — long-run rental-demand tailwind backs the buy-and-hold thesis.
Negotiation context
- It's been on market 163 days — a 12% lower offer ($207k) is reasonable based on typical stale-listing flexibility.
- 2 sale attempts with the ask held roughly flat each time — persistent listings suggest the price (not the market) is what's stuck; bring a comps-based counter.
Questions for the listing agent
- It's been on market 163 days. Have you received any prior offers? Is the seller open to a 21% concession, seller financing, or rate buy-down credit?
- What does the HOA fee cover, when was the last increase, and are there any pending special assessments or reserve-fund shortfalls?
- Why hasn't it sold? Are there any deal-killer items the seller is aware of (foundation, flood, title, zoning, code violations)?
- Is there a deadline driving the sale (1031 exchange, divorce, estate, relocation)? That informs how much negotiation room exists.
- The area grade is low — what's the realistic commute time and amenity access for the typical tenant pool here? Any planned neighborhood developments (good or bad) we should know about?
- What's the average days-on-market for RENTAL listings here right now (not sales)? A rising rental-DOM trend means longer vacancies and softer asking-rent achievability than the comps imply.
- What's the recent tenant-quality profile in this submarket — average credit score on applications, eviction rate, late-payment / NSF rate, and stable-employment percentage? A property-management company in the area should have these aggregated.
- How much new for-sale + rental construction is in the pipeline within 1–3 miles? Heavy new supply typically softens prices + rents 12–24 months out; constrained supply supports both.
Investment metrics
- 1% rule
- 0.79% ✗
- Cap rate
- 6.54%
- Cash-on-cash
- 0.88%
- DSCR
- 1.04
- GRM
- 10.5
CMA / ARV
- ARV (median comp)
- $233,559
- List price
- $234,900
- Delta
- 0.57%
- Verdict
- FAIR
- Comps
- 20 within 1.0 mi
Projected returns pro-forma
-3.0% appreciation · 3.0% rent growth · sell at horizon
- IRR
- -14.9%
- Equity multiple
- 0.47×
- Total profit
- $-35,072
- Equity at exit
- $35,024
- IRR
- -6.4%
- Equity multiple
- 0.59×
- Total profit
- $-26,959
- Equity at exit
- $20,310
Cash invested: $65,772 (down + closing). Projections, not guarantees.
Landlord ↔ Tenant lean methodology
- Overall (STATE)
- 87 Strongly Landlord-Friendly
- State Texas
- 87 Strongly Landlord-Friendly · R+5
- County
- — inherits STATE
- City
- — inherits STATE
ZIP-level market 77306
- Home prices YoY
- -4.1%
- Active inventory
- 416
- Price-to-rent
- 10.5×
Monthly cashflow live
- Estimated rent
- $1,857 medium interval (Pro) →
- Mortgage (P&I)
- −$1,232
- Tax from tax record
- −$39 /mo · $470/yr
- Insurance
- −$98
- HOA
- −$50
- Vacancy / Maint / Mgmt
- −$390
- Net cashflow
- $49
Break-even live
Sensitivity live
| Price | -10% $181 | -5% $115 | +0% $49 | +5% $-287 | +10% $-368 |
|---|---|---|---|---|---|
| Rent | -10% $-98 | -5% $-25 | +0% $49 | +5% $122 | +10% $195 |
| Rate | -1.0pp $167 | -0.5pp $108 | base $49 | +0.5pp $-12 | +1.0pp $-74 |
UW: 25.0% down · 7.5% · 30yr · 1.5% tax · 5.0% vac · 8.0% maint · 8.0% mgmt
Financing live
Cash to close
- Down payment
- $58,725
- Closing costs
- $7,047
- Reserves months
- —
- Total cash needed
- —
Loan-product check · same deal, 3 products live
Conventional
25% down · 7.5% · 30yr
- Down + closing
- —
- Monthly P&I
- —
- Monthly cashflow
- —
- DSCR
- —
- Eligible?
- —
Personal DTI + credit; lowest rate.
DSCR
20% down · 8.5% · 30yr
- Down + closing
- —
- Monthly P&I
- —
- Monthly cashflow
- —
- DSCR
- —
- Eligible?
- —
No personal income docs; deal must DSCR.
Hard money
10% down · 12.0% · 12mo
- Down + closing
- —
- Monthly P&I
- —
- Monthly cashflow
- —
- DSCR
- —
- Eligible?
- —
Short-term bridge; refi at stabilization.
Rent comps 4 comps
| Address | Beds | Baths | Sqft | Rent | $/sqft | DOM | Units | Dist |
|---|---|---|---|---|---|---|---|---|
| 2140 Cedar Bend Dr Conroe, TX | 4.0 | 3.0 | 1871 | $1,995 | $1.07 | 12d | 1 | 0.51mi |
| 308 Kinsman Rd Cleveland, TX | 3.0 | 1.5 | 1400 | $1,650 | $1.18 | 9d | 1 | 1.09mi |
| 308 Kinsman Rd Cleveland, TX | 3.0 | 1.5 | 1400 | $1,650 | $1.18 | 45d | 1 | 1.09mi |
| 6621 W Forest Rd Conroe, TX | 3.0 | 2.0 | 952 | $1,450 | $1.52 | 45d | 1 | 1.26mi |
HOA detail
- Monthly dues
- $50 · $600/yr
Listing history 21 events
-
2026-06-21days on market $234,900 Active 163 DOM
-
2026-06-18days on market $234,900 Active 160 DOM
-
2026-06-17days on market $234,900 Active 159 DOM
-
2026-06-16days on market $234,900 Active 158 DOM
-
2026-06-16remarks 359-char remark
-
2026-06-15days on market $234,900 Active 157 DOM
-
2026-06-13days on market $234,900 Active 155 DOM
-
2026-06-09days on market $234,900 Active 151 DOM
-
2026-06-08days on market $234,900 Active 150 DOM
-
2026-06-07days on market $234,900 Active 149 DOM
-
2026-06-04days on market $234,900 Active 146 DOM
-
2026-06-03days on market $234,900 Active 145 DOM
-
2026-06-02days on market $234,900 Active 144 DOM
-
2026-06-01days on market $234,900 Active 143 DOM
-
2026-05-31days on market $234,900 Active 142 DOM
-
2026-05-07price $234,900 355-char remark
Show marketing remark (355 chars)
The attractive Aspen plan centers around a large open kitchen, complete with an island and a built-in pantry. An airy great room—ideal for relaxing and entertaining—is steps away, as is a dining area. There are three spacious bedrooms, including a primary suite with a walk-in closet and a private bath with dual vanities and a walk-in shower.
-
2026-05-06price $234,900 495-char remark
Show marketing remark (495 chars)
The Aspen - With 1388 Square feet, the Aspen plan is a 3 bedroom/2 bath and offers ample space. 42" cabinets, stainless steel appliances, microwave oven, and dishwasher are some of the features this home offers. Wait until you see the luxurious 5' tiled walk-in shower in the primary bedroom! With ceiling fans in the primary bedroom and great room, you'll stay cool and comfortable all year round. The garage door opener, blinds, and keyless entry add extra convenience to your daily life.
-
2026-03-22price $239,900 495-char remark
Show marketing remark (495 chars)
The Aspen - With 1388 Square feet, the Aspen plan is a 3 bedroom/2 bath and offers ample space. 42" cabinets, stainless steel appliances, microwave oven, and dishwasher are some of the features this home offers. Wait until you see the luxurious 5' tiled walk-in shower in the primary bedroom! With ceiling fans in the primary bedroom and great room, you'll stay cool and comfortable all year round. The garage door opener, blinds, and keyless entry add extra convenience to your daily life.
-
2026-03-20price $239,900 355-char remark
Show marketing remark (355 chars)
The attractive Aspen plan centers around a large open kitchen, complete with an island and a built-in pantry. An airy great room—ideal for relaxing and entertaining—is steps away, as is a dining area. There are three spacious bedrooms, including a primary suite with a walk-in closet and a private bath with dual vanities and a walk-in shower.
-
2026-01-09$244,900 Active 355-char remark
Show marketing remark (355 chars)
The attractive Aspen plan centers around a large open kitchen, complete with an island and a built-in pantry. An airy great room—ideal for relaxing and entertaining—is steps away, as is a dining area. There are three spacious bedrooms, including a primary suite with a walk-in closet and a private bath with dual vanities and a walk-in shower.
-
2026-01-01$244,900 Active 495-char remark
Show marketing remark (495 chars)
The Aspen - With 1388 Square feet, the Aspen plan is a 3 bedroom/2 bath and offers ample space. 42" cabinets, stainless steel appliances, microwave oven, and dishwasher are some of the features this home offers. Wait until you see the luxurious 5' tiled walk-in shower in the primary bedroom! With ceiling fans in the primary bedroom and great room, you'll stay cool and comfortable all year round. The garage door opener, blinds, and keyless entry add extra convenience to your daily life.
ⓘ Source: listings_history table (triggers on properties + properties_extension) + one-shot
backfill from property_details.listing_events for pre-trigger history.
Tax reassessment forecast TX · Resets to sale price
- Current annual tax
- $470 · $39/mo
- Projected year-2 tax
- $4,299 · $358/mo
- Expected delta
- +$3,829/yr (+$319/mo · 814.6%)
ⓘ Screening estimate from a state-policy table — verify with the county assessor before closing.
Nearby sold comps map
Loading sold comps map…
Walkable amenities ~0.75 mi
Loading nearby amenities…
Taxation est. · year 1
- Rental income
- $22,289
- − Mortgage interest
- −$13,158
- − Property taxes
- −$470
- − Insurance
- −$1,174
- − Repairs & maintenance
- −$1,783
- − Management
- −$1,783
- − HOA
- −$600
- − Depreciation
- −$6,833
- Taxable loss
- −$3,513
- Est. tax savings @ 24.0%
- +$843
- After-tax cash flow
- $1,425/yr
For passive investors: Depreciation is non-cash, so a rental often shows a tax loss while cash-flowing — sheltering income. Rental losses are passive: they offset passive income freely, and up to $25,000/yr can offset ordinary (W-2) income if you actively participate and your MAGI is under $100k (phasing out to $0 by $150k); unused losses carry forward. On sale, claimed depreciation is recaptured at up to 25%, and gains may owe capital-gains tax (a 1031 exchange can defer both). Figures are a year-1 estimate at your 24.0% rate — not tax advice; consult a CPA.
Schools (NCES district)
- District
- Conroe ISD
- NCES district ID
- 4815000
- Math proficiency
- 57% ▼ -6.00%
- Reading proficiency
- 57% ▼ -1.00%
- Median HH income
- $71,541
- Composite
- 50.65/100
- National rank
- #1833
- State rank
- #69 of 826 in TX
Livability — Deerwood
No livability data for this city. (Only ~50 U.S. cities are tracked.)
Census & demographics
- County
- Montgomery County · 663,713 people
- Metro
- Houston-The Woodlands-Sugar Land, TX
- Population (ZIP)
- 18,086
- Household income
- $76,257
- Rent vs Own
- Severe rent burden
- 231.0
Population outlook (Montgomery County) Hauer SSP2
- Today (2025)
- 713,896 people
- By 2030
- 805,263 · +12.8%
- By 2040
- 992,708 · +39.1%
- By 2050
- 1,179,590 · +65.2%
- By 2075
- 1,628,084 · +128.1%
- By 2100
- 1,937,880 · +171.5%
Race, ethnicity, and origin ACS 2023
- Neighborhood character
- Majority Hispanic (55%)
- Race & ethnicity
- Hispanic / Latino 55% White 41% Two or more races 11% Black 2%
- Hispanic origin (detail)
- Mexican 51%
- Common ancestry
- Iranian 1% Slovak 1% Lithuanian 1%
- Foreign-born
- 21% · Canada
- Languages at home
- 53% English-only · Spanish 45% German/W. Germanic 1%
Political lean MEDSL · Montgomery
- 2024 margin
- Solid R (+45.5) · D 26.8% · R 72.3%
- 2008→2024 swing
- +7.2pp toward D · 2008: -52.7pp · 2024: -45.5pp
- All cycles
- 2024: R+45.5 2020: R+43.8 2016: R+51.4 2012: R+60.7 2008: R+52.7
Not yet ingested
- Civics
- —
Market trends
- HPI YoY
- ▼ -13.02%
- Current HPI
- 306.3801
- Rent YoY
- —
- Metro
- Houston-The Woodlands-Sugar Land, TX
- State GDP YoY
- ▲ 3.95%
- F500 in state
- 110
Industry mix (Fortune 500 HQ in TX)
| Industry | F500 HQs | Revenue |
|---|---|---|
| Energy | 16 | $1,198B |
|
||
| Technology | 5 | $198B |
|
||
| Engineering / Construction | 4 | $72B |
|
||
| Energy Services | 3 | $60B |
|
||
| Utilities | 3 | $41B |
|
||
| Healthcare | 2 | $330B |
|
||
Price history
-4.1% since first listed6 events — show timeline
- 2026-05-07 Price Changed $234,900 HARMLS
- 2026-05-06 Price Changed $234,900 Zillow
- 2026-03-22 Price Changed $239,900 Zillow
- 2026-03-20 Price Changed $239,900 HARMLS
- 2026-01-09 Listed $244,900 HARMLS
- 2026-01-01 Listed $244,900 Zillow
Property tax history
-0.4%/yrLatest (2025): $470 · -0.4% YoY. Source: county tax records.
Cash-flow waterfall
monthlySold comps — $/sqft
last 12 mo · ≤1 miLoading sold comps…