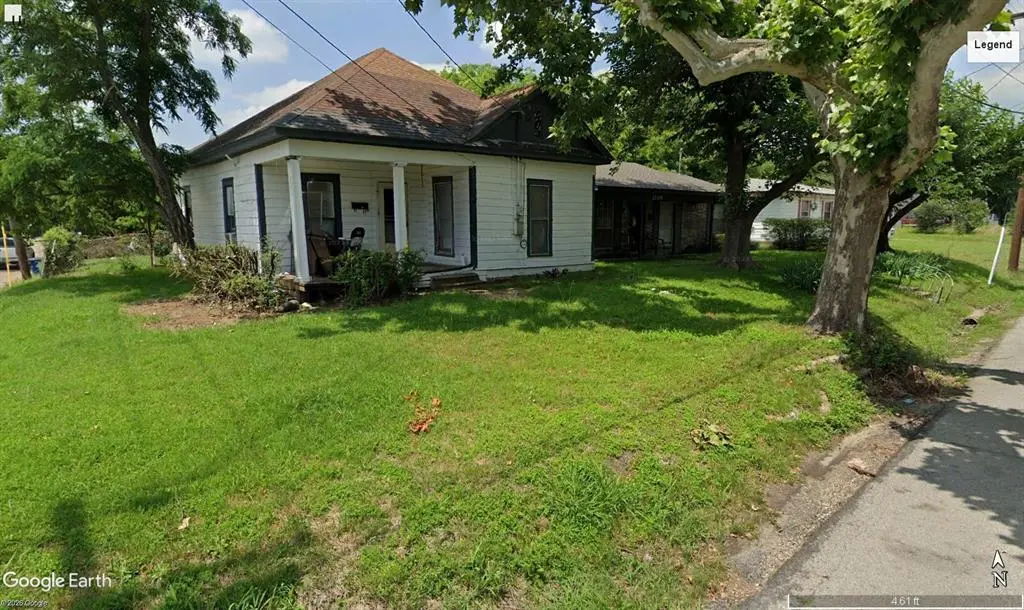
1210 W Brown St · Ennis, TX
Flood risk 1/10 · Minimal
- FEMA flood zone
- X (unshaded)
- Chance of flooding over 30 yrs
- 0.0%
- Est. flood insurance / yr
- $507 – $1,088
Fire risk 4/10 · Minor
- Est. fire insurance / yr
- $1,222 – $2,270
Heat risk 7/10 · Major
- Hot days now (above 109°F)
- 7 days/yr
- Hot days in 30 yrs
- 25 days/yr
Wind risk 6/10 · Moderate
- Chance of severe wind over 30 yrs
- 35.0%
Air-quality risk 2/10 · Minimal
- Unhealthy air days now
- 0 days/yr
- Unhealthy air days in 30 yrs
- 1 days/yr
Risk factors via First Street. Map © Google.
Why this score? — see what drove the B grade
The composite is a weighted blend of 9 inputs, each scored 0–100. Each bar is that input's sub-score; the figure is the points it added to the 100-point composite (weight × sub-score).
- Cash flow +30.0/30.0
- 1% rule +10.0/10.0
- DSCR +10.0/10.0
- ARV discount +7.5/15.0
- Livability +3.6/5.0
- Schools +3.4/10.0
- Rent growth +3.2/5.0
- Condition / age +2.5/5.0
- Appreciation +0.0/10.0
$58,900
🖨 Deal sheet (PDF) 📄 Offer letter ✓ Due diligence
Listing remarks
Offer deadline 5pm Sunday May 10th. Multiple Offers. Prime opportunity for investors! This property is a blank canvas ready for a complete renovation. Situated on a desirable corner lot, it offers excellent potential for resale, or rental income. Located in a convenient area with easy access to major roads, shopping, and amenities. Bring your vision—this one is priced for a full rehab and being sold as-is. Calling all investors, flippers, and builders—don’t miss this value-add opportunity!
Key facts
- Easy access
- Complete renovation
- Convenient area
Tags
Property features AI
Finance
- Other: Possession at closing/funding; Listing status: Active; Listing agreement: Exclusive Right To Sell; Photos available: 1
- Financial info: Treat as clear loan type; No second mortgage
- HOA & community: No association
Exterior
- Parking: No garage / no covered parking or carport
- Utilities: City water; City sewer; No municipal utility district
- Home design: Single family residence; Residential property; Built in 1920; Detached (not attached to other units)
- Construction: Wood construction; Preowned
- Exterior features: Lot less than 0.5 acre (approx. 0.115 acre); Subdivision: J Rowe Ennis
Interior
- Kitchen: Cook stove excluded (belongs to owner's granddaughter and will be removed)
- Bedrooms: Primary bedroom on level 1 (approx. 11 x 10)
- Bathrooms: 1 full bathroom
- Interior features: One-level layout; One living area; One dining area; Total of 2 rooms (per listing); Appliances: Other
Neighborhood map
What this means for you Summary
Snapshot
- This is a 3-bed/1.0-bath single-family listed at $59k.
Deal economics
- At list price, monthly cash flow is $740 ($9k/yr) — positive.
- The deal already cash-flows at list — no discount required.
- Meets the 1% rule at list price ($2k rent vs $59k).
- Cap rate 21.4% vs local median 4.5% in Ennis — top-decile yield for the area; either an underpriced asset or a hidden risk that comps aren't pricing in. Stress-test before assuming the spread holds.
Location & tenants
- Location reads 71/100 on livability (#304 in TX) — a middle-class / working-renter tenant base. Strengths: cost of living A+, housing A+, crime B+; Watch: amenities F, commute F, health & safety F.
- Ennis ISD (rural): math 41% / reading 39% proficiency, ranked #411 of 826 in TX (top 50%) — families likely to look elsewhere, expect single-tenant / working-renter base with shorter leases; 60% free/reduced lunch — lower-income household profile, screen leases tightly.
- Zoned schools: Houston El (math 37% / reading 37%, grade F, #1,769 of 4,322 statewide, top 44%, 302 students, 77% FRL) — zoned schools average 77% FRL vs 60% district-wide (17 pts higher); higher-poverty schools than district average — tighter screening recommended.
- Market conditions: Rents rising (+3.0%/yr); 364 active listings in the ZIP; 13 comparable units currently listed for rent nearby; rentals leasing fast (median 14d on market — plan ~1-2 weeks tenant-placement turnaround); solid renter incomes; 3,016 units permitted in Ellis County in 2024 (20 in 5+ unit buildings).
Forward outlook
- Local home prices are declining (-3.0%/yr); year-one equity from $407 of loan paydown is wiped out by about $2k of value loss. Plan a longer hold.
- Ellis County population projected at +36% by 2050 — long-run rental-demand tailwind backs the buy-and-hold thesis.
- At projected returns (-3.0% appreciation + 3.0% rent growth), your $16k cash investment doubles in ~3 years — after that, you're playing with house money.
Negotiation context
- Only 3 days on market — expect competitive offers; lowballing is unlikely to land.
Risks & watch-outs
- Watch-outs: property tax is 4.7% of price; built in 1920 — expect roof / HVAC / electrical / plumbing capex.
- Climate carrying-cost: major wind risk, 35% chance of damaging wind over 30y; extreme-heat days projected 7→25/yr by 2055 (HVAC capex compounding) — expect insurance premiums to compound above CPI over the hold.
Questions for the listing agent
- Built in 1920 — when were the roof, HVAC, electrical panel, plumbing, and water heater last replaced?
- Property tax is high relative to price — has the assessment been appealed recently, and will the sale trigger a re-assessment?
- Is there a deadline driving the sale (1031 exchange, divorce, estate, relocation)? That informs how much negotiation room exists.
- Schools are D-rated, which usually means shorter tenancies and higher turnover. Who's the typical renter profile here, and what's been the actual vacancy rate?
- What's the average days-on-market for RENTAL listings here right now (not sales)? A rising rental-DOM trend means longer vacancies and softer asking-rent achievability than the comps imply.
- What's the recent tenant-quality profile in this submarket — average credit score on applications, eviction rate, late-payment / NSF rate, and stable-employment percentage? A property-management company in the area should have these aggregated.
- How much new for-sale + rental construction is in the pipeline within 1–3 miles? Heavy new supply typically softens prices + rents 12–24 months out; constrained supply supports both.
Investment metrics
- 1% rule
- 2.80% ✓
- Cap rate
- 21.37%
- Cash-on-cash
- 53.83%
- DSCR
- 3.40
- GRM
- 3.0
CMA / ARV
- ARV (on-the-fly)
- $183,148
- Comps found
- 4
Show comp detail 4 sales within ~0.75 mi
| Address | Dist | Beds/Ba | Sqft | Sold | Price | $/sf | Match |
|---|---|---|---|---|---|---|---|
| 806 Metropolitan St | 0.50mi | 3/1.5 | 936 (+8%) | 5mo | $197,900 | $211 | 57 |
| 914 S Chatfield St | 0.55mi | 2/2.0 (-1) | 948 (+9%) | 1mo | $192,900 | $203 | 49 |
| 504 W Lampasas St | 0.51mi | 2/1.0 (-1) | 982 (+13%) | 17mo | $135,000 | $137 | 36 |
| 1204 Ann Dr | 0.70mi | 3/1.5 | 936 (+8%) | 23mo | $220,000 | $235 | 33 |
Match score weights: distance 35% · size 25% · config 20% · recency 20%. Top-matched comps best support the ARV.
Projected returns pro-forma
-3.0% appreciation · 2.95% rent growth · sell at horizon
- IRR
- 52.0%
- Equity multiple
- 3.28×
- Total profit
- $37,612
- Equity at exit
- $8,782
- IRR
- 57.3%
- Equity multiple
- 6.67×
- Total profit
- $93,575
- Equity at exit
- $5,093
Cash invested: $16,492 (down + closing). Projections, not guarantees.
Landlord ↔ Tenant lean methodology
- Overall (STATE)
- 87 Strongly Landlord-Friendly
- State Texas
- 87 Strongly Landlord-Friendly · R+5
- County
- — inherits STATE
- City
- — inherits STATE
ZIP-level market 75119
- Rents YoY
- 3.0%
- Active inventory
- 364
- Price-to-rent
- 3.0×
Monthly cashflow live
- Estimated rent
- $1,649 high interval (Pro) →
- Mortgage (P&I)
- −$309
- Tax from tax record
- −$230 /mo · $2,757/yr
- Insurance
- −$25
- HOA
- −$0
- Vacancy / Maint / Mgmt
- −$346
- Net cashflow
- $740
Break-even live
Sensitivity live
| Price | -10% $937 | -5% $756 | +0% $740 | +5% $723 | +10% $706 |
|---|---|---|---|---|---|
| Rent | -10% $610 | -5% $675 | +0% $740 | +5% $805 | +10% $870 |
| Rate | -1.0pp $769 | -0.5pp $755 | base $740 | +0.5pp $725 | +1.0pp $709 |
UW: 25.0% down · 7.5% · 30yr · 1.5% tax · 5.0% vac · 8.0% maint · 8.0% mgmt
Financing live
Cash to close
- Down payment
- $14,725
- Closing costs
- $1,767
- Reserves months
- —
- Total cash needed
- —
Loan-product check · same deal, 3 products live
Conventional
25% down · 7.5% · 30yr
- Down + closing
- —
- Monthly P&I
- —
- Monthly cashflow
- —
- DSCR
- —
- Eligible?
- —
Personal DTI + credit; lowest rate.
DSCR
20% down · 8.5% · 30yr
- Down + closing
- —
- Monthly P&I
- —
- Monthly cashflow
- —
- DSCR
- —
- Eligible?
- —
No personal income docs; deal must DSCR.
Hard money
10% down · 12.0% · 12mo
- Down + closing
- —
- Monthly P&I
- —
- Monthly cashflow
- —
- DSCR
- —
- Eligible?
- —
Short-term bridge; refi at stabilization.
Rent comps 13 comps
| Address | Beds | Baths | Sqft | Rent | $/sqft | DOM | Units | Dist |
|---|---|---|---|---|---|---|---|---|
| 710 W Waco St Ennis, TX | 3.0 | 2.0 | 1092 | $1,750 | $1.60 | 13d | 1 | 0.32mi |
| 1803 W Ennis Ave Ennis, TX | 1.0–2.0 | 1.0–2.0 | 908 | $1,729 | $1.90 | 0d | 14 | 0.42mi |
| 914 S Chatfield St Ennis, TX | 2.0 | 2.0 | 948 | $1,595 | $1.68 | 7d | 1 | 0.52mi |
| 715 W Tyler St Unit 715 Ennis, TX | 4.0 | 1.5 | 1000 | $1,700 | $1.70 | 44d | 1 | 0.58mi |
| 800 N Clay St Apt E14 Ennis, TX | 2.0 | 1.0 | 803 | $1,000 | $1.25 | 17d | 1 | 0.71mi |
| 110 W Knox St Unit 202 Ennis, TX | 2.0 | 1.0 | 882 | $1,400 | $1.59 | 25d | 1 | 0.72mi |
| 605 SW Main St Ennis, TX | 2.0 | 1.0 | 784 | $1,500 | $1.91 | 25d | 1 | 0.76mi |
| 1401 Old Bardwell Rd Unit B Ennis, TX | 2.0 | 2.0 | 931 | $1,195 | $1.28 | 16d | 1 | 0.79mi |
| 1212 Grace Cir Ennis, TX | 1.0–3.0 | 1.0–2.0 | 905 | $1,500 | $1.66 | 0d | 2 | 0.85mi |
| 1203 N Clay St Unit 122 Ennis, TX | 2.0 | 2.0 | 1000 | $1,400 | $1.40 | 44d | 1 | 0.89mi |
| 205 W Gilmer St Ennis, TX | 2.0 | 1.0 | 1052 | $1,495 | $1.42 | 13d | 1 | 0.93mi |
| 205 W Gilmer St Ennis, TX | 2.0 | 1.0 | 1052 | $1,400 | $1.33 | 8d | 1 | 0.93mi |
| 1101 Biloxi Dr Ennis, TX | 1.0–3.0 | 1.0–2.0 | 909 | $1,575 | $1.73 | 0d | 4 | 1.16mi |
Listing history 2 events
-
2026-05-11status Pending
-
2026-05-08$58,900 Active
ⓘ Source: listings_history table (triggers on properties + properties_extension) + one-shot
backfill from property_details.listing_events for pre-trigger history.
Tax reassessment forecast TX · Resets to sale price
- Current annual tax
- $2,757 · $230/mo
- Projected year-2 tax
- $2,757 · $230/mo
- Expected delta
- $0/yr ($0/mo · 0.0%)
ⓘ Screening estimate from a state-policy table — verify with the county assessor before closing.
Climate risk First Street
- Flood 1/10 Low FEMA zone X (unshaded) · 0% chance over 30 yrs
- Wildfire 4/10 Moderate
- Heat 7/10 Severe 7 d/yr ≥109°F today · 25 d/yr by 30 yrs out
- Wind 6/10 Major 35% chance of damaging wind over 30 yrs
- Air quality 2/10 Low 0 unhealthy d/yr today · 1 by 30 yrs out
Nearby sold comps map
Loading sold comps map…
Walkable amenities ~0.75 mi
Loading nearby amenities…
Taxation est. · year 1
- Rental income
- $19,792
- − Mortgage interest
- −$3,299
- − Property taxes
- −$2,757
- − Insurance
- −$294
- − Repairs & maintenance
- −$1,583
- − Management
- −$1,583
- − Depreciation
- −$1,713
- Taxable income
- $8,561
- Est. tax owed @ 24.0%
- −$2,055
- After-tax cash flow
- $6,823/yr
For passive investors: Depreciation is non-cash, so a rental often shows a tax loss while cash-flowing — sheltering income. Rental losses are passive: they offset passive income freely, and up to $25,000/yr can offset ordinary (W-2) income if you actively participate and your MAGI is under $100k (phasing out to $0 by $150k); unused losses carry forward. On sale, claimed depreciation is recaptured at up to 25%, and gains may owe capital-gains tax (a 1031 exchange can defer both). Figures are a year-1 estimate at your 24.0% rate — not tax advice; consult a CPA.
Schools (NCES district)
- District
- Ennis ISD
- NCES district ID
- 4818540
- Math proficiency
- 41% ▼ -6.00%
- Reading proficiency
- 39% ▼ -3.00%
- Median HH income
- $46,105
- Composite
- 34.14/100
- National rank
- #5283
- State rank
- #411 of 826 in TX
Livability — Ennis
- Score
- 71/100
- State rank
- #304
- US rank
- #6893
Category grades
Schools grade is shown separately in the Schools card above.
Census & demographics
- Census place
- Ennis, TX
- County
- Ellis County · 199,237 people
- City population
- 31,866
- Metro
- Dallas-Fort Worth-Arlington, TX
- Population (ZIP)
- 31,866
- Household income
- $77,053
- Rent vs Own
- Severe rent burden
- 784.0
Population outlook (Ellis County) Hauer SSP2
- Today (2025)
- 194,556 people
- By 2030
- 209,679 · +7.8%
- By 2040
- 238,837 · +22.8%
- By 2050
- 265,451 · +36.4%
- By 2075
- 326,571 · +67.9%
- By 2100
- 362,156 · +86.1%
Race, ethnicity, and origin ACS 2023
- Neighborhood character
- Diverse neighborhood (Simpson 0.60)
- Race & ethnicity
- White 47% Hispanic / Latino 41% Two or more races 13% Black 9%
- Hispanic origin (detail)
- Mexican 37%
- Common ancestry
- Slovak 1% Serbian 1% Italian 1%
- Foreign-born
- 15% · Canada
- Languages at home
- 69% English-only · Spanish 29% Other Indo-European 1%
Political lean MEDSL · Ellis
- 2024 margin
- Solid R (+31.1) · D 34.0% · R 65.1%
- 2008→2024 swing
- +11.2pp toward D · 2008: -42.2pp · 2024: -31.1pp
- All cycles
- 2024: R+31.1 2020: R+34.1 2016: R+45.4 2012: R+47.5 2008: R+42.2
Not yet ingested
- Civics
- —
Market trends
- HPI YoY
- ▼ -207.30%
- Current HPI
- 253.0134
- Rent YoY
- ▲ 2.95%
- Metro
- Dallas-Fort Worth-Arlington, TX
- State GDP YoY
- ▲ 3.95%
- F500 in state
- 110
Industry mix (Fortune 500 HQ in TX)
| Industry | F500 HQs | Revenue |
|---|---|---|
| Energy | 16 | $1,198B |
|
||
| Technology | 5 | $198B |
|
||
| Engineering / Construction | 4 | $72B |
|
||
| Energy Services | 3 | $60B |
|
||
| Utilities | 3 | $41B |
|
||
| Healthcare | 2 | $330B |
|
||
Price history
2 events — show timeline
- 2026-05-11 Pending — NTREIS
- 2026-05-08 Listed $58,900 NTREIS
Property tax history
+9.4%/yrLatest (2025): $2,757 · +20.9% YoY. Source: county tax records.
Cash-flow waterfall
monthlySold comps — $/sqft
last 12 mo · ≤1 miLoading sold comps…